Near Infrared High Resolution Spectroscopy and Spectro-astrometry of Gas in Disks around Herbig Ae/Be Stars
Abstract
In this review, we describe how high resolution near infrared spectroscopy and spectro-astrometry have been used to study the disks around Herbig Ae/Be stars. We show how these tools can be used to identify signposts of planet formation and elucidate the mechanism by which Herbig Ae/Be stars accrete. We also highlight some of the artifacts that can complicate the interpretation of spectro-astrometric measurements and discuss best practices for mitigating these effects. We conclude with a brief discussion of the value of long term monitoring of these systems.
Keywords stars: circumstellar matter, individual (HD 100546), protoplanetary disks
1 Introduction
Herbig Ae/Be stars are intermediate mass (2-8M☉) pre-main sequence and zero age-main sequence stars whose spectral energy distribution reveals an infrared excess (Herbig 1960; Waters & Waelkens 1998; Vieira et al. 2003). They are the precursors to main sequence A-stars many of which have debris disks (Su et al. 2005; 2006). As the higher mass analogs to classical T Tauri stars, Herbig Ae/Be stars provide an important link between their lower mass solar analogs and high mass stars.
A great deal of progress has been made in the study of the circumstellar environment of Herbig Ae/Be stars since the last international conference on Herbig Ae/Be stars (The et al. 1994a). Over the past two decades, advances in coronagraphic imaging (Grady et al. 1999, 2005, 2014; Weinberger, et al. 1999), the (sub)millimeter (Mannings & Sargent 1997; Dent et al. 2005) and infrared observations (e.g. Meeus et al. 2001, 2012), and SED modeling (Dullemond et al. 2007) have advanced our understanding of this environment. While the the geometry of the dust giving rise to the infrared excess was controversial two decades ago (The et al. 1994b), it is now clear that Herbig Ae/Be stars possess flared disks in a Keplerian orbit - usually with a puffed up inner rim. Additionally, the study of post-main sequence stars that have evolved from A stars indicate that these disks form giant planets perhaps even more prodigiously than their lower mass counterparts (Johnson et al. 2010).
In addition to these tools, near infrared spectroscopy provides valuable insight to the gas in the inner region of the disk. For example, while this region (50 AU) remains difficult to study by direct imaging, the kinematic profile of resolved emission lines can serve as a surrogate for high resolution imaging by providing spatial information about the gas on milliarcsecond scales assuming the gas is in a Keplerian orbit and that the stellar mass and disk inclination are known. Ground based high resolution (R20,000) spectroscopy of ro-vibrational CO lines have been used to measure the distribution of molecular gas relative to dust in the inner disk. This technique was pioneered in the study of classical T Tauri stars and embedded YSOs (e.g. Najita et al. 2000, 2007) and has been applied extensively to gas in disks around Herbig Ae/Be Stars (e.g. Brittain & Rettig 2002; Brittain et al. 2003, 2007; Blake & Boogert 2004; Goto et al. 2006; van der Plas et al. 2009, 2010; Salyk et al. 2009; Brown, J. et al. 2013). The study of ro-vibrational CO lines has also complemented FIR studies of disks around Herbig Ae/Be stars by adding parameter space to constrain thermochemical models of disks (e.g. Carmona et al. 2014; Thi et al. 2014).
Spectroscopy of the infrared H I recombination lines has also advanced our understanding of Herbig Ae/Be stars. Moderate resolution spectroscopy combined with interferometry has constrained the size of the emitting region of H I to typically within 0.1 AU (Eisner et al. 2009; Kraus et al. 2008). A great deal of work has also been done to calibrate these lines against the accretion luminosity so that they can be used to measure the accretion rate of Herbig Ae/Bes (van den Ancker et al. 2005; Garcia Lopez et al. 2006, Donehew & Brittain 2011; Mendigutía et al. 2011; Pogodin et al. 2012).
A particularly exciting development in the use of NIR spectroscopy to study gas in disks is the application of spectro-astrometry. Spectro-astrometry is the measurement of the spatial center of the point spread function (PSF) of a spectrum as a function of wavelength (Bailey et al. 1998a). Because variations in the center of the PSF can be measured on much smaller angular scales than the diffraction limit of an instrument spectro-astrometry can provide spatial information on sub-milliarcsecond scales. This technique was initially developed with the advent of CCDs in the 1980s (see Bailey 1998b for a review) and has since been applied extensively to extract additional spatial information from spectra of a number of astrophysical phenomena such as binaries (Bailey et al. 1998a; Porter et al. 2004), YSO jets (Takami et al. 2003, Whelan et al. 2004; Davies et al. 2010), and circumstellar disks (Acke & van den Ancker 2006; Pontoppidan et al. 2008; Brittain et al. 2013; Brown, L. et al. 2013).
In this review we discuss how modeling line profiles spectrally and spatially provide information about the distribution of gas in disks around Herbig Ae/Be stars. We then highlight two example applications: identification of signposts of planet formation and the study of the origin of H I emission lines in Herbig Ae/Be stars. We follow with a discussion of sources of potential artifacts that may complicate the interpretation of spectro-astrometry measurements. We show the scope of these artifacts and how to acquire the data so as to mitigate their effect. We conclude with a brief discussion of future prospects for ground based study of gas in disks.
2 Technique
2.1 Line Profile Modeling
Planet forming disks begin their lives with high optical depths at most wavelengths. For the minimum mass solar nebula, the surface density at 1 AU is 1700 g cm-2 or about N(H)=1027 cm-2. For a gas to dust ratio and grain size distribution representative of the local interstellar medium, only the top 10-5 of the disk is optically thin at 5m. Grain growth and settling increase the depth of the optically thin portion of the disk atmosphere, but even so NIR observations only probe a thin layer of the disk. The line emission observed in the disk arises from this thin warm layer of the atmosphere. Thus observing H2 can be very challenging because of the weak oscillator strengths of the quadrupole transitions (Bitner et al. 2007; Carmona et al. 2011) and large H2 column densities are needed for detectable emission. CO has proven to be the most commonly observed species in disks despite the fact that its abundance is 10-4 – 10-6 that of H2. The ro-vibrational transitions of CO are a useful tracer of gas for a number of reasons. First, the relatively low sublimation temperature and high dissociation temperature makes it abundant throughout a circumstellar disk. Second, even relatively small columns of CO are self shielding. Ro-vibrational transitions are also readily observable from the ground (moderate Doppler shifts are necessary for the J11 v=1–0 transitions).
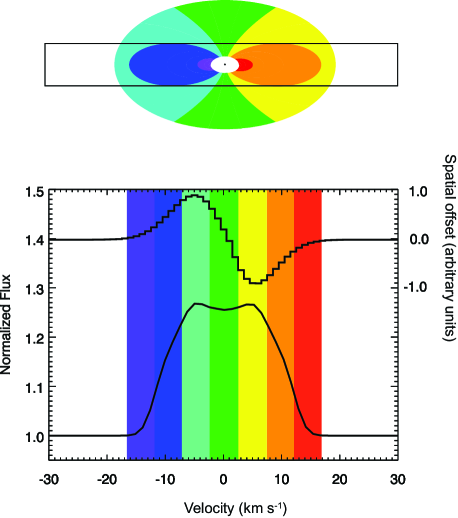
We can trace the distribution of this warm layer of gas in the disk by modeling the kinematic profile of the lines. If we assume the gas follows a circular Keplerian orbit and know the disk inclination and stellar mass, then the line profile can be readily calculated (e.g. Smak 1981; Figure 1). If the line is resolved, the inner and outer edge of the gas emission can be calculated. The half width at zero intensity (HWZI) of the emission line corresponds to the projected velocity of the gas at the inner edge of the detected region. The half-width of the peak separation corresponds to the velocity of outer extent of the emitting region.
Generally the data are modeled by assuming the gas distribution is axisymmetric and follows circular Keplerian orbits, however, this may not accurately describe gas in circumstellar disks. For example, the gas in orbit may be elliptical giving rise to asymmetric line profiles (Regály et al. 2010) or the gas may arise in a non-Keplerian orbit such as a disk wind (Carr 2007; Pontoppidan et al. 2011).
2.2 Spectroastrometry
Using a relatively new technique, spectroastrometry, one can test the assumption that the gas arises in a Keplerian orbit. Spectro-astrometry has been described in a number of papers (e.g. Bailey 1998ab; Porter et al. 2004; Brannigan et al. 2006; Whelan & Garcia 2008), so we limit our discussion to a brief overview of this technique - particularly as it applies to circumstellar disks.
While the spatial resolution of a PSF is limited to 1.2D/, the centroid of the PSF can be measured to a small fraction of that. For a well sampled Gaussian PSF dominated by photon noise, the center of the Gaussian can be measured to an accuracy of,
| (1) |
where is the center of the Gaussian, is the full width at half maximum power of the Gaussian, and is the signal to noise ratio of the PSF (Brannigan et al. 2006). With a SNR of 100 and an AO corrected beam of 0.12, the centroid of the PSF can be measured to an accuracy of 0.5 milliarcseconds assuming the PSF is adequately sampled. The spectro-astrometric signal is not a direct measure of the extent of the gas, rather it is the projection of the center of light of a given velocity channel along the axis of the slit.
Typically, the continuum is much brighter than the emission lines, so the continuum dominates the center of light. The extent of the offset depends on the angular extent of the emission, the asymmetry of the distribution of the emission along the axis of the slit, the brightness of the emission relative to the continuum, and the relative position angle of the disk and the slit. For example, if the slit is aligned with the semi-major axis of an inclined axisymmetric disk, gas in a Keplerian orbit will show emission lines where the red shifted side of the line is spatially offset toward one end of the slit while the blue shifted side of the emission line is offset toward the opposite end of the slit (figure 1). If the slit is rotated so that it is aligned with the semi-minor axis of the disk then the center of light of the red and blue shifted gas will be aligned with the center of the PSF and no offset will be measured.
This technique has provided valuable information about gas in disks. For example, high resolution spectra of the [O I] 6300 Å lines have been analyzed spectro-astrometrically (Acke & van den Ancker 2006). These authors show that the line is consistent with gas in Keplerian orbit about Herbig Ae/Be stars rather than arising in an outflow as in the case of T Tauri stars. In contrast, spectro-astrometric analysis of high resolution spectra of ro-vibrational CO emission from strongly accreting YSOs shows that the gas is less extended than the narrow profiles indicate if the gas were in a Keplerian orbit (Pontoppidan et al. 2011; Bast et al. 2012).
In the section that follows we describe two applications of spectral profile fitting and SA to elucidate aspects of disks around Herbig Ae/Be stars.
3 Applications
3.1 Signposts of Planet Formation
The identification of gas giant planets forming in circumstellar disks will represent a major milestone in the study of planet formation. By identifying forming planets we can connect the initial conditions in disks to the kinds of planets that form. We can also determine the disk radii at which planets form for comparison with the orbital radii of planets observed in more mature systems. Such observations can also test theoretical predictions that planets clear gaps in disks and accrete mass through circumplanetary disks, processes that affect the evolution of planetary masses. This approach is complementary to the direct detection of forming gas giant planets.
Direct detection is challenging due to the small angular separation between the forming gas giant planet and the host star as well as the high contrast between the forming planet and the disk. However, several exciting candidate forming objects have been identified by direct imaging (e.g., T Cha Huélamo et al. 2011; LkCa 15 Kraus & Ireland 2012; HD 100546 Quanz et al. 2013).
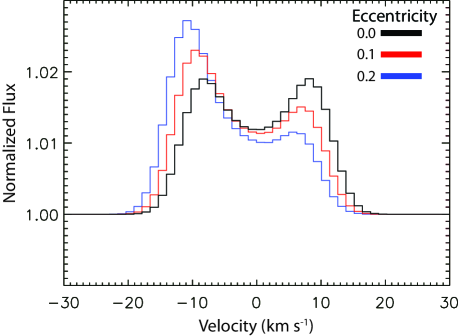
Another approach to identifying forming gas giant planets is to identify dynamical markers of tidal interactions between the disk and forming object. Hydrodynamic modeling of planet disk interaction indicates that a planet with a mass greater than 3MJupiter on a circular orbit can induce an eccentricity in the disk in the vicinity of its orbit (e.g. Kley & Dirksen 2006). Simulations show that the eccentricity can be as high as 0.25 and falls off as approximately r-2. The profile of a line arising from an eccentric annulus will generally not be symmetric. The gas at periastron will be faster than the gas at apastron and generally the temperatures will differ as well. This results in a distinctive asymmetric line profile (figure 2; see Regály et al. 2010 and Liskowsky et al. 2012). Interestingly, the semi-major axis of the disk precesses very slowly (10 per 1000 orbits), so the line profile should remain constant over decadal timescales. Such a line profile has been observed in OH spectra from the Herbig Ae binary V380 Ori (Fedele et al. 2011) and the Herbig Be star HD 100546 (Liskowsky et al. 2012). In the case of V380 Ori, it is likely a stellar companion that is driving the eccentricity whereas in the case of HD 100546 it is likely that a substellar object is driving the eccentricity. In principle, an asymmetric line profile could also arise from the uneven sampling of a resolved axisymmetric disk (e.g. Hein Bertelsen et al. 2014) which we will discuss in section 3.
Another way to identify ongoing planet formation is by detecting emission arising from a circumplanetary disk feeding the planet. Circumplanetary disks can be discovered by their line emission (Brittain et al. 2013; 2014) and also potentially by their dust continuum emission (Zhu 2014; Isella et al. 2014). Simulations of gas giant formation indicate that the disk feeding the gas giant planet will have a radius roughly one-third of the Hill Sphere (Quillen & Trilling 1998; Ayliffe & Bate 2009ab; Martin & Lubow 2011), though the full accretion envelope is likely intrinsically three dimensional with complicated flow patterns (e.g. Tanigawa et al. 2012; Ayliffe & Bate 2012; Gressel et al. 2013). Thus a 5MJupiter planet forming at an orbital radius of 10 AU should have a circumplanetary disk with a radius of 0.3 AU - comparable to the size of the emitting region of ro-vibrational CO emission observed toward classical T Tauri stars (Najita et al. 2003).
In the case of Herbig Ae/Be stars with transition disks, hot bands of ro-vibrational CO emission are observed from R10 AU (e.g. HD 179213, van der Plas 2010; HD 100546, Brittain et al. 2009; HD 141569 Brittain et al. 2003; HD 97048, van der Plas et al. 2009; and Oph IRS 48, Brown et al. 2012) due to the UV fluorescence of the gas. To detect the IR ro-vibrational emission lines that result from this process, a large area is needed because these transitions are exceeding optically thin. For example, the line flux of CO emission arising from HD 100546 is comparable to that observed from classical T Tauri stars in Taurus (compare for example, Brittain et al. 2009 and Najita et al. 2003). However, the emitting region of the CO observed toward HD 100546 extends over 50 AU while the emission from the classical T Tauri stars typically originates within 1 AU of the star. Thus UV fluoresced gas originating from a disk with a radius less than 1 AU will reveal ro-vibrational CO lines with luminosities 3-4 orders of magnitude fainter than what is observed from the transition disks mentioned above.
The contrast between the gas conditions which produce UV fluorescence (broadly distributed, perhaps tenuous, gas) and collisionally excited emission (warm, dense material) provides a way to identify circumplanetary disks. The surface density and temperature of the circumplanetary disk is expected to be enhanced relative to the feeding material (Klahr & Kley 2006; Matin & Lubow 2011). If the gas is of order K and optically thick, then the flux of the emission from the circumplanetary disk will be similar to what is observed from classical T Tauri stars.
A Herbig Ae/Be star with a transition disk created by a forming gas giant planet should then give rise to v=1–0 lines that are a blend of emission from the circumstellar disk and circumplanetary disk while the hotband transitions will be overwhelmingly dominated by the UV fluoresced gas in the circumstellar disk. Thus as the circumplanetary disk orbits the star, the shape of the v=1–0 lines will change with the motion of the circumplanetary disk. The hotband lines provide a constant fiducial profile against which to measure the evolution of the v=1–0 lines. This behavior, variable v=1–0 profiles with constant hotband profiles, is observed in HD 100546 (Brittain et al. 2013; 2014).
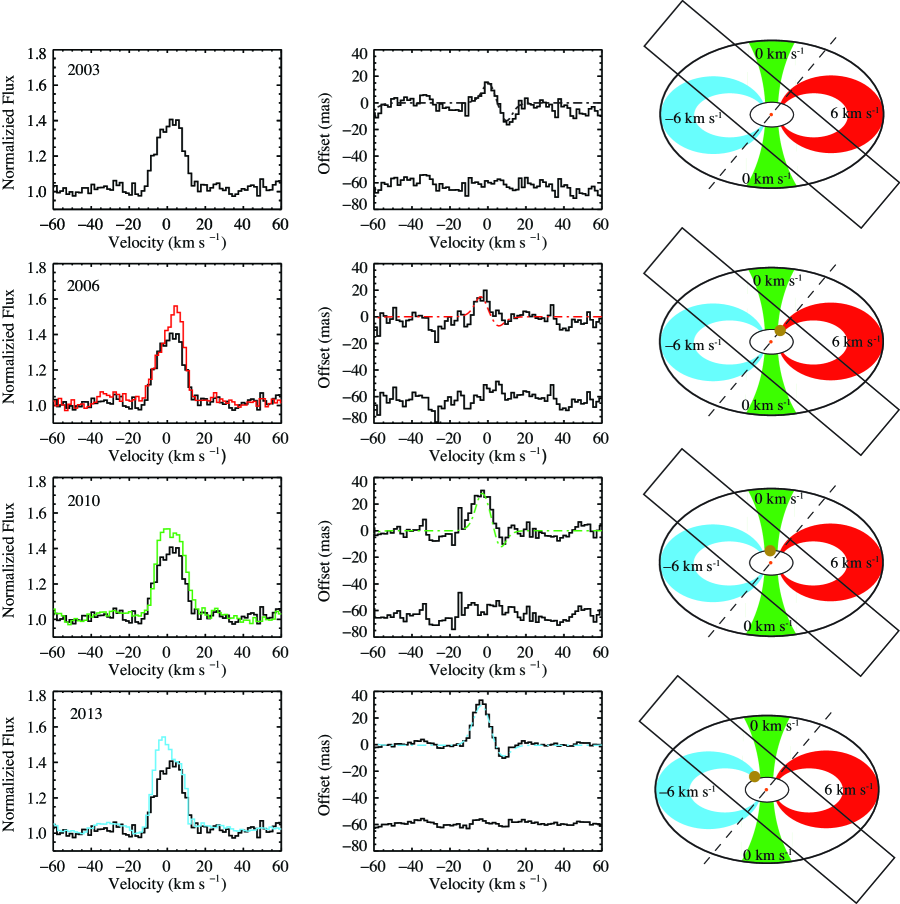
In January 2006 the red side of the v=1–0 P26 line at 0–10 km s-1 brightened relative to what was observed in January 2003 (second row of figure 3). The Doppler shift of this excess emission was 61 km s-1. In December 2010, the v=1–0 P26 was still brighter than it was in January 2003, however, the Doppler shift was –11 km s-1 (third row of figure 3). In March 2013 the excess emission was Doppler shifted –61 km s-1. Assuming the source of the excess emission is in a Keplerian orbit, the projected Doppler shifts and epochs of the observations place the emission near the inner edge of the outer disk (R13 AU). One way to test whether the shift of the excess v=1–0 line emission is due to gas in a Keplerian orbit and determine the radial position of the emission is to use spectro-astrometry.
Consider an inclined axisymmetric disk of gas in a circular Keplerian orbit. If the slit is aligned near the semi-major axis of the inclined disk, then the blue side of the emission lines formed in the disk will be offset in one direction along the slit axis and vice versa for the red side of the line, and the offsets would be symmetric (figure 1). This was observed for the v=1–0 P26 line in 2003 (top row of figure 3). But what happens if we add an extra localized source of emission at a given velocity to our disk? In this case, the center of light at the velocity of the extra source will be shifted closer to the added source of emission.
The extent and direction of the shift will depend on the location of the center of light along the slit axis. In the case of HD 100546, the first three observations were taken with the slit in its default position angle of 90 (Brittain et al. 2013). The position angle of the disk is 140 (Ardila et al. 2007). In 2006 not only was the red side of the line brighter relative to its brightness in 2003, the center of the PSF of the red side of the line was less extended in 2006 than it was in 2003 (second row of figure 3). As it turns out, for the combination of the slit PA and disk PA, an excess source of emission that orbits close to the inner disk edge of the outer disk (R13 AU) with a projected velocity of 6 km s-1 will be located near the center of the slit, just as required to explain the spectro-astrometric signal (second row of figure 3). In 2010, the spectral profile of the extended emission was broader and shifted to 1 km s-1. Placing this emission in the disk near the inner rim at the orbital position corresponding to this shift reproduces the spectro-astrometric signal (third row of figure 3). The same is observed for the observations acquired in 2013. From 2006 to 2010 to 2013, the Doppler shift of the emission, location of the emission projected along the slit axis, and period of the emission are all consistent with a source of thermal CO emission in a circular Keplerian orbit near 13 AU (Brittain et al. 2014).
3.2 The Origin of H I lines
A second important application of spectro-astrometry to the study of Herbig Ae/Be stars is the study of the origin of the H I recombination lines. The origin of these lines remains uncertain (Kraus et al. 2008): do they form in the stellar wind, disk wind, decretion disk, accretion flow, or some combination thereof? If the H I lines are connected to accretion, then they may serve as a useful proxy of the stellar accretion rate (e.g. Garcia Lopez et al. 2006). Several studies have attempted to calibrate various emission line diagnostics to the accretion luminosity (e.g. Donehew & Brittain 2011; Mendigutía et al. 2011, 2012, 2013; Oudmaijer et al. 2011; Pogodin et al. 2012; see also Salyk et al. 2013). Typically, these studies convert the veiling of the Balmer discontinuity to an accretion luminosity using a magnetospheric accretion model (e.g. Muzerolle et al. 2004) and compare this to the luminosity of various emission lines. For example, Donehew & Brittain (2011) apply this method and find that the relationship between the luminosity of Br and the accretion luminosity determined for Herbig Ae stars is consistent with the relationship found for classical T Tauri stars (Muzerolle et al. 1998) and intermediate mass T Tauri stars (Calvet et al. 2004); however, the Herbig Be stars do not follow the same trend.
Whether the correlation between the luminosity of the H I emission lines and the inferred accretion luminosity is physical or fortuitous remains to be seen. One way to investigate this issue is to measure the variability of the veiling of the Balmer discontinuity and emission line luminosities simultaneously (Mendigutía et al. 2013). With the advent of broad coverage spectrographs such as X-Shooter on the VLT (covering ), it is now possible to simultaneously observe the veiling of the Balmer discontinuity and the emission line diagnostics that fall within this range (Oudmaijer et al. 2011; Mendigutia et al. 2014). Ongoing studies along these lines will be able to determine whether or not the veiling and line emission are connected. However, they will not be able to establish that Herbig Ae/Be stars accrete magnetospherically - as assumed in the calculation of the accretion luminosity - or identify where the H I emission lines originate.
At first blush the assumption that Herbig Ae stars accrete magnetospherically would seem unjustified. Herbig Ae/Be stars are not fully convective thus one would not expect that they would generate the strong kilogauss magnetic fields characteristic of their lower mass analogs (Johns-Krull 2007). Indeed, studies of the magnetic properties of Herbig Ae stars indicate that they do not possess strong well ordered surface fields (Alecian et al. 2014). On the other hand red shifted hydrogen lines are observed in Herbig Ae stars with velocities of several hundred km s-1 indicative of material in free fall onto the star (the tell tale signature of magnetospheric accretion; Guimarães et al. 2006). Thus the assumption that at least some Herbig Ae/Be stars accrete magnetospherically is not without warrant.
Before the recombination H I lines can be used reliably as a proxy for the stellar accretion rate, it is crucial that we understand the physical origin of these lines. One promising development is the use of spectro-astrometric measurements of H I emission using integral field spectrographs. This method has recently been applied to massive YSOs. Davies et al. (2010) measured Br emission from the massive YSO W33A with NIFS on Gemini North. They were able to measure the centroid of the PSF with an accuracy of 0.1 arcseconds and show that the line originates in an outflow.
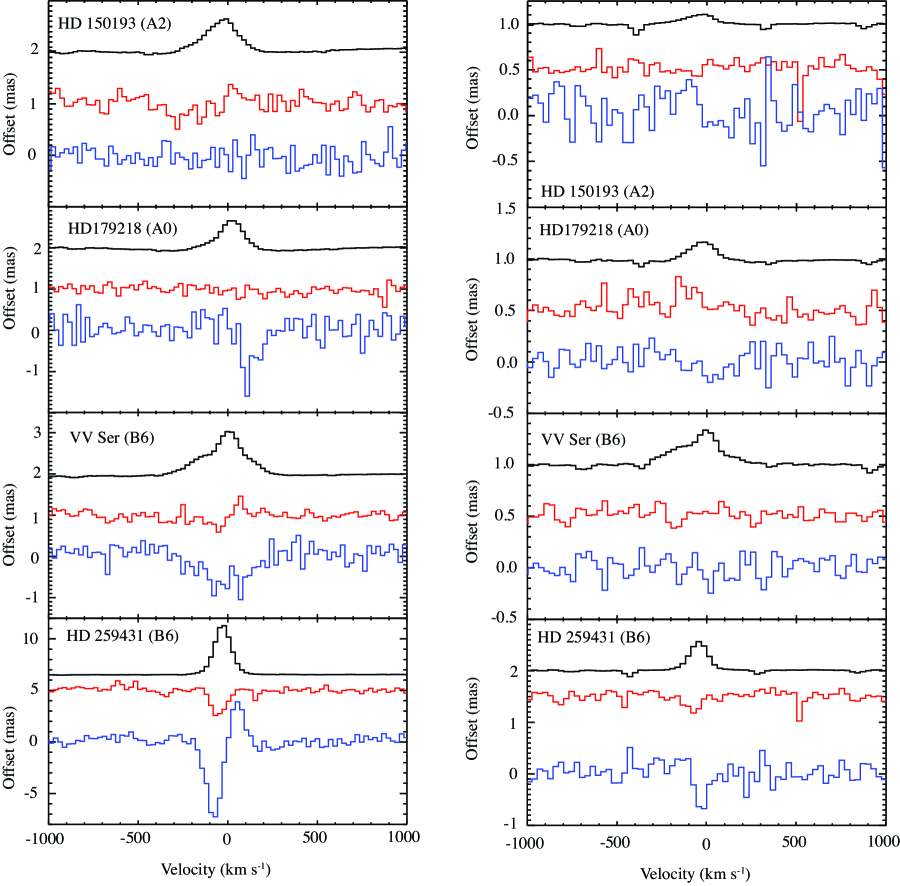
Application of the same method to Herbig Ae/Be stars is beginning to show promising results. For example (Adams et al. 2015), show they can achieve a root mean square fidelity of 100arcseconds with their observation of Herbig Ae/Be stars. This is within a factor of a few of being able to distinguish emission from a magnetosphere, outflow, and gas in a Keplerian orbit in the inner 0.1AU. A study of four Herbig Ae/Be stars finds SA signatures from H I from the HBe stars but not the HAe stars in the sample (Figure 4). By combining these data we are also able to show that our fidelity is limited by photon noise. Increased integration time should provide a means to improve the sensitivity of these measurements by a factor of a few and thus discriminate between a wind, disk, or funnel flow origin for the nearest Herbig Ae/Be stars. Making such high precision measurements requires attention to potential artifacts in the data.
4 Pitfalls
Several authors have summarized best practices for using SA to study phenomena such as binaries and outflows (Bailey et al. 1998; Baines et al. 2004; Porter et al. 2004; Brannigan et al. 2006; Whelan & Garcia 2008). Because SA involves making high precision measurements of the center of the PSF, even small artifacts can lead to spurious signals. We summarize the principal best practices extracted from the work of these authors:
-
1.
Observe the source twice at each desired PA - once at the original position and then with the slit rotated 180. Instrumental artifacts should rotate with the instrument. If they are reproducible, then they should cancel when the signals are combined.
-
2.
Observe a standard star as a secondary check for instrumental artifacts
-
3.
Acquire very high signal to noise ratio flats every time the grating is moved. If the grating in the spectrograph moves when the telescope slews, it may be necessary to retake flats with each observation. Small errors in the flat-fielding can shift the center of the PSF and result in spurious signals.
-
4.
The slit width should be narrow compared to the PSF. If the PSF does not fill the slit and the PSF is not perfectly symmetric, it can result in a spurious signal that will not be removed by combining with the SA signal acquired with the instrument rotated 180.
-
5.
Acquire spectra over a wide spectral range. It is crucial that the continuum be well sampled to ensure a baseline measurement is available for comparison to the region covered by the spectral line. This can prove to be challenging when observing strong H I lines from Herbig Ae/Be stars with high resolution spectrographs as the the full width at zero intensity of the line can be comparable to the spectral grasp of the order.
In what follows, we highlight two additional issues that may complicate the interpretation of spectro-astrometric measurements. First we discuss the challenges of analyzing spectro-astrometric signals from resolved sources and second we explore the challenges of making SA measurements from spectra acquired with an IFS.
When observing molecular emission from nearby disks, it is possible that the emission will be spatially resolved. For example, the molecular NIR emission observed from HD 100546 extends from 10 AU to beyond 50 AU (van der Plas et al. 2009; Brittain et al. 2009; Carmona et al. 2011; Liskowsky et al. 2012). In addition there is a compact ring of solids that extends from 0.25 AU to less than 0.7 AU that dominates the continuum in the NIR (Benisty et al. 2010; Mulders et al. 2011, 2013; Panić et al. 2014). At the distance to HD 100546 (974 AU; van Leeuwan 2007), the inner hole of the disk subtends 0 along the semimajor axis. Adopting an inclination of 42 (Ardila et al. 2007; Pineda et al. 2014) indicates that the inner hole subtends 0 along the minor axis of the disk.
Spectroscopic observations of molecular lines from the disk using adaptive optics and slit will result in the occultation of a significant fraction of the disk. Small changes in the positioning of the slit can give rise to varying line shapes (Hein Bertelsen et al. 2014). Reconstruction of the line profile representing the underlying structure of the disk thus requires precise knowledge of the slit position. Even pointing uncertainties of order .05 can undermine the interpretation of the spectrum. In addition, since the continuum is unresolved, the PSF of the continuum and the PSF of the emission lines is not identical. This can give rise to artifacts as well since the PSF does not fill the slit.
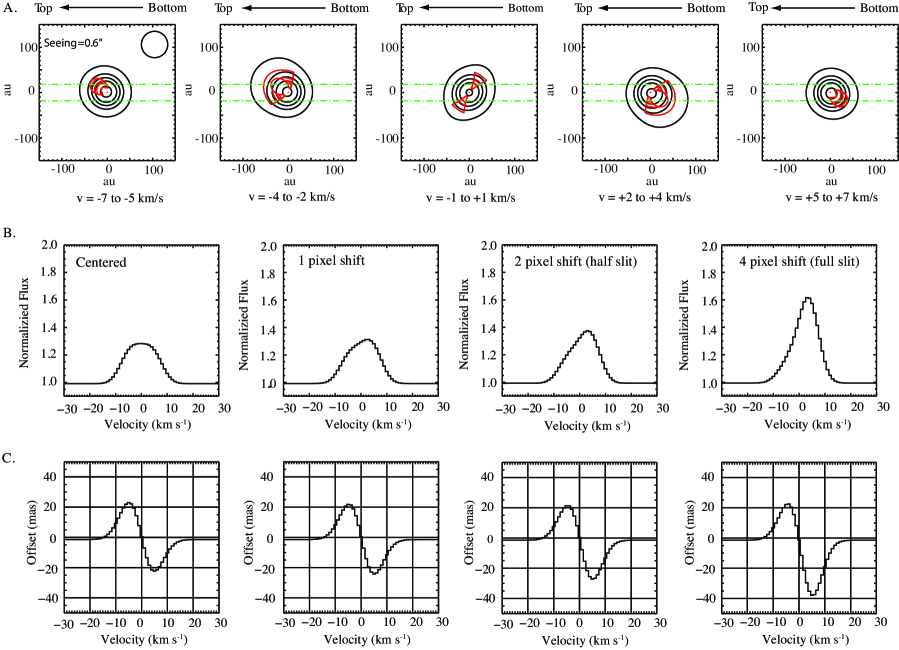
In such cases it can be advantageous to work at lower spatial resolution and wider slit widths. Here we compare the effect of slight pointing offsets on the shape of the spectral lines to the effects described by Hein Bertelsen et al. (2014). We consider conditions with seeing of 0.6 and a four pixel slit with a width of 0.34 (the slit width of Phoenix on Gemini South; Hinkle et al. 2003, 2000, 1998). If the slit is offset from the center of the PSF, an asymmetric PSF and spectro-astrometric signal does result (figure 5); however, to achieve a deviation of 20% from the original measurement, the PSF of the continuum must be shifted as much as 2 pixels from the center of the slit. With care the star can be centered on the slit to within 0.5pixels (about 0.05 for Phoenix on Gemini South and CRIRES on the VLT). While such an offset can be significant when using adaptive optics (a PSF FWHM) and slit (Hein Bertelsen et al. 2014) it is much less significant when the seeing is .
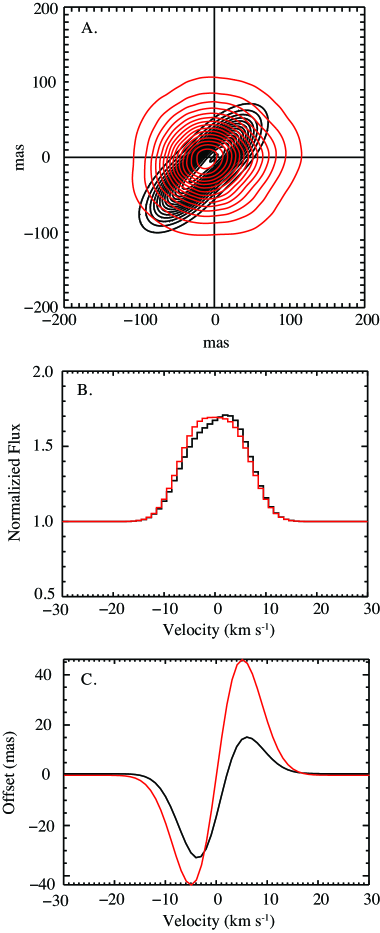
An additional concern arises from making measurements of spectro-astrometric signals from an uncorrected PSF. For example, an asymmetric PSF can give rise to a spurious spectro-astrometric signal. We modeled the effect of a poorly focused beam convolving our disk model with an observed PSF and an asymmetric PSF (figure 6a). The line profile shows only a modest effect due to the occultation of part of the disk (figure 6b). The spectro-astrometric signal, however, shows a significant asymmetry (figure 6c). Perhaps of greater concern is that rotating the instrument will not remove artifacts arising from this effect if it is not steady (say due to variable seeing). Imaging the PSF throughout the observations is a helpful way to identify problems with a variable PSF.
5 Conclusions
Spectroscopy has been used to elucidate many aspects of Herbig Ae/Be stars since the previous conference on Herbig Ae/Be stars held in 1994; however, there is much exciting work left to be done. Over the past two decades, we have moved from detecting and characterizing line emission arising from circumstellar material to using these features to elucidate the star-disk connection and identify signposts of forming gas giant planets. The application of spectro-astrometric measurement to the study of disks is still in its infancy. While this technique shows remarkable promise for revealing sub-arcsecond spatial information from spectra, attention is needed to avoid several pitfalls that can complicate the interpretation of such data. The detection of companions with orbits of order 10 AU by measuring the Doppler shift of emission arising from the circumplanetary disk requires observations on decadal timescales. Archival data is thus a crucial resource facilitating the long term monitoring of these systems.
Acknowledgements S.D.B. acknowledges support for this work from the National Science Foundation under grant number AST-0954811. Basic research in infrared astronomy at the Naval Research Laboratory is supported by 6.1 base funding.
References
- Acke & van den Ancker (2006) Acke, B., & van den Ancker, M. E. 2006, Astron. Astrophys., 449, 267
- Alecian (2014) Alecian, E. 2014, Herbig Ae/Be Stars: The Missing Link in Star Formation (this proceedings)
- Ardila et al. (2007) Ardila, D. R., Golimowski, D. A., Krist, J. E., et al. 2007, Astrophys. J., 665, 512
- Avenhaus et al. (2014) Avenhaus, H., Quanz, S. P., Meyer, M. R., et al. 2014, Astrophys. J., 790, 56
- Ayliffe & Bate (2012) Ayliffe, B. A., & Bate, M. R. 2012, Mon. Not. R. Astron. Soc., 427, 2597
- Ayliffe & Bate (2009) Ayliffe, B. A., & Bate, M. R. 2009a, Mon. Not. R. Astron. Soc., 393, 49
- Ayliffe & Bate (2009) Ayliffe, B. A., & Bate, M. R. 2009b, Mon. Not. R. Astron. Soc., 397, 657
- Bailey (1998) Bailey, J. 1998b, Mon. Not. R. Astron. Soc., 301, 161
- Bailey (1998) Bailey, J. A. 1998a, Proc. SPIE, 3355, 932
- Baines et al. (2004) Baines, D., Oudmaijer, R. D., Mora, A., et al. 2004, Mon. Not. R. Astron. Soc., 353, 697
- Bast et al. (2011) Bast, J. E., Brown, J. M., Herczeg, G. J., van Dishoeck, E. F., & Pontoppidan, K. M. 2011, Astron. Astrophys., 527, A119
- Benisty et al. (2010) Benisty, M., Tatulli, E., Ménard, F., & Swain, M. R. 2010, Astron. Astrophys., 511, A75
- Bitner et al. (2008) Bitner, M. A., Richter, M. J., Lacy, J. H., et al. 2008, Astrophys. J., 688, 1326
- Blake & Boogert (2004) Blake, G. A., & Boogert, A. C. A. 2004, Astrophys. J. Lett., 606, L73
- Brannigan et al. (2006) Brannigan, E., Takami, M., Chrysostomou, A., & Bailey, J. 2006, Mon. Not. R. Astron. Soc., 367, 315
- Brittain & Rettig (2002) Brittain, S. D., & Rettig, T. W. 2002, Nature, 418, 57
- Brittain et al. (2003) Brittain, S. D., Rettig, T. W., Simon, T., et al. 2003, Astrophys. J., 588, 535
- Brittain et al. (2007) Brittain, S. D., Simon, T., Najita, J. R., & Rettig, T. W. 2007, Astrophys. J., 659, 685
- Brittain et al. (2009) Brittain, S. D., Najita, J. R., & Carr, J. S. 2009, Astrophys. J., 702, 85
- Brittain et al. (2013) Brittain, S. D., Najita, J. R., Carr, J. S., et al. 2013, Astrophys. J., 767, 159
- Brittain et al. (2014) Brittain, S. D., Carr, J. S., Najita, J. R., Quanz, S. P., & Meyer, M. R. 2014, Astrophys. J., 791, 136
- Brown et al. (2012) Brown, J. M., Herczeg, G. J., Pontoppidan, K. M., & van Dishoeck, E. F. 2012, Astrophys. J., 744, 116
- Brown et al. (2013) Brown, J. M., Pontoppidan, K. M., van Dishoeck, E. F., et al. 2013, Astrophys. J., 770, 94
- Brown et al. (2013) Brown, L. R., Troutman, M. R., & Gibb, E. L. 2013, Astrophys. J. Lett., 770, L14
- Calvet et al. (2004) Calvet, N., Muzerolle, J., Briceño, C., et al. 2004, Astron. J., 128, 1294
- Carmona et al. (2011) Carmona, A., van der Plas, G., van den Ancker, M. E., et al. 2011, Astron. Astrophys., 533, A39
- Carmona et al. (2014) Carmona, A., Pinte, C., Thi, W. F., et al. 2014, Astron. Astrophys., 567, A51
- Carr (2007) Carr, J. S. 2007, IAU Symposium, 243, 135
- Davies et al. (2010) Davies, B., Lumsden, S. L., Hoare, M. G., Oudmaijer, R. D., & de Wit, W.-J. 2010, Mon. Not. R. Astron. Soc., 402, 1504
- Dent et al. (2005) Dent, W. R. F., Greaves, J. S., & Coulson, I. M. 2005, Mon. Not. R. Astron. Soc., 359, 663
- Donehew & Brittain (2011) Donehew, B., & Brittain, S. 2011, Astron. J., 141, 46
- Dullemond et al. (2007) Dullemond, C. P., Hollenbach, D., Kamp, I., & D’Alessio, P. 2007, Protostars and Planets V, 555
- Eisner et al. (2009) Eisner, J. A., Graham, J. R., Akeson, R. L., & Najita, J. 2009, Astrophys. J., 692, 309
- Fedele et al. (2011) Fedele, D., Pascucci, I., Brittain, S., et al. 2011, Astrophys. J., 732, 106
- Garcia Lopez et al. (2006) Garcia Lopez, R., Natta, A., Testi, L., & Habart, E. 2006, Astron. Astrophys., 459, 837
- Goto et al. (2006) Goto, M., Usuda, T., Dullemond, C. P., et al. 2006, Astrophys. J., 652, 758
- Goto et al. (2012) Goto, M., van der Plas, G., van den Ancker, M., et al. 2012, Astron. Astrophys., 539, A81
- Grady et al. (1999) Grady, C. A., Woodgate, B., Bruhweiler, F. C., et al. 1999, Astrophys. J. Lett., 523, L151
- Grady et al. (2005) Grady, C. A., Woodgate, B. E., Bowers, C. W., et al. 2005, Astrophys. J., 630, 958
- Grady (2014) Grady, C. A. 2014, Herbig Ae/Be Stars: The Missing Link in Star Formation
- Gressel et al. (2013) Gressel, O., Nelson, R. P., Turner, N. J., & Ziegler, U. 2013, Astrophys. J., 779, 59
- Guimarães et al. (2006) Guimarães, M. M., Alencar, S. H. P., Corradi, W. J. B., & Vieira, S. L. A. 2006, Astron. Astrophys., 457,581
- Hein Bertelsen et al. (2014) Hein Bertelsen, R. P., Kamp, I., Goto, M., et al. 2014, Astron. Astrophys., 561, A102
- Herbig (1960) Herbig, G. H. 1960, Astrophys. J. Suppl. Ser., 4, 337
- Hinkle et al. (2003) Hinkle, K. H., et al. 2003, Proc. SPIE, 4834, 353
- Hinkle et al. (2000) Hinkle, K. H., Joyce, R. R., Sharp, N., & Valenti, J. A. 2000, Proc. SPIE, 4008, 720
- Hinkle et al. (1998) Hinkle, K. H., Cuberly, R. W., Gaughan, N. A., Heynssens, J. B., Joyce, R. R., Ridgway,S. T., Schmitt, P., & Simmons, J. E. 1998, Proc. SPIE, 3354, 810
- Huélamo et al. (2011) Huélamo, N., Lacour, S., Tuthill, P., et al. 2011, Astron. Astrophys., 528, L7
- Isella et al. (2014) Isella, A., Chandler, C. J., Carpenter, J. M., Pérez, L. M., & Ricci, L. 2014, Astrophys. J., 788, 129
- Johns-Krull (2007) Johns-Krull, C. M. 2007, Astrophys. J., 664, 975
- Johnson et al. (2010) Johnson, J. A., Howard, A. W., Bowler, B. P., et al. 2010, Publ. Astron. Soc. Pac., 122, 701
- Klahr & Kley (2006) Klahr, H., & Kley, W. 2006, Astron. Astrophys., 445, 747
- Kley & Dirksen (2006) Kley, W., & Dirksen, G. 2006, Astron. Astrophys., 447, 369
- Kraus et al. (2008) Kraus, S., Hofmann, K.-H., Benisty, M., et al. 2008, Astron. Astrophys., 489, 1157
- Kraus & Ireland (2012) Kraus, A. L., & Ireland, M. J. 2012, Astrophys. J., 745, 5
- Liskowsky et al. (2012) Liskowsky, J. P., Brittain, S. D., Najita, J. R., et al. 2012, Astrophys. J., 760, 153
- Mannings & Sargent (1997) Mannings, V., & Sargent, A. I. 1997, Astrophys. J., 490, 792
- Martin & Lubow (2011) Martin, R. G., & Lubow, S. H. 2011, Astrophys. J. Lett., 740, L6
- Meeus et al. (2001) Meeus, G., Waters, L. B. F. M., Bouwman, J., et al. 2001, Astron. Astrophys., 365, 476
- Meeus et al. (2012) Meeus, G., Montesinos, B., Mendigutía, I., et al. 2012, Astron. Astrophys., 544, A78
- Mendigutía et al. (2014) Mendigutía, I., Fairlamb, J., Montesinos, B., et al. 2014, Astrophys. J., 790, 21
- Mendigutía et al. (2013) Mendigutía, I., Brittain, S., Eiroa, C., et al. 2013, Astrophys. J., 776, 44
- Mendigutía et al. (2012) Mendigutía, I., Mora, A., Montesinos, B., et al. 2012, Astron. Astrophys., 543, A59
- Mendigutía et al. (2011) Mendigutía, I., Calvet, N., Montesinos, B., et al. 2011, Astron. Astrophys., 535, A99
- Mulders et al. (2011) Mulders, G. D., Waters, L. B. F. M., Dominik, C., et al. 2011, Astron. Astrophys., 531, A93
- Mulders et al. (2013) Mulders, G. D., Paardekooper, S.-J., Panić, O., et al. 2013, Astron. Astrophys., 557, A68
- Muzerolle et al. (2004) Muzerolle, J., D’Alessio, P., Calvet, N., & Hartmann, L. 2004, Astrophys. J., 617, 406
- Muzerolle et al. (1998) Muzerolle, J., Hartmann, L., & Calvet, N. 1998, Astron. J., 116, 2965
- Najita et al. (2000) Najita, J. R., Edwards, S., Basri, G., & Carr, J. 2000, Protostars and Planets IV, 457
- Najita et al. (2003) Najita, J., Carr, J. S., & Mathieu, R. D. 2003, Astrophys. J., 589, 931
- Najita et al. (2007) Najita, J. R., Carr, J. S., Glassgold, A. E., & Valenti, J. A. 2007, Protostars and Planets V, 507
- Oudmaijer et al. (2011) Oudmaijer, R. D., van den Ancker, M. E., Baines, D., et al. 2011, Astronomische Nachrichten, 332, 238
- Panić et al. (2014) Panić, O., Ratzka, T., Mulders, G. D., et al. 2014, Astron. Astrophys., 562, A101
- Pineda et al. (2014) Pineda, J. E., Quanz, S. P., Meru, F., et al. 2014, Astrophys. J. Lett., 788, L34
- Pogodin et al. (2012) Pogodin, M. A., Hubrig, S., Yudin, R. V., et al. 2012, Astronomische Nachrichten, 333, 594
- Pontoppidan et al. (2011) Pontoppidan, K. M., Blake, G. A., & Smette, A. 2011, Astrophys. J., 733, 84
- Pontoppidan et al. (2008) Pontoppidan, K. M., Blake, G. A., van Dishoeck, E. F., et al. 2008, Astrophys. J., 684, 1323
- Porter et al. (2004) Porter, J. M., Oudmaijer, R. D., & Baines, D. 2004, Astron. Astrophys., 428, 327
- Quanz et al. (2013) Quanz, S. P., Amara, A., Meyer, M. R., et al. 2013, Astrophys. J. Lett., 766, L1
- Quanz et al. (2011) Quanz, S. P., Schmid, H. M., Geissler, K., et al. 2011, Astrophys. J., 738, 23
- Quillen & Trilling (1998) Quillen, A. C., & Trilling, D. E. 1998, Astrophys. J., 508, 707
- Regály et al. (2010) Regály, Z., Sándor, Z., Dullemond, C. P., & van Boekel, R. 2010, Astron. Astrophys., 523, A69
- Salyk et al. (2013) Salyk, C., Herczeg, G. J., Brown, J. M., et al. 2013, Astrophys. J., 769, 21
- Salyk et al. (2011) Salyk, C., Blake, G. A., Boogert, A. C. A., & Brown, J. M. 2011, Astrophys. J., 743, 112
- Salyk et al. (2009) Salyk, C., Blake, G. A., Boogert, A. C. A., & Brown, J. M. 2009, Astrophys. J., 699, 330
- Smak (1981) Smak, J. 1981, Acta Astron., 31, 395
- Su et al. (2005) Su, K. Y. L., Rieke, G. H., Misselt, K. A., et al. 2005, Astrophys. J., 628, 487
- Su et al. (2006) Su, K. Y. L., Rieke, G. H., Stansberry, J. A., et al. 2006, Astrophys. J., 653, 675
- Takami et al. (2003) Takami, M., Bailey, J., & Chrysostomou, A. 2003, Astron. Astrophys., 397, 675
- Tanigawa et al. (2012) Tanigawa, T., Ohtsuki, K., & Machida, M. N. 2012, Astrophys. J., 747, 47
- The et al. (1994) The, P. S., Perez, M. R., & van den Heuvel, E. P. J. 1994a, The Nature and Evolutionary Status of Herbig Ae/Be Stars, 62, 23
- The (1994) The, P. S. 1994b, The Nature and Evolutionary Status of Herbig Ae/Be Stars, 62, 419
- The et al. (1994) The, P. S., de Winter, D., & Perez, M. R. 1994, Astron. Astrophys. Suppl. Ser., 104, 315
- Thi et al. (2014) Thi, W.-F., Pinte, C., Pantin, E., et al. 2014, Astron. Astrophys., 561, A50
- van den Ancker (2005) van den Ancker, M. 2005, High Resolution Infrared Spectroscopy in Astronomy, 309
- van der Plas et al. (2009) van der Plas, G., van den Ancker, M. E., Acke, B., et al. 2009, Astron. Astrophys., 500, 1137
- van der Plas (2010) van der Plas, G. 2010, Ph.D. Thesis,
- van Leeuwen (2007) van Leeuwen, F. 2007, Astron. Astrophys., 474, 653
- Vieira et al. (2003) Vieira, S. L. A., Corradi, W. J. B., Alencar, S. H. P., et al. 2003, Astron. J., 126, 2971
- Waters & Waelkens (1998) Waters, L. B. F. M., & Waelkens, C. 1998, Annu. Rev. Astron. Astrophys., 36, 233
- Weinberger et al. (1999) Weinberger, A. J., Becklin, E. E., Schneider, G., et al. 1999, Astrophys. J. Lett., 525, L53
- Whelan & Garcia (2008) Whelan, E., & Garcia, P. 2008, Jets from Young Stars II, 742, 123
- Zhu (2014) Zhu, Z. 2014, arXiv:1408.6554