A SEARCH FOR INTERGALACTIC GLOBULAR CLUSTERS IN THE LOCAL GROUP
Abstract
The whole Sloan Digital Sky Survey (SDSS, ) has been searched for intergalactic globular clusters (IGCs) in the Local Group (LG). Using optical, infrared, and ultraviolet photometric selection criteria and photometric redshifts, the of objects in the SDSS Galaxy Catalogue were reduced to only 183,791 brighter than that might be GCs. Visual examination of their SDSS images recovered 84% of the confirmed GCs in M31 and M33 and yielded 17 new GC candidates, 5 of them of high confidence, which we could confirm as GCs in MegaPrime images from the Canada, France, Hawaii Telescope. These 5 GCs are within M31’s halo, but the other 12 candidates are not close to LG galaxies or galaxies within 3 Mpc of the LG. Even though this search covers only one-third of the sky and some GCs could have been missed, it suggests that the LG does not contain a large population of IGCs more luminous than . In the direction of the M81 Group, the search yielded five candidate GCs, probable members of that group.
1 Introduction
This paper reports a search for globular clusters (GCs) over the whole footprint of the Sloan Digital Sky Survey (SDSS), of the sky, out to the edge of the Local Group (LG) and beyond in the direction of the M81 Group of galaxies . It encompasses a large volume of the LG, beyond the virial radii of the Milky Way (MW) and M31 ( kpc, Garrison-Kimmel et al. 2014). There are two reasons to suspect that GCs may be found far from the MW or M31 or any other LG group galaxy. These intergalactic globular clusters (IGCs) may have originated in galaxies, and through galaxy-galaxy interaction have become unbound from their hosts and put on large orbits in the gravitational potential of the LG (Bekki & Yahagi, 2006). IGCs may have also formed independently of galaxies in their own dark matter (DM) halos (Peebles, 1984). While this second hypothesis has no compelling observational support at present, it has not been ruled out as a source of GCs in addition to the better supported hypotheses that GCs formed during the early evolution of galaxies (e.g., Harris & Pudritz 1994; Kravtsov & Gnedin 2005; Elmegreen et al. 2012) or from gas that was compressed when galaxies collided (e.g., Schweizer 1987; Ashman & Zepf 1992; Whitmore & Schweizer 1995).
IGCs have been discovered in several nearby galaxy clusters such as Fornax (Gregg et al., 2009), Virgo (Lee et al., 2010), Abell 1185 (West et al., 2011), Coma (Peng et al., 2011), Abell 1689 (Alamo-Martínez et al., 2013), and in some of them the IGCs number in the thousands. The majority of the IGCs of these clusters have blue colors that are similar to the colors of many of the GCs found in dwarf galaxies and in the blue sequence of the typically bimodal color distribution of the GCs in massive early-type galaxies. The colors of these clusters are consistent with very old ages and low metal abundances. In the Coma cluster, however, a significant fraction () of the IGCs have been found to have red colors, suggesting that they are more metal-rich than the blue clusters (Peng et al., 2011). The common interpretation of the presence of IGCs in galaxy clusters is that they formed in galaxies that were later either tidally disrupted or stripped of their outermost stars and GCs by galaxy-galaxy interaction. The galaxy merger Arp 105 in the cluster Abell 1185, which is liberating both stars and GCs from their galaxy of origin (West & Gregg, 2014), is an interaction that is producing IGCs at the present time. The “hypervelocity cluster ”, which appears to have been ejected from the Virgo Cluster (Caldwell et al., 2014), may be further evidence of IGC producton by galaxy-galaxy interaction (Samsing, 2015). Similar interactions may have also occurred in galaxy groups according to the models of Bekki & Yahagi (2006), and the cluster GC-2 in the M81 group, which lies kpc from M81, may be an example of an IGC in a galaxy group (Jang et al., 2012).
Galaxy interactions have occurred in the LG, because the halos of both the MW and M31 show telltale signs of galaxy accretion. The ongoing disruption of the Sgr dwarf spheroidal (dSph) galaxy by the MW, and the substructures found in the halos of the MW and M31 provide the most direct evidence. Other evidence that the Galactic halo was formed by satellite accretion has accumulated for more than 30 years (see Bland-Hawthorn & Freeman, 2014, for a review). The simulations of the hierarchical picture of galaxy formation (e.g., Abadi et al., 2003; Bullock & Johnston, 2005; Zolotov et al., 2009) show that the accretions of sub-halos of DM onto a large DM halo (i.e., a large galaxy) frequently lead to the capture of the sub-halo into a satellite orbit and eventually its tidal disruption. If the sub-halo is a dwarf galaxy containing stars and star clusters, then they become part of the stellar halo of the large galaxy. A few of the sub-halos that pass through the viral radius of the large halo are not captured but remain on orbits that are several times the viral radius in extent. Some of these so-called “back-splash galaxies” (e.g., Gill et al., 2005) may have had their gas removed by ram-pressure stripping and tidal stirring (e.g., Mayer et al., 2001; Kazantzidis et al., 2013) while passing close to the large halo. This may explain the existence of the Tucana and Cetus dSph galaxies in the LG that are currently far beyond the virial radii of M31 and the MW, and yet appear to have been stripped of their gas (Teyssier et al., 2012). The recent simulations by Garrison-Kimmel et al. (2014) of galaxy groups containing two large halos that are similar to M31 and the MW indicate that more back-splash galaxies on large orbits are produced when two massive halos are present rather than just one. The case of the accretion of a binary pair of sub-halos of unequal masses onto a large halo has been simulated by Sales et al. (2007), who found that often the lower mass sub-halo was ejected at high velocity while the higher mass one merged with the large halo. It seems plausible then that during the accretion of a GC-bearing dwarf galaxy by a large galaxy, one or more of its GCs may become unbound from the dwarf and placed on large orbits, reminiscent of the orbits of the back-splash galaxies. Some dwarf galaxies, for example the LG galaxies Fornax (e.g., Cole et al., 2012) and NGC 6822 (Huxor et al. 2013), contain GCs that are far from their centers and therefore may be easily stripped in a galaxy-galaxy interaction. The large stellar substructures in the halo of M31 (Fardal et al., 2013; Bate et al., 2014, and refs. therein) and its large number of halo GCs, some of which appear associated with the substructures (Veljanoski et al., 2014) suggest that it has accreted GC-bearing galaxies. The same is true of the MW, as indicated by the properties of its halo GC system (e.g., Zinn, 1993; Mackey & Gilmore, 2004; Keller et al., 2012) and rather directly by the accretion of GCs from the Sgr dSph galaxy (e.g., Law & Majewski, 2010). It remains to be seen if the accretion events involving the MW and M31, which theoretical simulations predict were very numerous (e.g., Bullock & Johnston, 2005), placed any GCs on such large orbits that they are now IGCs in the LG.
The hypothesis that some GCs formed in their own DM halos is now three decades old (Peebles, 1984), but it has not been confirmed or ruled out observationally. The discoveries of multiple stellar populations and variations in the abundances of He and other elements in GCs, has renewed the interest in this hypothesis as a way of explaining how some GCs can retain gas and have more than one episode of star formation (see Conroy & Spergel, 2011, and refs. therein). Because the DM halo of a GC may be stripped as it is accreted by a large galaxy (e.g., Mashchenko & Sills, 2005), the most isolated and massive GCs should be the best candidates to prove this hypothesis. The recent investigations by Conroy et al. (2011) and by Ibata et al. (2013) of the structures of the GCs NGC 2419 and MGC1 in the remote outer halos of the MW and M31 respectively, failed to find firm evidence for the presence of DM. The 14 dwarf galaxies that are not members of the MW or the M31 satellite systems (see McConnachie, 2012) suggest the presence of isolated DM halos in the LG. In addition there might be DM haloes in the LG that formed single GCs. This idea and the possibility that some galaxy interactions may have flung GCs into larger orbits have motivated this search for IGCs in the LG, which greatly expands our earlier one of of the sky near M31 (di Tullio Zinn & Zinn, 2014, hereafter Paper II).
To our knowledge, there has not been a previous survey of a large volume of the LG with the specific goal of finding IGCs. Many of the most remote GCs in the MW halo, including Pal 4 (Abell, 1955) and AM-1 (Madore & Arp, 1979), both at distances from the Sun () kpc, were discovered by visual examination of the photographic plates taken with the Schmidt telescopes of the Palomar (POSS-I & -II), the European Southern (ESO), and the Siding Spring (U.K. Science Research Council, SRC) Observatories. It is hard to judge to what distance these large surveys could have detected GCs because this depends on the properties of the clusters, the plate material, and the survey techniques. Our examination of the images of several of the brightest M31 GCs on film copies of the POSS-II plates and on images of the digital sky survey (DSS), suggests that these plates do not have the depth and resolution necessary to identify many GCs at the distance of M31 ( kpc; all distances to LG galaxies in this paper are from McConnachie (2012). A good example is provided by the luminous cluster M31 MGC1 (, Mackey et al. (2010), which was discovered on MegaCam images from the Canada France Hawaii Telescope (CFHT) 3.6m telescope (Martin et al., 2006). On the film copies of the POSS-II, MGC1 appears stellar. On the SDSS images, which are the main source of our survey technique, there is no question that MGC1 is a GC. Our survey can then identify similar clusters within the boundaries of the LG. Our survey is also sensitive to GCs, whose central regions are not resolved in the SDSS images, and are therefore catalogued as galaxies. On the other hand, it excludes GCs that are so resolved into stars that they are not classified as galaxies by the SDSS, and therefore do not enter our initial selection of objects from its Galaxy Catalogue, such as the MW GCs Koposov 1 and 2 (Koposov et al., 2007). Our survey misses also ultra-faint galaxies and dSph galaxies. Below we discuss the survey, its application, limitations, and results.
2 Search Area
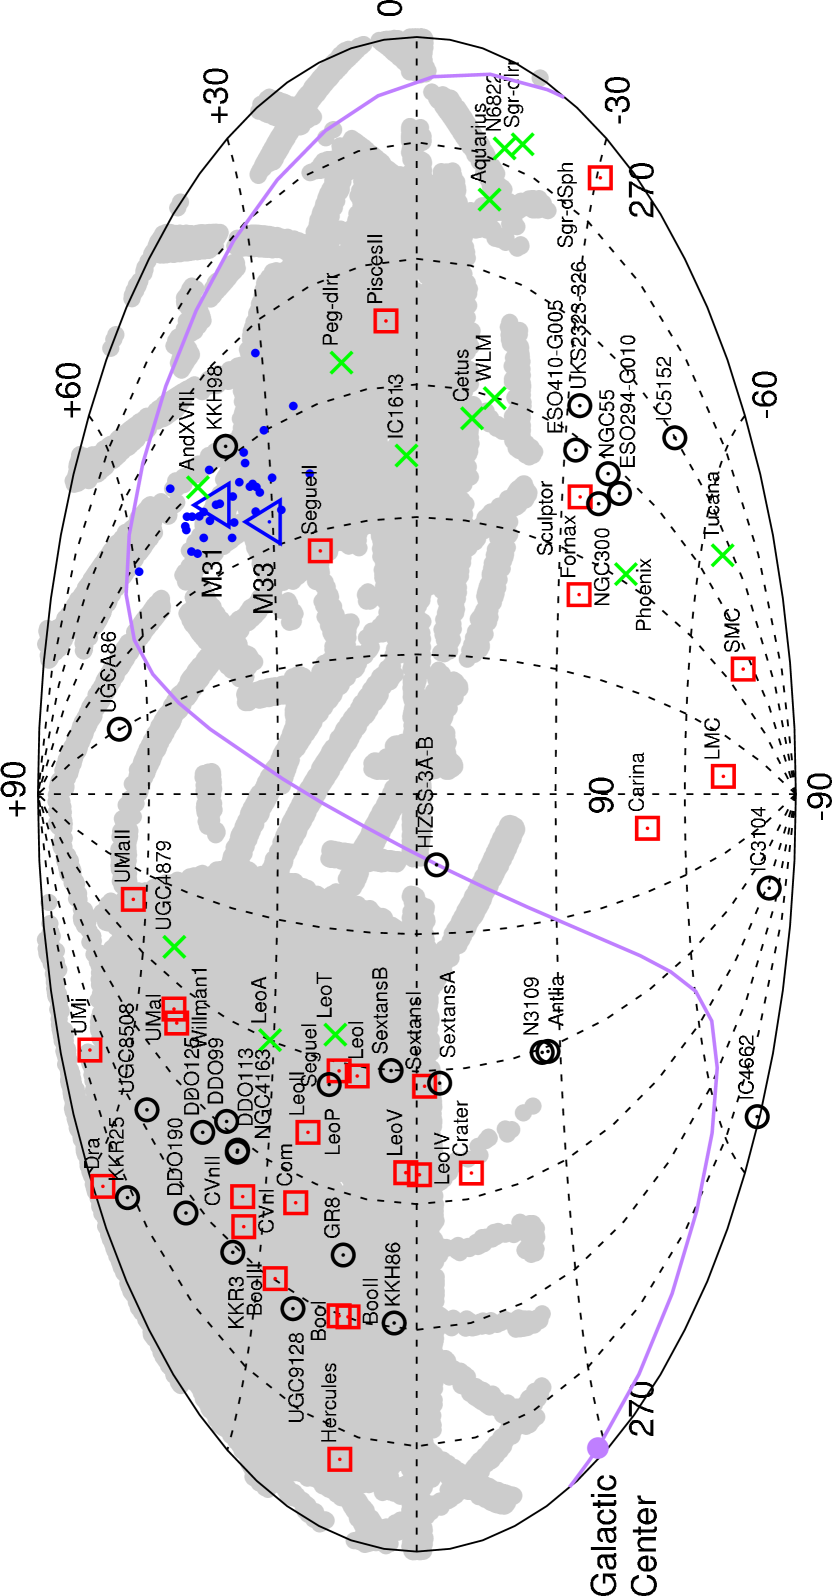
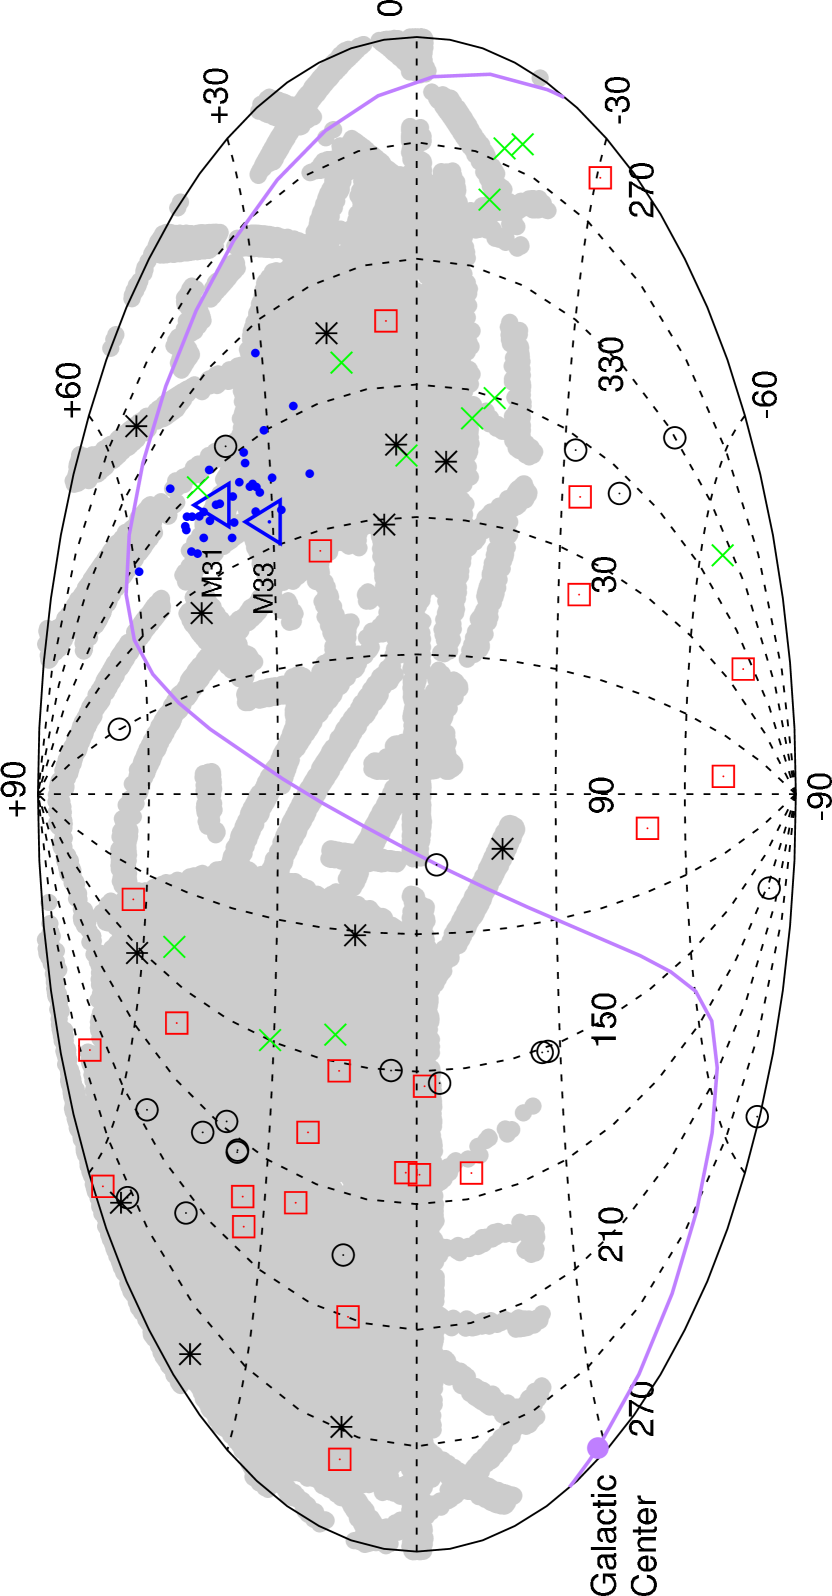
Figure 1, which is a Hammer projection of the sky with equatorial coordinates, shows our search area (gray shading), the positions of the Galactic plane, the Galactic center, M31, M33, the other satellite galaxies of M31, the satellite galaxies of the MW, other LG galaxies, and galaxies within 3 Mpc of the LG. Most of these galaxies were selected from the recent compilation of McConnachie (2012), which we augmented with the more recent discoveries of the probable M31 satellites, Lac I, Cas III, and Per I (Martin et al., 2013b, a) and the MW satellite, Crt I (Belokurov et al., 2014), which might be instead a low-luminosity GC in the outer halo of the MW (Laevens et al., 2014).
In our first survey for IGCs in the LG, we surveyed of the SDSS in an area around M31 up to 500 kpc in projected distance from its center () (see Fig. 1 in Paper II), which included most of its satellite galaxies. This area was selected because of the possibility that some of the accretion events that produced the large substructures and the rich population of GCs in M31’s halo, could have also produced IGCs. Our current survey (see Figure 1) encompasses larger expanses of the sky to the south and southwest of M31, and it also expands in the opposite directions, with a large gap near the galactic plane. Note that the relatively low galactic latitude of M31 () places it almost on the edge of the SDSS. Since the candidate backsplash galaxies Tucana and Cetus dSph galaxies lie far from both M31 and the MW, IGCs may be similarly scattered throughout the LG. A wide distribution is also possible if IGCs formed in their own DM halos. For both reasons it is important to search as much of the LG as possible, and our current search covers about one-third of the sky.
3 Survey Techniques
The steps in this survey were modeled after our previous surveys for GCs in the remote halo of M31 (di Tullio Zinn & Zinn, 2013, Paper I) and for IGCs in the vicinity of M31 (Paper II). The first step in those two surveys was to select objects from the SDSS Galaxy Catalogue, (a catalogue of non-point sources), with colors of old GCs: . The second step was to examine by eye the SDSS cutout images of these selected objects as provided by the SDSS website. The vast majority of the objects that passed the color cut could be immediately rejected as galaxies. Objects that were not easily rejected were then examined more closely in the r pass-band images, which we downloaded from the SDSS website in fits file format. In the case of the IGC survey of Paper II, which covered a larger area than the survey in Paper I (), too many ambiguous objects still remained after this closer visual scrutiny. Consequently, additional steps were added in Paper II, which used combinations of optical, ultraviolet, and infrared colors to distinguish GCs from most galaxies on the basis of the shapes of their spectral energy distributions (SEDs). Although the survey in Paper II found several GCs, they are, however, more likely to be additional members of M31’s halo than IGCs because their values are kpc. The most time consuming part of these earlier searches was the part that involved the initial visual inspection of the images (283,871 images in the case of Paper II). Because the present search area is more than 15 times larger than the one in Paper II, it was impractical to employ the same initial technique of visual inspection. Instead, we were able to reject beforehand from the SDSS Galaxy Catalogue many thousands of galaxies by using some of the photometric selection techniques already experimented with in Paper II, based on their SED differences with GCs. The final step in the present survey was still a visual inspection of the SDSS cutout images, but of a greatly reduced number of objects.
Since the halos of the MW and M31 are probably in part the debris from galaxy-galaxy interactions, the GCs in their halos may be representative of IGCs. The MW and M31 GCs have similar colors and spectra (Schiavon et al., 2012), and the halo GCs in both M31 and the MW appear to be older than 1 Gyr and metal-poor ([Fe/H]). Consequently, for our search we chose color ranges that isolated similar objects. It is not clear that these broad ranges will necessarily include all IGCs that formed in their own DM halos because Peebles’ (1984) theory does not make specific age and metallicity predictions beyond estimating that the formation process begins at a redshift . We use the M31 GCs to serve as prototypes of IGCs, because their optical, infrared, and ultra violet colors can be measured with the same techniques that we will adopt for our survey. We will also examine how well our methodology identifies the confirmed GCs in the other LG galaxies with GC systems.
As we did in our two previous searches for GCs, the candidates were drawn from the SDSS Galaxy catalogue, which contains non-stellar objects according to the following criterion. The SDSS frames pipeline (see Stoughton et al., 2002) measures the point-spread-function (psf) of each CCD frame and uses it to compute a “psf magnitude” for each photometric band, to which is applied an aperture correction to remove the effects of variable seeing. The pipeline also measures the light-profile of each object, which it fits with both exponential and de Vaucouleur profiles after they are convolved with the psf. The total magnitude of an object in each band is measured by the “composite model magnitude” (e.g., cmodelMag_r), which is based on a linear combination of the best fitting exponential and de Vaucouleur profiles. The test for an extended source is made by summing over all bands the fluxes captured by the psf magnitudes and separately the cmodel magnitudes, which are converted back to magnitudes. If the difference between these flux-summed magnitudes, psfMagcmodelMag, is , then the object is classified as a star111http://www.sdss.org/dr12/algorithms/classify/#photo_class.
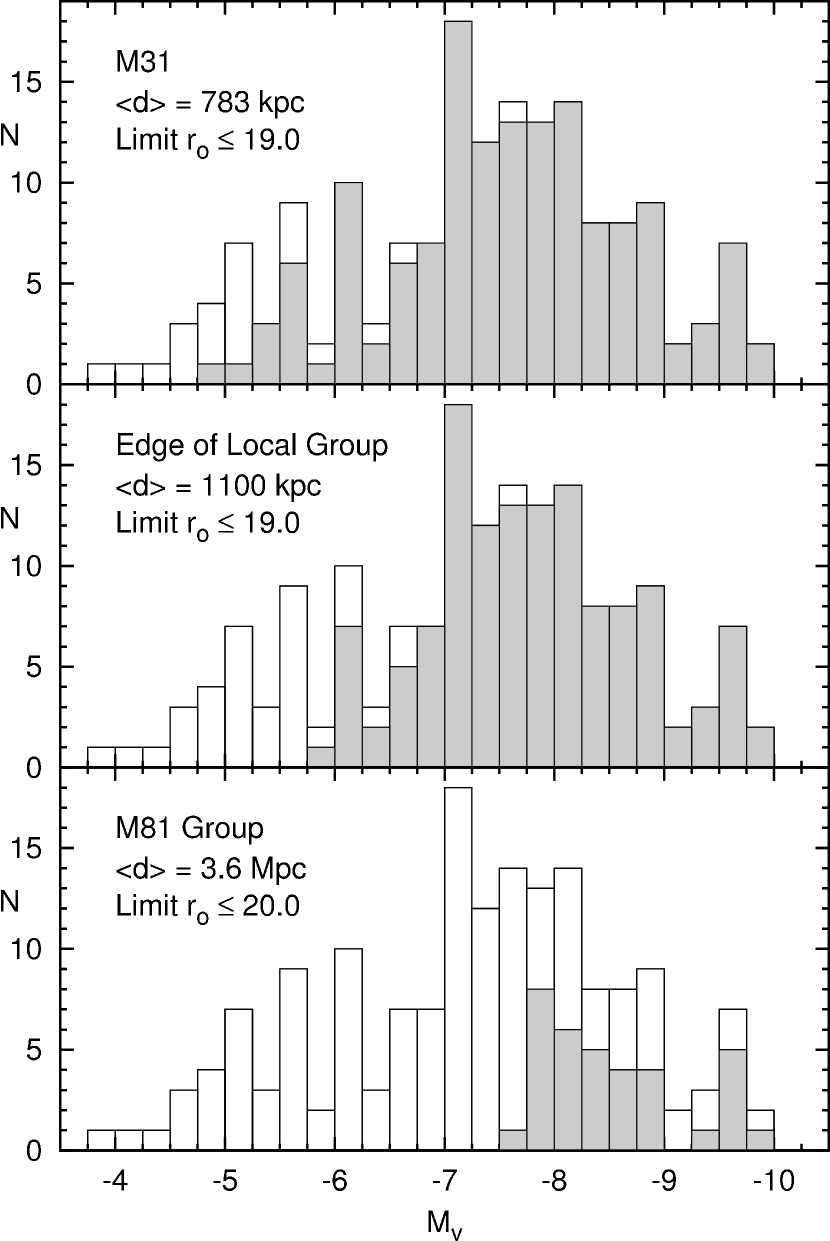
Since all GCs will become indistinguishable from stars at some distance, it is important to investigate how the SDSS star-galaxy separation affects the completeness of our surveys. Figure 2 illustrates the effects of the star-galaxy separation and our magnitude limits on our surveys for IGCs in the LG and in the M81 group (see section 6). In each diagram, the open histogram is the luminosity distribution of the 168 GCs in M31, older than 1 Gyr, for which we could find data in the “PhotoObjAll” catalog of the SDSS. These objects are confirmed GCs according to version 5 of the Revised Bologna Catalog of M31 globular clusters (RBCv5, Galleti et al. (2004), 2012 edition) and/or Huxor et al. (2014), and we have used the data from these sources and, for a few objects, from the SDSS to construct the histogram. In projected distance from M31 (), this sample spans 3.5 to 140 kpc, with 80% at kpc. The solid histogram in the top diagram, which includes 146 GCs, 87% of the total, are the ones that are classified as galaxies by the SDSS and are brighter than our survey limit (, see below). A sharp cutoff in is not produced by this limit because some clusters of large radius and low central surface brightness (e.g, HEC8 and HEC11) are measured systematically too faint by the SDSS. Because of this effect, there is a bias in our surveys against finding similar ”extended” clusters (see Huxor et al., 2008), which however appear to be rare objects (only 4% of the sample of 168 and 2% of the confirmed GCs in the RBCv5 are classified as extended). The ragged cutoff of the solid histogram is also caused by our limit depending only on the foreground MW extinctions of the objects, while the extinctions used to compute include contributions from M31. In addition, 3 of the 168 clusters in the sample fail the star-galaxy separation and were listed as stars in the PhotoObjAll catalog.
The solid histogram in the middle diagram, which contains 131 clusters or 78% of the total number, includes the effects of the limit and star-galaxy separation at 1100 kpc from the Sun. This may be approximately the limit of the LG in most directions of our survey because McConnachie (2012) estimated that the zero velocity surface of the LG lies kpc from the mid point between the MW and M31. To model the SDSS star-galaxy separation, we used the composite profile fit in each band to find the radius of the aperture that enclosed the same flux as the psfMag. This radius was typically 80% of the full-width-half-maximum (FWHM) of the psf as listed in PhotoObjAll. We then scaled the effective radii of the exponential and de Vaucouleurs profiles that are listed in the PhotoObjAll catalog from the M31 distance to 1100 kpc and computed new composite profiles for each band. Using these profiles and the effective apertures of the psfs, we computed the difference psfMagcmodelMag, which, if , indicated a stellar source. According to this procedure, 10 of the 168 clusters would be considered as stars at a distance of 1100 kpc, but only 2 of them are brighter than the cutoff.
The solid histogram in the bottom diagram of Figure 2 shows the effects of the cutoff, now increased to 20.0 (see section 6), and the star-galaxy separation at the distance of the M81 Group, 3.6 Mpc (Karachentsev et al. 2013). Only 35 clusters or 21% of the original 168 are included in this histogram. Nonetheless, it suggests that of the most luminous GCs () are non-stellar at M81’s distance. This result is in qualitative agreement with the presence of some M81 GCs in the SDSS galaxy catalogue (e.g., the two studied by Jang et al. (2012)).
For the optical data, we downloaded from the Galaxy catalog the SDSS ”model magnitudes”, which are based on the better one of the exponential or the de Vaucouleur fits to the r-band light profile. While the model magnitudes provide the best measurements of the colors of galaxies, they are less good than the cmodel magnitudes for measuring the total light222www.sdss.org/dr12/algorithms/magnitudes/. Over the magnitude ranges of interest here the differences between these magnitudes are so small that they can be safely ignored (e.g., for the 147 M31 clusters with in Fig. 2, the difference, modelMagcmodelMag, have means of , , and in the g, r, and i bands). We only selected objects with reddening corrected r magnitudes , because our experience with the M31 GCs suggested that fainter ones might fail our color selection criteria, and with very few exceptions, cannot be confirmed as star clusters by visual inspection of the SDSS images. For an optical color we chose because it is well measured for these relatively bright objects and has a long wavelength baseline. In addition this time we selected for our sample objects with reddening corrected colors in a more restricted range, , which still encompasses the range in color of the outer halo GCs in M31 and most of the GCs belonging to the dwarf galaxies of the LG (see section 4). Because of the age-metallicity degeneracy effect, this range in color encompasses wide enough ranges in both metallicity and age, if age Gyr, according to the models of Maraston (1998, 2005). Moreover the selection criteria for GCs that we developed in Paper II, using color combinations from the SDSS, the Wide-field Infrared Survey Explorer (WISE), and the Galaxy Evolution Explorer (GALEX) satellites, work well within this range of , but not outside it, as shown in Figure 3. These criteria were presented and discussed at greater length in Paper II. Because the recent Data Release 10 (DR10) of the SDSS Galaxy Catalogue is linked to the WISE All-Sky Catalogue, much of our present survey could now be done automatically via Casjob on the SDSS website.
Our previous experience in searching for GCs in the halo of M31 has shown that the largest contamination in our sample comes from galaxies resembling GCs in appearance in the SDSS images because they look compact and nearly round. When the spectroscopically measured redshifts (z) of these galaxies were available, they indicated that the galaxies lie far beyond the LG. In most cases, the SEDs of these galaxies do not closely resemble those of GCs. Unlike GCs, many of them are still forming stars. Ones that have little or no star formation have stellar populations that are more metal-rich, and hence redder than the GCs found in the halos of the MW and M31 or in dwarf galaxies. Therefore these groups of galaxies can be separated from GCs by means of photometric criteria. To illustrate how our selection criteria can distinguish between these galaxies and GCs, we have selected a sample of 122 GCs in M31 with kpc and , that do not lie in close proximity to bright stars or in the very dense star fields of M31. These confirmed clusters were selected from the catalogues of Kang et al. (2012); Huxor et al. (2008, 2014), and Papers I and II. Because we are searching for IGCs, in the construction of the selection criteria we selected a more remote sample ( kpc) than the one used in Paper II ( kpc). The clusters in the inner regions are more likely to have formed within M31 rather than in dwarf galaxies or in their own dark matter halos. In the diagrams of Figures 3 and 4, this sample of GCs is compared to the objects in a small area of our survey covering , and centered at RA, Dec = 161.0, +1.0 (l = +249.1, b = +50.1). This region is representative of all but the lower galactic latitude regions of our survey, where the SDSS Galaxy Catalogue contains fewer galaxies per square degree and many more tight groups of stars. In this comparison region, the SDSS Galaxy Catalogue contains 2146 objects with . The SDSS cutout image of each of these objects was visually examined and none of them was a candidate GC according to the criteria that we discussed in Paper I. We used these objects to illustrate how the majority of similar objects can be separated from GCs without resorting to a preliminary visual inspection, which would have been very time consuming for the area of surveyed in this search.
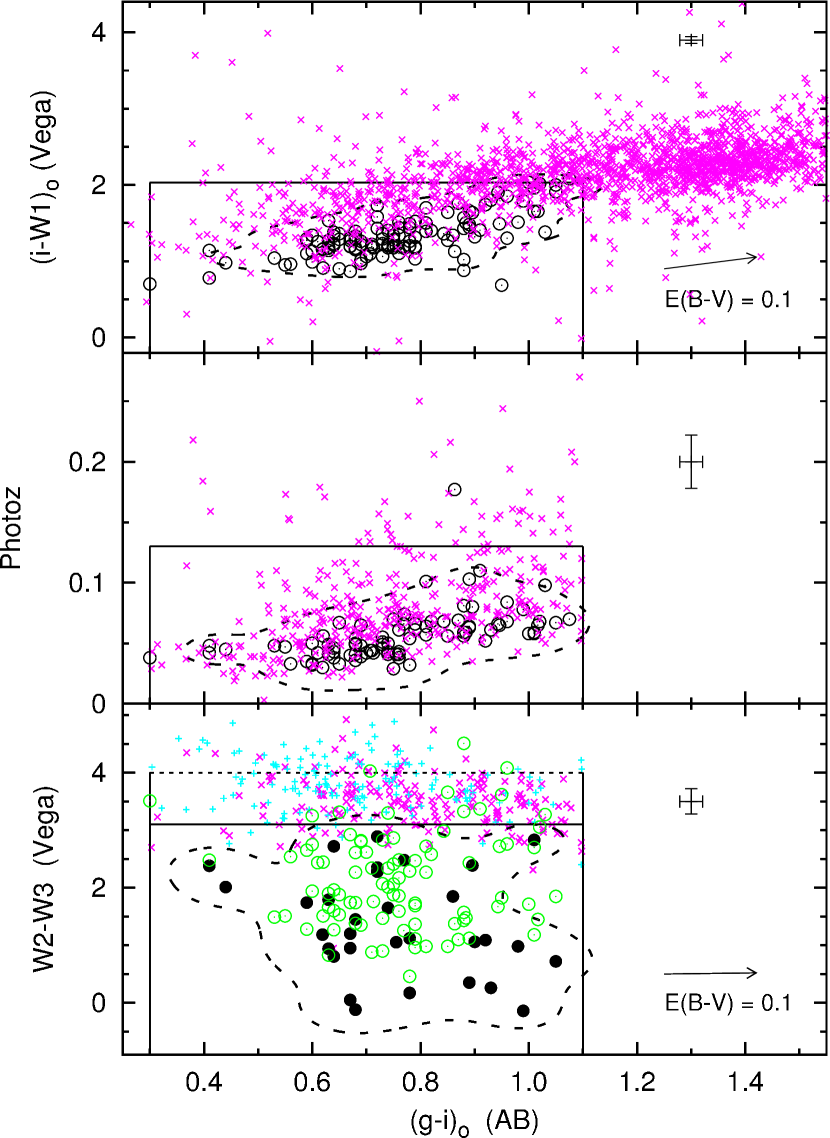
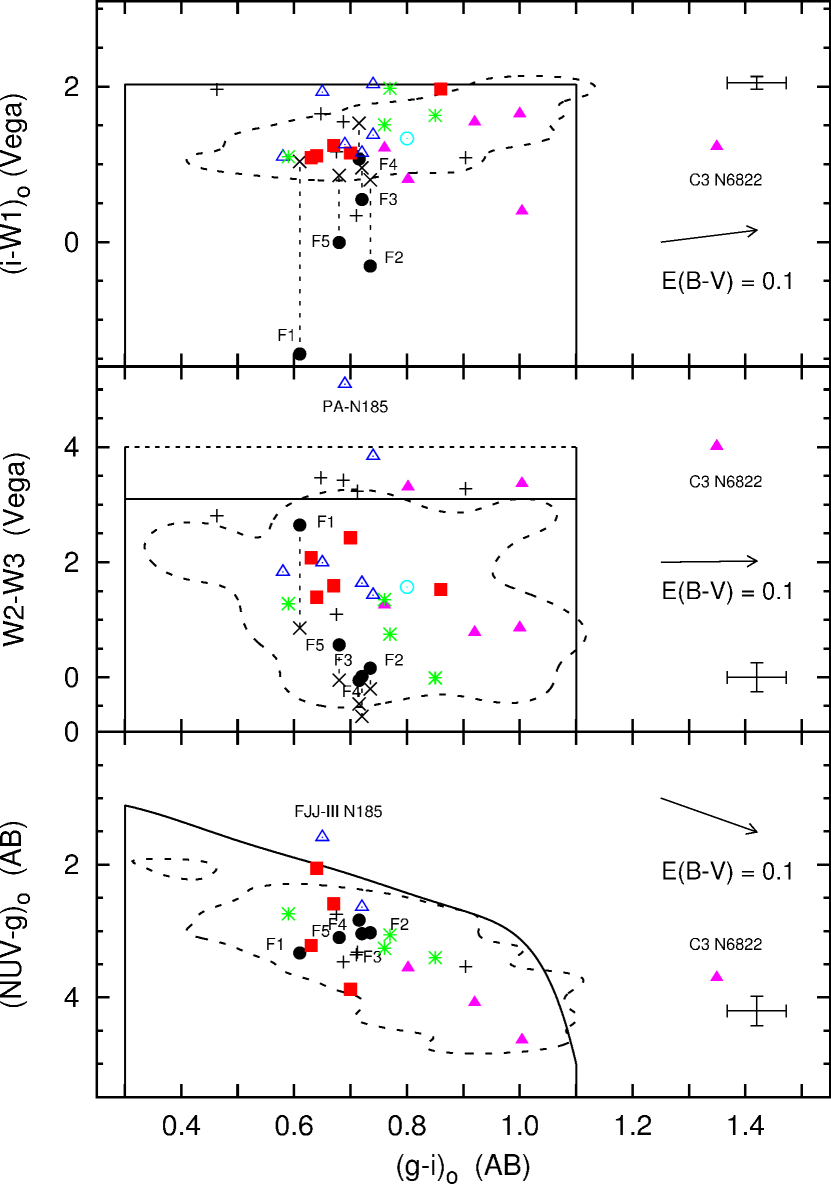
The top diagram of Figure 3 shows that many galaxies (X’s) are redder in the and colors than GCs (circles). The color is formed from the magnitudes in the SDSS i-band, transformed to the Vega system, and the WISE W1 band, which is centered at , while the W2 and W3 bands are centered at and . We used the profile fitted magnitudes for all WISE measurements because they are presented as the most reliable measurement for unresolved sources in the description of the WISE catalogue (Cutri et al., 2011). Nearly all of the M31 GCs are unresolved by WISE in the W1, W2, and W3 wavelength bands, which have psfs with full-width-half-maxima (FWHM) of , and , respectively. Later we will discuss the effects on our survey of forming colors with the SDSS model magnitudes, which include nearly all of the light of the objects, and the WISE and GALEX measurements, which do not. The top diagram in Figure 3 shows, in the plane, the locations of the objects of the comparison region (X’s), which extend beyond the limits of this plot, and of the selected sample of M31 GCs (circles). The dashed contour in this diagram encloses 90% of the density of the 2-D kernel density estimate of the GCs. The rectangular area, which encloses 120 (98%) of the GCs, marks some of the cuts that we will impose to isolate GCs, and . Only 389 (18%) of the objects in the comparison region pass these cuts.
The middle diagram in Figure 3 shows the usefulness of adding a second cut with the photometric redshift, Photoz, which is derived from the 5 SDSS photometric bands by the K-D tree method and listed in DR10. In Paper II, we showed that Photoz is a useful discriminant between M31 GCs and galaxies because it systematically assigns low values of z to the GCs (see Fig. 4 in Paper II). Although these Photoz values are much larger than the real z’s of the GCs, they are smaller than the ones of many galaxies of similar color and magnitude. For this study, we chose for Photoz a wider limit () than in Paper II to reduce a bias against fainter GCs, like B407 which would not pass otherwise our selection. The original sample of 122 M31 GCs had to be reduced to 89 in the middle diagram of Figure 3, because values of Photoz were available for only the ones within the SDSS footprint. One of these clusters, B517, has an exceptionally large value of Photoz, 0.177, and it was excluded when calculating the 2-D kernel density and its 90% contour. The color of B517 is approximately 0.2 mag smaller than the ones of other M31 GCs of similar , which may be responsible for its anomalously large Photoz. The rectangle in this diagram indicates the region delineated by the cuts in Photoz and that we will use to isolate GCs, and it encloses every GC (circles) except B517. The 389 objects in the comparison region that passed the cuts in the upper diagram are the ones plotted in this middle diagram; 338 of them passed the Photoz cut.
The bottom diagram in Figure 3 is a plot of the color W2-W3, versus . W2-W3 is sensitive to the amount of star formation because the W3 band includes the emission from polycyclic aromatic hydrocarbon molecules. While all 122 M31 GCs are plotted in this diagram, W3 was measured for only 31 (solid circles). For the other 91 GCs, W3 is an upper limit (open circles), and therefore W2-W3 is also an upper limit. Using only the GCs with measured values, we calculated the 2-D kernel density, and the dashed contour in the diagram encloses 90% of the density of these GCs. The faintest GCs are the ones lying above the contour. In order not to exclude faint GCs with only upper limit values, we will impose two different cuts by W2-W3. If W2-W3 was a measured value, like for solid circle objects, the cut will be at 3.1. If W2-W3 was an upper limit, it is raised to 4.0. The majority of M31 GCs () passed all of these three criteria. Also plotted (crosses: upper limit; X’s: measured value of W2-W3) are the 338 comparison objects that passed the previous two criteria. Only 128 of them or 6% of the original 2146 objects passed the final cut, demonstrating the value of this sequence of selection photometric criteria to reduce galaxy contamination.
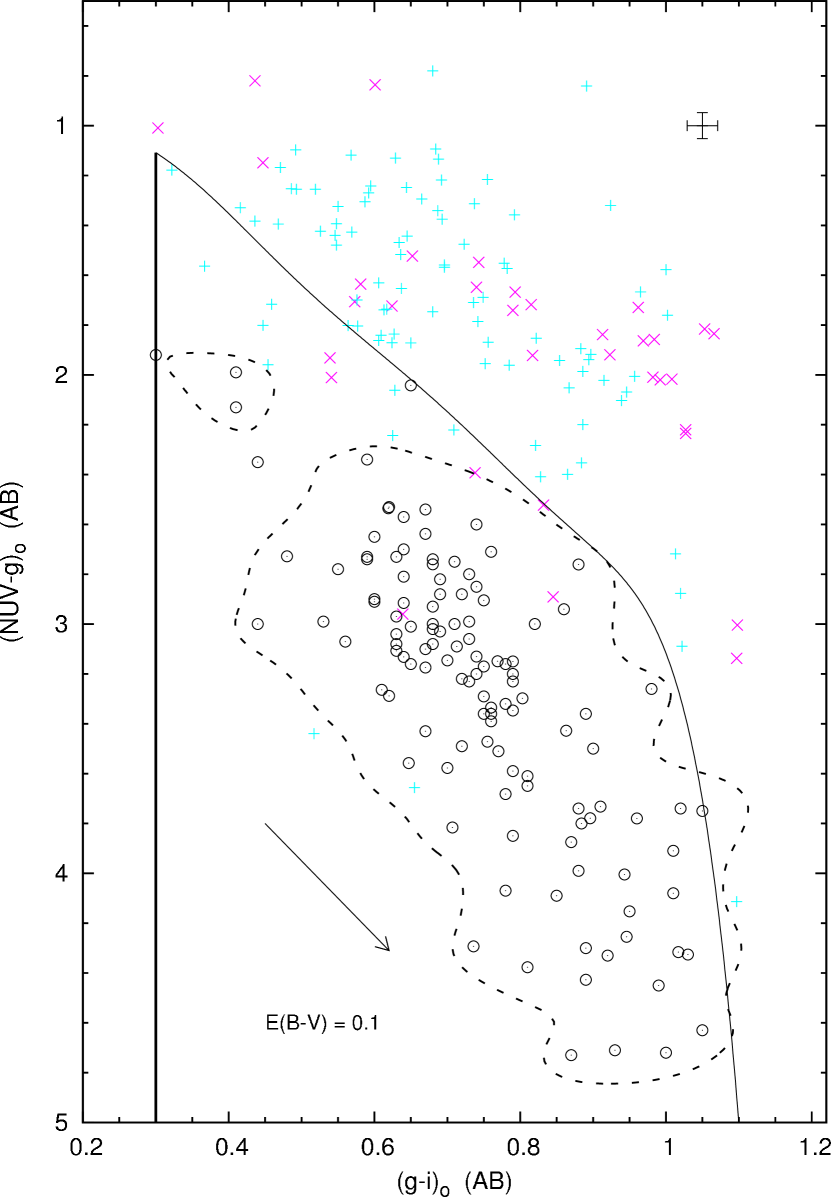
This selection procedure through WISE can be largely automated because the SDSS Galaxy Catalogue is linked to the WISE All-Sky Catalogue. Therefore, the first step for our selected survey for GC in the whole SDSS footprint was to query the SDSS Galaxy and the WISE All-Sky catalogues, via CasJobs on the SDSS website, for objects with for measurements of W2-W3, or for upper limits. Since the footprint of the SDSS contains galaxies of all magnitudes and colors, a huge number of objects () passed our first five selection criteria, still a sample too large to be inspected visually in a reasonable time, and still containing a large component of galaxies. At this point we introduced another cut, also discussed in Paper II, based on the color , which demonstrated to be very useful for separating GCs from galaxies with large UV fluxes, presumably because they contain many hot and luminous young stars. NUV is the GALEX magnitude in its near UV band ( effective Å) and g is the SDSS g-band magnitude. This additional criterion is illustrated in Figure 4 with the same sample of M31 GCs previously used (open circles) and the objects in the comparison region (crosses and X’s) that passed the previous cuts, and could also be identified in the Galex catalogue. The NUV measurements for many of the GCs were taken from the catalogue of Kang et al. (2012). For the remaining clusters and for the whole samples of comparison galaxies, we compared their positions with the objects in the GALEX catalogue that is available through the GALEXview website and considered a match if their positions agreed to . The average difference between the SDSS and GALEX positions was only , with having differences . Consequently, they are smaller than or, in the worse cases, comparable to the NUV psf ( to , Morrissey et al. (2007)). These results and the relatively low density of GALEX sources on the sky (e.g., Bianchi et al., 2014), suggest that very few of the objects drawn from the SDSS catalog were matched with the wrong GALEX source. If more than one GALEX measurement was available for an object, we computed the weighted average, using as weights one over the square of the error listed for NUV. Using the sample of 122 GCs, we computed the 2-D kernel density and the dashed contour in Figure 4 encompasses 90% of the density. The curve that separates most of the comparison objects from the GCs is identical to the one plotted in Figure 2 of Paper II, which had a larger sample of galaxies. While all 122 GCs lie below this curve and therefore pass this last criterion, only 16 of the remaining comparison objects lie below, and none of them could be classified as candidate GCs by visual inspection. After these tests, we concluded that the combination of the selection criteria illustrated in Figures 3 and 4 could reduce the number of objects to be visually examined to a small percentage of the initial sample (), while retaining most of the GCs (96%), making feasible our planned survey of the whole SDSS footprint. Therefore the second step, based on the color of our procedure was to query the GALEXview website for GALEX sources that matched the positions of the objects () that passed the WISE and Photoz cuts introduced in the first step of the survey. We found approximately coincidences, and to these objects we applied the cut based on the color (Fig. 4). The objects that passed this last cut, added to the ones that we could not find in GALEX, formed our final sample of 183,791 objects to be visually inspected.
4 Application to the Globular Clusters in other Local Group Galaxies
The above criteria appear to be well tuned for separating the halo GCs of M31 from galaxies, but do they also work for the GCs in the smaller galaxies of the LG, which may be better analogues of the IGCs? To examine this question, we compiled similar data on the GCs in the Fornax dSph galaxy, a satellite of the MW, in four satellites of M31 (M33, NGC 205, 147, 185), and in two dwarf irregular galaxies of the LG, NGC 6822 and Wolf-Lundmark-Melotte (WLM). Because most of these galaxies do not lie in the SDSS footprint, we could not include measurements of Photoz in this discussion. Moreover we did not consider the GCs in the MW, the Magellanic Clouds, and the Sagittarius dSph galaxy because they subtend such large angles on the sky that their measurement would require substantially different techniques than we employ in our survey of the LG.
In the case of the Fornax dSph galaxy ( kpc), its GCs subtend moderately large angles on the sky, with values of and for GCs F4, F3, F5, F2, and F1, respectively (McLaughlin & van der Marel, 2005). They provide a good test of the effects of using magnitudes, such as the WISE and GALEX ones, which do not capture all the light of an object. We computed the and W2-W3 colors using both the profile-fitting WISE magnitudes, which we adopted for our survey, and the largest WISE aperture, which is in diameter. For the Fornax GCs, we could not find in the literature measurements in the g or i pass-bands. Consequently, we made estimates that are based on the V and B-V measurements of F2, F3, F4, and F5 by Gordon & Kron (1983), on the values compiled for F1 by Harris & Racine (1979) and the reddening from Mackey & Gilmore (2003). We then constructed a transformation between and from measurements of M31 GCs in both colors.
In the diagrams of Figure 5 are plotted the Fornax GCs and the GCs in the other LG galaxies of our sample. The contours are the ones calculated for Figures 3 and 4. For each Fornax cluster, the colors formed by the profile-fitted WISE mag (filled circles) and the largest WISE aperture (X’s) are plotted and joined by dashed lines. Given the large of F1, it is not surprising that with the profile-fitted W1 magnitude, lies far outside the 90% contours that are defined by the sample of M31 GCs. F1 nonetheless passes our criterion. Despite the fact that the of F1 is significantly larger than the psfs of W2 and W3, its W2-W3 color passes the cut when the profile fitting magnitudes are used. The results obtained for other Fornax GCs with profile-fitting magnitudes are less deviant than the ones for F1, and with the largest WISE apertures all 5 Fornax clusters lie within or very close to 90% contours of the M31 sample. In the plot of vs. , all 5 Fornax clusters lie within the 90% contour despite their relatively large angular sizes. Because Fornax is well within the boundary of the MW’s halo as defined by its satellite galaxies (see McConnachie 2012), F1 may be larger in angular size than any IGC in the LG, unless they are atypical GCs. None of the GCs in the more distant LG galaxies have (see refs. below). The test provided by the Fornax clusters in Figure 5 suggests that the mismatches in the amounts of light included in the SDSS model magnitudes and the WISE and GALEX magnitudes are unlikely to cause GCs to be missed by our selection criteria.
Recent surveys of the dwarf irregular galaxy NGC 6822 ( kpc) by Hwang et al. (2011) and Huxor et al. (2013) have added 7 new GCs, bringing the total known to 9. We could reliably place 6 of these clusters (HVII, C2, C3, C4, SC6, SC7) in the diagrams that use WISE measurements and 4 of them (C2, C3, C4, SC7) in the one that uses GALEX (solid triangles in Fig. 5). The other clusters are too contaminated by a rich star field (HVIII), a nearby bright star (C1), or simply too faint (SC5) to be measured by WISE and GALEX. The identification of HVII and SC6 in the GALEX catalog was problematic because of other nearby sources. The above references provided the g and i-band photometry and the reddening values that we used. For HVII, we estimated from the color that was listed by Hwang et al. (2011). The reddening is variable in the direction of NGC 6822. Hwang et al. (2011) quote values of from 0.16 to 0.36 for the clusters in their study. The color of C3 (Hwang et al., 2011) is exceptionally red (1.35) for its metal-poor composition([Fe/H] = -1.61), which Hwang et al. (2014) measured from its spectrum. C3 failed every one of our GC criteria because of its red color. Our survey technique would have discovered 5 of the 9 clusters in NGC 6822, (or 56%). This limited success should not be indicative of our search for IGCs in the LG because some of the failures and omissions of the NGC 6822 clusters were caused by contamination from other sources in this galaxy, and presumably IGCs are in less dense fields.
The other LG dwarf irregular galaxy with GCs is WLM ( kpc), which contains one luminous GC (). We estimated its from the color measured by Billett et al. (2002). It is identified unambiguously in the WISE catalog, and passed our criteria based on WISE measurements (open circle in Fig. 5). It was not found by GALEX, presumably because of its proximity to other UV sources.
M33 ( kpc), the spiral galaxy companion of M31, lies within the SDSS footprint, although few of its GCs are in the SDSS Galaxy catalog because they are projected on the dense star fields of this face-on galaxy. Using the lists of Sarajedini & Mancone (2007); Huxor et al. (2009); Cockcroft et al. (2011), we identified 10 GCs in the SDSS Galaxy catalog with reliable photometry, 7 of which are brighter than the cutoff of our survey and passed also our Photoz criterion. All 7(crosses in Fig. 5) passed the , and all but one (S in Cockcroft et al. 2011), passed the W2-W3 one. Five of the seven clusters were identified in the GALEX catalogue, and all of them passed the criterion.
Veljanoski et al. (2013) recently discovered new GCs in the M31 satellites NGC 147 ( kpc) and NGC 185 ( kpc) and provided g- and i-band photometry, which we used for both the new and the previously known GCs. Of the 10 GCs now known in NGC 147, one (SD-GC10) is fainter than our limit and another (PA-N147-3) had to be excluded from our analysis because the g and i measurements for it are only lower limits (see Veljanosky et al. 2013). Five were identified unambiguously in the WISE catalog (Hodge I & III, SD-GC7, PA-N147-1 & 2) Two of the remaining GCs (Hodge II & SD-GC5) appear to be confused with other sources, and the faint cluster Hodge IV was not recognized by WISE, perhaps because of the high stellar density in its field (see Veljanosky et al. 2013) . All 5 measured clusters (solid squares in Fig. 5) passed the and W2-W3 criteria. Four of them were identified in the GALEX catalog, and they all passed the criterion.
In NGC 185 there are now 8 known GCs (Veljanoski et al., 2013), and 6 (FJJ-I, III, IV, V, VII, PA-N185) were found in the WISE catalogue. FJJ-II lies in a dense stellar field, and FJJ-V III appears to be blended with a nearby source. All of the 6 clusters with WISE measurements (open triangles in Fig. 5) passed the criterion, but only 5 passed the W2-W3 one. Two of them were identified in the GALEX catalog, FJJ-III and FJJ-V, and one, FJJ-III, which lies close to the center of NGC 185, failed the criterion.
The final dwarf galaxy, NGC 205 ( kpc), is projected so close to M31 that there is some uncertainty whether a GC belongs to it or to the M31 halo. The GCs near the center of NGC 205, which are among the most likely candidates for membership, are of little use here because they lie in extremely dense star fields. We therefore selected 4 of the more remote clusters, which are also among the brightest: B009 (Hubble (H)-I), B011 (H-II), B020 (H-III), and B317 (H-VIII). The B numbers are from the RBCv5, which provided the optical photometry. All 4 passed the criteria based on , W2-W3, and (asterisks in Fig. 5).
In summary, of the 42 GCs in the dwarf Local Group galaxies discussed above, 5 (12%) are fainter than our cutoff. We could not apply our survey techniques to another 8 clusters because of the crowding of images or the lack of g and i photometry. Twenty-nine GCs had adequate data and 25 (86%) passed the survey criteria. If the GCs in these dwarf galaxies are representative of the IGCs in the LG, then the majority of these IGCs should pass our selection criteria prior to the final step of visual inspection.
5 Results of the Local Group Survey
As described in section 3, the color selections that are based on the SDSS, WISE, and GALEX measurements reduced to 183,791 objects the initial sample of millions of objects from the SDSS Galaxy Catalogue. This sample is expected to contain a large fraction of the IGCs in the LG that are brighter than the limit of 19.0, if the M31 GCs are good proxies for them. The diagrams in Figure 2 suggest that of the IGCs brighter than the cutoff are missed by the star-galaxy separation at kpc and that this decreases to at M31’s distance (783 kpc). Consequently, the cutoff appears to be the more important of these two limitations. It sets a lower limit on the luminosities of the IGCs that can be detected, which scales, of course, with their distances, and it is at the outer boundary of the LG (see Fig. 2). The tests with the GCs in M31 (Figs. 3 & 4) and in the LG dwarf galaxies (Fig. 5) suggest that a large fraction () that are brighter than the cutoff pass the color selection techniques. It is harder to quantify the success our visual inspections of the objects that pass these other criteria, particularly as a function of distance. The resolution of the SDSS images, typically seeing with per pixel can make uncertain the distinction between compact GCs and some galaxies at the distance of M31 and beyond, even with the improvement of the image quality of the cutouts provided by SDSS in its DR10 (see Ahn et al., 2014) over previous releases. This later improvement would have reduced the larger misclassifications of candidate GCs that we made in our first survey, which was based on DR8. Our present survey retrieved of the known GCs in M31 and M33 in the search area, which is our best estimate of the success rate of our methods, including the visual inspection, at of the radius of the LG.
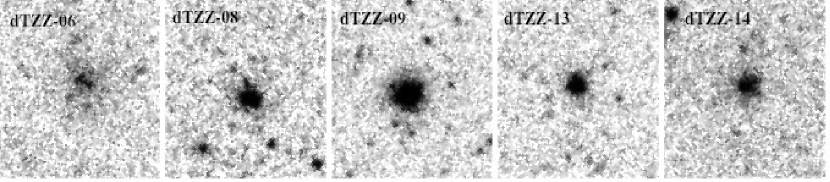
The visual examination of the SDSS cutout images of the objects that passed all other criteria yielded a surprisingly small list of 17 potential new GC candidates. Five of them appeared enough resolved in the SDSS images that we could classify them as high confidence candidates. Because they are near M31, we were able to locate them in g, r, or i band images taken with the MegaPrime camera of the CFHT and publicly available through the Canadian Astronomy Data Centre (CADC). These images are deeper and of higher resolution, typically seeing with per pixel. With these new images, we were able to confirm as GCs all 5 of our high confidence objects. Table 1 provides the positions of these new GCs and the data by which they were selected. The SDSS r-band thumbnail images of these GCs are shown in Figure 6. These faint GCs may have escaped detection until now because they are not within the areas covered by Hubble Space Telescope (HST) images and because they lie at smaller than the inner boundary ( kpc) of the PAandAS survey, which employed MegaPrime imaging.
To take advantage of the better resolution of the DR10 cutout images and also of the photometric selection criteria that are presented in this paper, we revisited the lists of high and lower confidence GCs provided in our first two surveys (Paper I & II). Most of the high confidence objects (tables 1 of Paper I & II) passed the new selection criteria, but only three of the lower confidence objects in table 2 of Paper I passed. We then visually inspected this reduced sample through the new cutouts of SDSS DR10. The ones that we reclassified as higher confidence candidates could be confirmed as GCs by our visual inspection of the MegaPrime images from the CADC archive. Some of them were later confirmed also by the PAndAS search (Huxor et al., 2014). Table 2 is the updated list of our newly discovered and confirmed GCs from the SDSS Galaxy Catalogue. This list is comprehensive of our 3 surveys and counts 22 GCs, including several with kpc. It lists the positions of the clusters, their reddening corrected values of r and g-i (from the model magnitudes and extinctions listed in the SDSS), their absolute r magnitudes (), their half-light radii (), and their projected distances from M31 (). The values of were estimated from the r-band light profiles provided by the SDSS, and they give rough estimates of the sizes of the clusters (see Paper I).
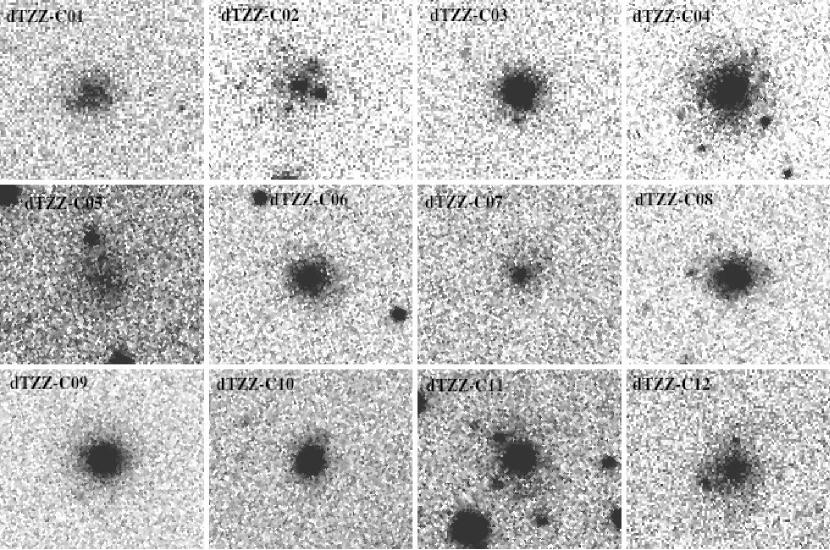
The 12 remaining candidates that we could not confirm as GCs are listed in Table 3, with their positions, photometric data, and angular sizes of . Their SDSS r-band thumbnail images are shown in Figure 7. The distribution on the sky of these 12 candidate GCs is shown in the Hammer projection of Figure 8. There is no evidence for a concentration in a particular region of the sky. None of them is in close proximity to the galaxies in or near the LG. Two of them, C1 and C9, appear in Figure 8 to be close to the dwarf galaxies IC1613 and KKR-25, respectively, but in each case, the angular separation is deg and many times the of the galaxy given by McConnachie (2012).
6 Application to the M81 Group of Galaxies
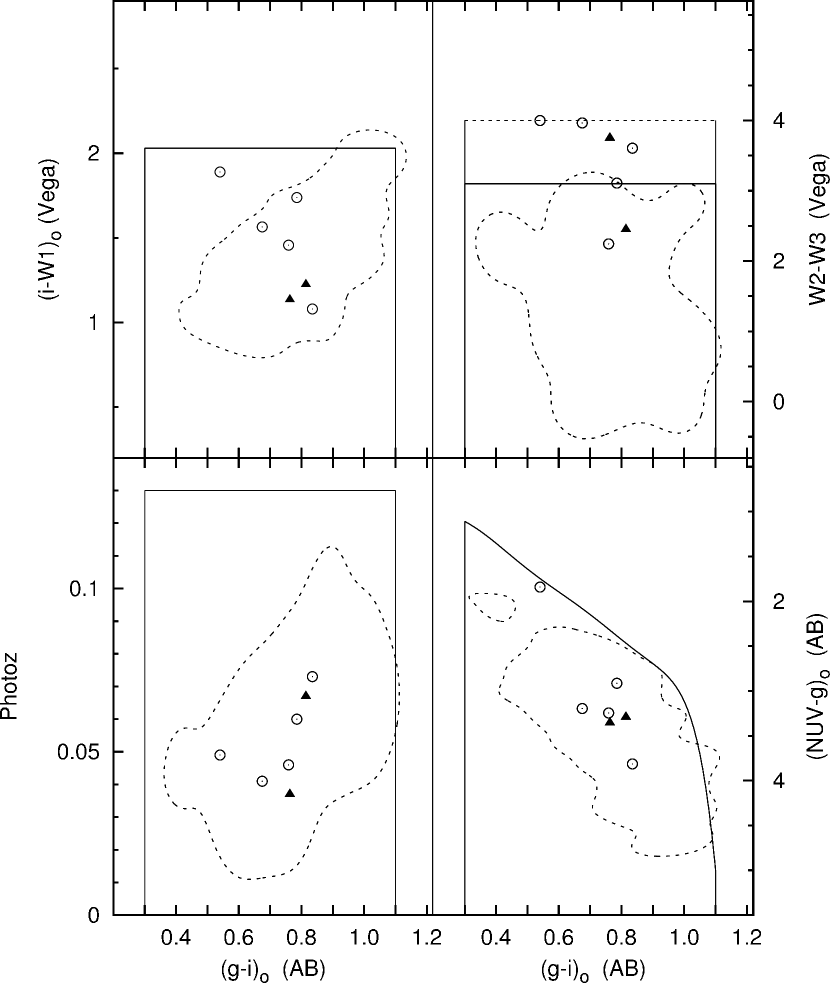
Our survey area covers many of the galaxies of the M81 group of galaxies, including M81, M82, and NGC3077, which have interacted with each other recently and are enclosed in a common envelop of HI gas (Chynoweth et al., 2008). At distance of Mpc Karachentsev et al. (2013), the M81 group is far from the LG, but nonetheless our survey techniques can identify the most luminous GCs as GC candidates. The two clusters that Jang et al. (2012) identified in the images of the HST Advanced Camera for Surveys (ACS), pass all our photometric criteria (filled triangles in Fig. 9). Since the M81 GCs are resolved into stars only on deep images with the HST (see Nantais et al., 2011), our visual examination of the SDSS images could simply reveal if an object was obviously a galaxy or if its image resembled those of the two clusters in Jang et al. (2012). Over the area of the sky around the M81 group defined by and , we lowered the limit of our survey to 20.0. The SDSS footprint covers about 80% the region enclosed by the above coordinates and has an odd shape with the peculiar galaxy M82 near its northern boundary. Many GCs at the distance of the M81 group are likely to be indistinguishable from stars in the SDSS images (see Perelmuter & Racine, 1995), and these clusters will not be listed in the SDSS Galaxy Catalogue. However, if the GCs in the M81 group resemble the M31 GCs, of the most luminous ones () will be non-stellar according to the SDSS criterion (see Fig. 2). The presence in the Galaxy Catalogue of the two luminous GCs identified by Jang et al. (2012) is consistent with this expectation. The objects that we identify as GC candidates in the M81 group are plotted in Figure 9 (open circles) and listed in table 4, where we have also listed their photometry and projected distances from M81. M81-C3, M81-C4, and M81-C5 are closer to the galaxies M82, NGC3077, and BK6N, respectively, than to M81, and may be physically related to them. Two of our candidate GCs, M81-C1 and M81-C2, are listed as 90262 and 50016 in Perelmuter & Racine (1995) catalogue of 3774 objects within 25 arcmin of M81. Neither one appears to have been investigated since then. The brighter of the two, M81-C2, which is also closest to M81, lies within the fields of 2000s and 800s exposures in the F300W pass-band with the HST’s wide-field and planetary camera 2 (WFPC2). Our inspection of these images did not reveal any signs that M81-C2 is a galaxy. The GC 1029 (Nantais et al., 2011), which is the most luminous one known in M81 (see Mayya et al., 2013), is very resolved into stars on F814W images with the HST ACS, but not obviously in a 6300s exposure with the WFPC2 in the F300W filter. Consequently, the fact that M81-C2 is not clearly a GC in the F300W WFPC2 images does not rule it out as a candidate.
7 Conclusions
This survey for GCs in the LG has identified 5 new GCs in the halo of M31 (see Table 1). Their properties do not appear to be exceptional, and their discovery suggests that the census of GCs in M31 may be still incomplete. The searches of the SDSS Galaxy Catalogue for GCs described here and in Papers I & II have yielded a total of 22 new GCs near M31 (see Table 2). These clusters span a wide range of (10-137 kpc), but even the most remote ones are likely to be members of M31’s halo. It is possible that measurements of their radial velocities and 3-D distances from M31 could reveal that some are not bound to it and are IGCs.
Of all the objects that passed our 5 selection criteria for GCs and our visual inspection, only 12 are so far from M31 that they may be IGCs in the LG (see Table 3). While they resemble GCs in the SDSS imaging (see Fig. 7), there is still the possibility that they are galaxies, and we consider them to be only GC candidates. These objects need to be investigated in more detail to see if they are truly GCs.
This sample of candidate IGCs in the LG is clearly incomplete because our survey has covered only about one-third of the sky (see Fig. 8), and we intend to expand the search in the southern sky. Moreover, some IGCs could have escaped our detection because they are hidden by obscuration near the Galactic Plane, blended with other objects, or fainter than our magnitude limit, which at the outer reaches of the LG excludes GCs with (see Fig. 2). Also, as mentioned previously, about 15% of the known GCs fail our selection criteria. Even with these caveats, our survey suggests that the LG does not appear to have a large population of IGCs, independently of their possible origin.
References
- Abadi et al. (2003) Abadi, M. G., Navarro, J. F., Steinmetz, M., & Eke, V. R. 2003, ApJ, 591, 499
- Abell (1955) Abell, G. O. 1955, PASP, 67, 258
- Ahn et al. (2014) Ahn, C. P. et al. 2014, ApJS, 211, 17
- Alamo-Martínez et al. (2013) Alamo-Martínez, K. A. et al. 2013, ApJ, 775, 20
- Ashman & Zepf (1992) Ashman, K. M., & Zepf, S. E. 1992, ApJ, 384, 50
- Bate et al. (2014) Bate, N. F. et al. 2014, MNRAS, 437, 3362
- Bekki & Yahagi (2006) Bekki, K., & Yahagi, H. 2006, MNRAS, 372, 1019
- Belokurov et al. (2014) Belokurov, V., Irwin, M. J., Koposov, S. E., Evans, N. W., Gonzalez-Solares, E., Metcalfe, N., & Shanks, T. 2014, MNRAS, 441, 2124
- Bianchi et al. (2014) Bianchi, L., Conti, A., & Shiao, B. 2014, Advances in Space Research, 53, 900
- Billett et al. (2002) Billett, O. H., Hunter, D. A., & Elmegreen, B. G. 2002, AJ, 123, 1454
- Bland-Hawthorn & Freeman (2014) Bland-Hawthorn, J., & Freeman, K. 2014, The Origin of the Galaxy and Local Group, Saas-Fee Advanced Course, Volume 37. ISBN 978-3-642-41719-1. Springer-Verlag Berlin Heidelberg, 2014, p. 1, 37, 1
- Bullock & Johnston (2005) Bullock, J. S., & Johnston, K. V. 2005, ApJ, 635, 931
- Caldwell et al. (2014) Caldwell, N., Strader, J., Romanowsky, A. J., Brodie, J. P., Moore, B., Diemand, J., & Martizzi, D. 2014, ApJ, 787, L11
- Chynoweth et al. (2008) Chynoweth, K. M., Langston, G. I., Yun, M. S., Lockman, F. J., Rubin, K. H. R., & Scoles, S. A. 2008, AJ, 135, 1983
- Cockcroft et al. (2011) Cockcroft, R. et al. 2011, ApJ, 730, 112
- Cole et al. (2012) Cole, D. R., Dehnen, W., Read, J. I., & Wilkinson, M. I. 2012, MNRAS, 426, 601
- Conroy et al. (2011) Conroy, C., Loeb, A., & Spergel, D. N. 2011, ApJ, 741, 72
- Conroy & Spergel (2011) Conroy, C., & Spergel, D. N. 2011, ApJ, 726, 36
- Cutri et al. (2011) Cutri, R. M. et al. 2011, Explanatory Supplement to the WISE Preliminary Data Release Products, Tech. rep.
- di Tullio Zinn & Zinn (2013) di Tullio Zinn, G., & Zinn, R. 2013, AJ, 145, 50
- di Tullio Zinn & Zinn (2014) —. 2014, AJ, 147, 90
- Elmegreen et al. (2012) Elmegreen, B. G., Malhotra, S., & Rhoads, J. 2012, ApJ, 757, 9
- Fardal et al. (2013) Fardal, M. A. et al. 2013, MNRAS, 434, 2779
- Galleti et al. (2004) Galleti, S., Federici, L., Bellazzini, M., Fusi Pecci, F., & Macrina, S. 2004, A&A, 416, 917
- Garrison-Kimmel et al. (2014) Garrison-Kimmel, S., Boylan-Kolchin, M., Bullock, J. S., & Lee, K. 2014, MNRAS, 438, 2578
- Gill et al. (2005) Gill, S. P. D., Knebe, A., & Gibson, B. K. 2005, MNRAS, 356, 1327
- Gordon & Kron (1983) Gordon, K. C., & Kron, G. E. 1983, PASP, 95, 461
- Gregg et al. (2009) Gregg, M. D. et al. 2009, AJ, 137, 498
- Harris & Pudritz (1994) Harris, W. E., & Pudritz, R. E. 1994, ApJ, 429, 177
- Harris & Racine (1979) Harris, W. E., & Racine, R. 1979, ARA&A, 17, 241
- Huxor et al. (2009) Huxor, A., Ferguson, A. M. N., Barker, M. K., Tanvir, N. R., Irwin, M. J., Chapman, S. C., Ibata, R., & Lewis, G. 2009, ApJ, 698, L77
- Huxor et al. (2013) Huxor, A. P., Ferguson, A. M. N., Veljanoski, J., Mackey, A. D., & Tanvir, N. R. 2013, MNRAS, 429, 1039
- Huxor et al. (2014) Huxor, A. P. et al. 2014, MNRAS, 442, 2165
- Huxor et al. (2008) Huxor, A. P., Tanvir, N. R., Ferguson, A. M. N., Irwin, M. J., Ibata, R., Bridges, T., & Lewis, G. F. 2008, MNRAS, 385, 1989
- Hwang et al. (2011) Hwang, N., Lee, M. G., Lee, J. C., Park, W.-K., Park, H. S., Kim, S. C., & Park, J.-H. 2011, ApJ, 738, 58
- Hwang et al. (2014) Hwang, N., Park, H. S., Lee, M. G., Lim, S., Hodge, P. W., Kim, S. C., Miller, B., & Weisz, D. 2014, ApJ, 783, 49
- Ibata et al. (2013) Ibata, R., Nipoti, C., Sollima, A., Bellazzini, M., Chapman, S. C., & Dalessandro, E. 2013, MNRAS, 428, 3648
- Jang et al. (2012) Jang, I. S., Lim, S., Park, H. S., & Lee, M. G. 2012, ApJ, 751, L19
- Kang et al. (2012) Kang, Y., Rey, S.-C., Bianchi, L., Lee, K., Kim, Y., & Sohn, S. T. 2012, ApJS, 199, 37
- Karachentsev et al. (2013) Karachentsev, I. D., Makarov, D. I., & Kaisina, E. I. 2013, AJ, 145, 101
- Kazantzidis et al. (2013) Kazantzidis, S., Łokas, E. L., & Mayer, L. 2013, ApJ, 764, L29
- Keller et al. (2012) Keller, S. C., Mackey, D., & Da Costa, G. S. 2012, ApJ, 744, 57
- Koposov et al. (2007) Koposov, S. et al. 2007, ApJ, 669, 337
- Kravtsov & Gnedin (2005) Kravtsov, A. V., & Gnedin, O. Y. 2005, ApJ, 623, 650
- Laevens et al. (2014) Laevens, B. P. M. et al. 2014, ApJ, 786, L3
- Law & Majewski (2010) Law, D. R., & Majewski, S. R. 2010, ApJ, 718, 1128
- Lee et al. (2010) Lee, M. G., Park, H. S., & Hwang, H. S. 2010, Science, 328, 334
- Mackey et al. (2010) Mackey, A. D. et al. 2010, MNRAS, 401, 533
- Mackey & Gilmore (2003) Mackey, A. D., & Gilmore, G. F. 2003, MNRAS, 340, 175
- Mackey & Gilmore (2004) —. 2004, MNRAS, 355, 504
- Madore & Arp (1979) Madore, B. F., & Arp, H. C. 1979, ApJ, 227, L103
- Maraston (1998) Maraston, C. 1998, MNRAS, 300, 872
- Maraston (2005) —. 2005, MNRAS, 362, 799
- Martin et al. (2006) Martin, N. F., Ibata, R. A., Irwin, M. J., Chapman, S., Lewis, G. F., Ferguson, A. M. N., Tanvir, N., & McConnachie, A. W. 2006, MNRAS, 371, 1983
- Martin et al. (2013a) Martin, N. F. et al. 2013a, ApJ, 779, L10
- Martin et al. (2013b) —. 2013b, ApJ, 772, 15
- Mashchenko & Sills (2005) Mashchenko, S., & Sills, A. 2005, ApJ, 619, 258
- Mayer et al. (2001) Mayer, L., Governato, F., Colpi, M., Moore, B., Quinn, T., Wadsley, J., Stadel, J., & Lake, G. 2001, ApJ, 559, 754
- Mayya et al. (2013) Mayya, Y. D., Rosa-González, D., Santiago-Cortés, M., Rodríguez-Merino, L. H., Vega, O., Torres-Papaqui, J. P., Bressan, A., & Carrasco, L. 2013, MNRAS, 436, 2763
- McConnachie (2012) McConnachie, A. W. 2012, AJ, 144, 4
- McLaughlin & van der Marel (2005) McLaughlin, D. E., & van der Marel, R. P. 2005, ApJS, 161, 304
- Morrissey et al. (2007) Morrissey, P. et al. 2007, ApJS, 173, 682
- Nantais et al. (2011) Nantais, J. B., Huchra, J. P., Zezas, A., Gazeas, K., & Strader, J. 2011, AJ, 142, 183
- Peebles (1984) Peebles, P. J. E. 1984, ApJ, 277, 470
- Peng et al. (2011) Peng, E. W. et al. 2011, ApJ, 730, 23
- Perelmuter & Racine (1995) Perelmuter, J.-M., & Racine, R. 1995, AJ, 109, 1055
- Sales et al. (2007) Sales, L. V., Navarro, J. F., Abadi, M. G., & Steinmetz, M. 2007, MNRAS, 379, 1475
- Samsing (2015) Samsing, J. 2015, ApJ, 799, 145
- Sarajedini & Mancone (2007) Sarajedini, A., & Mancone, C. L. 2007, AJ, 134, 447
- Schiavon et al. (2012) Schiavon, R. P., Caldwell, N., Morrison, H., Harding, P., Courteau, S., MacArthur, L. A., & Graves, G. J. 2012, AJ, 143, 14
- Schweizer (1987) Schweizer, F. 1987, in Nearly Normal Galaxies. From the Planck Time to the Present, ed. S. M. Faber, 18–25
- Stoughton et al. (2002) Stoughton, C. et al. 2002, AJ, 123, 485
- Teyssier et al. (2012) Teyssier, M., Johnston, K. V., & Kuhlen, M. 2012, MNRAS, 426, 1808
- Veljanoski et al. (2013) Veljanoski, J. et al. 2013, MNRAS, 435, 3654
- Veljanoski et al. (2014) —. 2014, MNRAS, 442, 2929
- West & Gregg (2014) West, M., & Gregg, M. 2014, in American Astronomical Society Meeting Abstracts, Vol. 223, American Astronomical Society Meeting Abstracts, #106.03
- West et al. (2011) West, M. J., Jordán, A., Blakeslee, J. P., Côté, P., Gregg, M. D., Takamiya, M., & Marzke, R. O. 2011, A&A, 528, A115
- Whitmore & Schweizer (1995) Whitmore, B. C., & Schweizer, F. 1995, AJ, 109, 960
- Zinn (1993) Zinn, R. 1993, in Astronomical Society of the Pacific Conference Series, Vol. 48, The Globular Cluster-Galaxy Connection, ed. G. H. Smith & J. P. Brodie, 38
- Zolotov et al. (2009) Zolotov, A., Willman, B., Brooks, A. M., Governato, F., Brook, C. B., Hogg, D. W., Quinn, T., & Stinson, G. 2009, ApJ, 702, 1058
| Name | R.A. | Decl. | aaUpper limits | PhotozbbPhotoz is used as a color index, not as a measure of redshift. | |||||
|---|---|---|---|---|---|---|---|---|---|
| (deg J2000) | (deg J2000) | (mag) | (mag) | (mag) | (mag) | (mag) | |||
| dTZZ-06 | 9.48287 | 41.30932 | 18.820.03 | 2.620.08 | 0.720.06 | 1.110.15 | 3.63 | 0.0430.032 | |
| dTZZ-08 | 9.63313 | 39.86855 | 18.220.01 | 4.690.27 | 1.010.02 | 1.590.06 | 3.28 | 0.0880.051 | |
| dTZZ-09 | 9.75310 | 41.23024 | 17.890.01 | 3.890.07 | 0.810.03 | 1.040.08 | 3.54 | 0.1190.046 | |
| dTZZ-13 | 11.43322 | 42.65674 | 18.900.02 | 3.840.16 | 1.040.03 | 2.020.07 | 3.79 | 0.0500.019 | |
| dTZZ-14 | 11.59881 | 42.60960 | 18.920.02 | 1.020.04 | 1.050.14 | 3.62 | 0.0780.034 |
Note. — and are on the Vega system. All other magnitudes are on the AB system.
| Cluster | PreviousaaName used in Paper I or II. | R. A. | Decl. | Confirmation | |||||
|---|---|---|---|---|---|---|---|---|---|
| Name | Name | (deg J2000) | (deg J2000) | (mag) | (mag) | (mag) | (pc) | (kpc) | |
| dTZZ-01 | A | 5.14119 | 36.65953 | 17.44 | 0.82 | -7.0 | 8.5 | 86 | b.c |
| dTZZ-02 | B | 6.71750 | 38.74947 | 15.99 | 0.69 | -8.5 | 4.2 | 54 | b,c |
| dTZZ-03 | C | 7.86467 | 39.53942 | 17.33 | 0.68 | -7.1 | 4.1 | 38 | b,c |
| dTZZ-04 | SDSS1 | 9.00774 | 40.49723 | 17.36 | 1.08 | -7.1 | 10.5 | 20 | b,c |
| dTZZ-05 | D | 9.03580 | 39.29165 | 17.24 | 0.73 | -7.2 | 4.1 | 32 | b |
| dTZZ-06 | 9.48287 | 41.30932 | 18.82 | 0.72 | -5.6 | 9.7 | 12 | b | |
| dTZZ-07 | E | 9.61483 | 40.65835 | 18.26 | 1.01 | -6.2 | 5.6 | 14 | b |
| dTZZ-08 | 9.63313 | 39.86855 | 18.22 | 1.01 | -6.2 | 5.1 | 22 | b | |
| dTZZ-09 | 9.75310 | 41.23024 | 17.89 | 0.81 | -6.6 | 6.3 | 10 | b | |
| dTZZ-10 | SDSS3 | 9.80443 | 41.70220 | 18.25 | 1.08 | -6.2 | 5.9 | 11 | b,c |
| dTZZ-11 | SDSS4 | 10.32496 | 42.77124 | 17.71 | 1.14 | -6.8 | 7.2 | 21 | b,c |
| dTZZ-12 | SDSS6 | 10.61489 | 39.92444 | 18.51 | 0.93 | -6.0 | 7.1 | 18 | b,c |
| dTZZ-13 | 11.43322 | 42.65674 | 18.90 | 1.04 | -5.6 | 4.7 | 20 | b | |
| dTZZ-14 | 11.59881 | 42.60960 | 18.92 | 1.02 | -5.5 | 6.3 | 21 | b | |
| dTZZ-15 | SDSS8 | 12.65142 | 42.53047 | 18.57 | 1.10 | -5.9 | 9.1 | 26 | b,c |
| dTZZ-16 | SDSS9 | 13.41490 | 42.58747 | 17.20 | 0.66 | -7.3 | 7.2 | 33 | b,c |
| dTZZ-17 | SDSS11 | 14.73495 | 42.46061 | 15.61 | 0.70 | -8.9 | 4.0 | 44 | b,c |
| dTZZ-18 | SDSS12 | 18.19590 | 42.42356 | 16.88 | 0.74 | -7.6 | 5.0 | 78 | b,c |
| dTZZ-19 | SDSS15 | 20.76470 | 41.91971 | 16.77 | 0.70 | -7.7 | 4.0 | 103 | b,c |
| dTZZ-20 | C62 | 21.94838 | 40.67996 | 18.71 | 0.76 | -5.8 | 11.3 | 116 | b,c |
| dTZZ-21 | G | 22.20478 | 47.07277 | 16.98 | 0.81 | -7.5 | 6.1 | 137 | b,d |
| dTZZ-22 | SDSS16 | 22.25898 | 40.78570 | 18.25 | 0.83 | -6.2 | 6.6 | 119 | b,c |
Note. — Confirmation key: b = our visual inspection of MegaPrime images, c = Huxor et al. (2014), d = Huxor, A. (private communication).
| Name | R.A. | Decl. | Photoz | ||||||
|---|---|---|---|---|---|---|---|---|---|
| (deg J2000) | (deg J2000) | (mag) | (mag) | (mag) | (mag) | (mag) | (arcsec) | ||
| dTZZ-C01 | 13.61358 | 4.18373 | 18.720.08 | 1.680.06 | 0.310.12 | 1.460.17 | 2.78aaUpper limit | 0.0410.025 | 2.7 |
| dTZZ-C02 | 17.34474 | -5.91597 | 18.080.04 | 0.730.04 | 1.670.06 | 2.82aaUpper limit | 0.0720.075 | 3.4 | |
| dTZZ-C03 | 31.37672 | 6.77809 | 17.840.01 | 1.980.14 | 0.460.02 | 1.310.06 | 3.30aaUpper limit | 0.0340.010 | 2.1 |
| dTZZ-C04 | 37.649609 | 46.31996 | 17.250.01 | 2.290.20 | 0.850.02 | 1.220.05 | 3.020.33 | 0.0710.041 | 3.2 |
| dTZZ-C05 | 102.15198 | -18.38880 | 17.710.04 | 0.690.07 | 1.190.10 | 3.84aaUpper limit | 0.1000.057 | 2.7: | |
| dTZZ-C06 | 120.87215 | 13.07730 | 18.200.01 | 0.850.03 | 1.700.07 | 3.95aaUpper limit | 0.0670.029 | 2.2 | |
| dTZZ-C07 | 152.40421 | 61.26622 | 18.530.03 | 2.010.07 | 0.600.05 | 0.190.20 | 3.57aaUpper limit | 0.0470.037 | 2.1 |
| dTZZ-C08 | 238.65523 | 12.92038 | 18.000.01 | 1.470.10 | 0.370.03 | 0.910.11 | 3.94aaUpper limit | 0.0350.019 | 2.1 |
| dTZZ-C09 | 250.07475 | 54.96822 | 17.660.01 | 3.780.45 | 0.930.01 | 1.410.03 | 2.30aaUpper limit | 0.0740.036 | 2.4 |
| dTZZ-C10 | 255.93616 | 38.79727 | 18.020.01 | 2.890.08 | 0.930.02 | 1.900.04 | 2.580.39 | 0.0680.028 | 1.2 |
| dTZZ-C11 | 313.82498 | 54.71283 | 15.510.01 | 0.850.02 | 1.560.03 | 1.14aaUpper limit | 0.0790.051 | 1.3 | |
| dTZZ-C12 | 343.69748 | 17.43929 | 18.080.02 | 0.630.03 | 1.360.08 | 3.90aaUpper limit | 0.0670.016 | 2.8 |
Note. — Photoz is used as a color index and not a measure of redshift.
| Name | R.A. | Decl. | aaUpper limit | Photoz | bbProjected distance from M81. | ||||
|---|---|---|---|---|---|---|---|---|---|
| (deg J2000) | (deg J2000) | (mag) | (mag) | (mag) | (mag) | (mag) | (kpc) | ||
| M81-C1 | 148.10805 | 68.80711 | 19.220.02 | 1.840.03 | 0.540.03 | 1.890.10 | 3.99 | 0.0490.014 | 24 |
| M81-C2 | 148.57085 | 68.92275 | 17.370.02 | 3.240.03 | 0.760.01 | 1.460.04 | 2.24 | 0.0460.024 | 12 |
| M81-C3 | 149.52321 | 69.57946 | 18.460.01 | 3.200.04 | 0.680.02 | 1.570.08 | 3.96 | 0.0410.026 | 36 |
| M81-C4 | 151.32164 | 68.77572 | 18.510.01 | 3.820.32 | 0.840.02 | 1.080.11 | 3.61 | 0.0730.031 | 58 |
| M81-C5 | 158.17458 | 65.70965 | 17.990.01 | 2.920.10 | 0.790.01 | 1.740.04 | 3.11 | 0.0600.020 | 309 |
| GC-1ccKnown globular cluster (Jang et al. 2012) | 148.35931 | 69.52164 | 18.260.01 | 3.360.05 | 0.760.02 | 1.140.09 | 3.75 | 0.0370.021 | 31 |
| GC-2ccKnown globular cluster (Jang et al. 2012) | 148.33411 | 69.65462 | 17.310.01 | 3.290.03 | 0.810.01 | 1.230.05 | 2.45 | 0.0670.030 | 39 |
Note. — Photoz is used as a color index and not a measure of redshift.