eurm10 \checkfontmsam10 \pagerange???–???
Post-Disruptive Runaway Electron Beam in COMPASS Tokamak
Abstract
For ITER-relevant runaway electron studies, such as suppression, mitigation, termination and/or control of runaway beam, obtaining the runaway electrons after the disruption is important. In this paper we report on the first achieved discharges with post-disruptive runaway electron beam, entitled “runaway plateau”, in the COMPASS tokamak. The runaway plateau is produced by massive gas injection of argon. Almost all of the disruptions with runaway electron plateaus occurred during the plasma current ramp-up phase. Comparison between the Ar injection discharges with and without plateau has been done for various parameters. Parametrisation of the discharges shows that COMPASS disruptions fulfill the range of parameters important for the runaway plateau occurrence. These parameters include electron density, electric field, disruption speed, effective safety factor, maximum current quench electric field. In addition to these typical parameters, the plasma current value just before the massive gas injection surprisingly proved to be important.
1 Introduction
As the tokamak concept developed in the last 50 years and advanced towards the ITER design, numerous challenges occurred and many were solved. One of the remaining tasks is control or mitigation of Runaway Electrons (RE) in ITER after the disruption. Estimations from codes predict RE with several tens of MeV to carry up to 70% of pre-disruptive plasma current (Hender et al., 2007, p. S178). As deposition of runaway electron beam can be highly localised, it could severely damage plasma facing components and blanket modules of ITER.
The electron is said to run away, when the collisional drag force acting on it becomes smaller than the accelerating force coming from the toroidal electric field . There are three main mechanisms for the runaway generation: a) Dreicer (primary) mechanism Dreicer (1959, 1960); b) hot-tail mechanism Smith & Verwichte (2008); c) avalanche (secondary) mechanism Rosenbluth & Putvinski (1997). However, there is a theoretical limit for the electrical field, so called critical field , under which RE cannot be produced by these mechanisms Connor & Hastie (1975). The toroidal electric field in ITER during the stable discharge will be under the threshold, making the controlled ITER plasma void of the RE. On the other hand, if disruption occurs, the electron temperature would drop during Thermal Quench (TQ), and thus plasma electric resistivity would increase. , being proportional to , will rise dramatically during the Current Quench (CQ), because the current density drops much slower than the electric resistivity increase due to the vessel electromagnetic field penetration time. This increase of the field will first induce runaway seeds that will then be multiplied enormously by the avalanche effect. In the ITER disruption scenarios, the avalanche multiplication factor could be as large as (Hender et al., 2007, table 5), forming an electron beam that could threaten ITER’s first wall structure. Following the above outline, ITER should be equipped with a proper suppression and/or mitigation technique dedicated to the RE control. Thus, achieving post-disruptive RE beam is one of the first significant steps for COMPASS towards the ITER-relevant runaway suppression/mitigation studies.
The COMPASS tokamak Pánek et al. (2006) is a small-size experimental fusion device with major radius cm and minor radius cm. Toroidal magnetic field is in T range and plasma current can reach up to kA. Electron densities are flexible and are typically of order of magnitude of m-3. Plasma shaping varies from circular and elliptical to single-null D-shaped ITER-like plasmas. The typical pulse length is s, although the low current circular discharge with RE can last almost s. Furthermore, flexibility of various plasma parameters (e.g. shaping, densities, plasma current, etc.) combined with significant, but still safe, runaway population make COMPASS suitable for runaway models validation and scaling towards ITER.
In contrary to large tokamaks (e.g. JET, ITER), where most of the RE are produced during the disruption Martin et al. (1995); Yoshino et al. (1999); Gill et al. (2000), in small and medium size tokamaks RE are created either during the current ramp-up or the flat-top phase Esposito et al. (2003); Papřok et al. (2013) when is low and/or is high enough. Additionally, the present COMPASS maximum value for is T, while various observations noted that getting the post-disruptive RE spontaneously is not possible if is under T Martin et al. (1995); Yoshino et al. (1999); Gill et al. (2002). The -limit is the most probable reason for the lack of post-disruptive runaway observations in COMPASS. Therefore, size of the COMPASS and its maximum could discard this facility from the ITER-relevant runaway suppression/mitigation research. Nevertheless, some of optimism can be found in experiments in which the post-disruptive RE were achieved with high-Z Massive Gas Injection (MGI) Yoshino et al. (1999); Gill et al. (2002); Hollmann et al. (2013) or high-Z pellet injection Yoshino et al. (1999); Hollmann et al. (2013), since some of these experiments had lower than T. Moreover, a detailed study of -limit as a function of amount of Ar injected was performed recently in JET Reux et al. (2014), where post-disruptive RE were observed even for T. Therefore, Ar injection was used to trigger the first post-disruptive RE in COMPASS.
The paper is organised as follows: in section 2, the experimental setup used for the experiments and demonstration of runaway plateau observation is presented. In section 3, general runaway parameters are reported, followed by the injection and disruption details. The section is finalised with the discharge analyses of the parameters important for the plateau occurrence. In section 4, the results presented in section 3 are discussed. Finally, in section 5 conclusions and future perspectives are addressed.
2 Introduction to Experiment
2.1 Experimental Setup
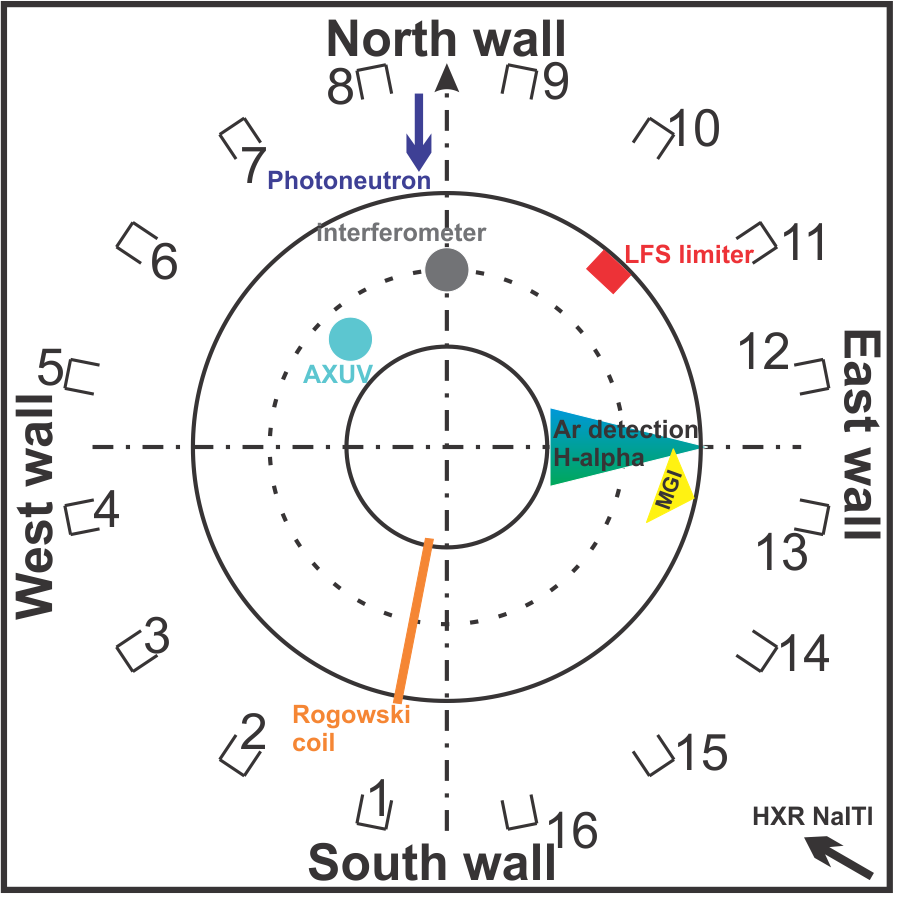
In all discharges described in this paper the plasmas were circular - limited by the carbon High Field Side (HFS) wall - with additional carbon Low Field Side (LFS) limiter for the inner wall vessel protection (see Fig. 1). Typical magnetic field was T and plasma currents at the moment of the gas injection varied from to kA. The electron density was relatively low ( m-3) for maximising the runaway generation. Schematics of the experimental setup used in the experiments presented in this article is shown in Fig. 1. In this article, measurements of runaway losses will be presented from PhotoNeutron (PN) detector located nearby the north wall and NaI(Tl) scintillator for Hard X-Ray (HXR) detection located at the south-east part of the tokamak hall. Both detectors are approximately m from the vessel. Photoneutrons with energy of few MeV are observed with the ZnS(Ag) neutron detector embedded in a plastic matrix. Beside the neutrons, the PN detector is suspected to be sensitive to the strong fluxes of HXR, although the detector is shielded by cm of Pb. HXR are measured with unshielded NaI(Tl) scintillation detector, where the signal is amplified with a photomultiplier tube and the energy range is approximatelly from keV to few MeV. Furthermore, the low energy photon radiation measurements will be presented from detector and the bolometry. detector is located radially at the east part of the tokamak vessel. AXUV photodiodes, located at the north-west part of the tokamak vessel, with photon energy response from eV to keV are used for bolometric measurements.
MGI of argon was achieved using a solenoid valve, located on the east side of the tokamak. The solenoid gas valve is connected to the vessel through two stainless steel tubes: the first one is cm long and has an inner diameter of mm, while the second one is cm long and has an inner diameter of mm. This non-negligible tube length implies a delay between the time of valve opening and the time at which the argon puff starts to interact with the plasma, i.e. roughly the time at which the gas enters the vacuum vessel. The delay is estimated to be approximately ms taking into account a mean velocity of approximately ms for argon gas in vacuum at K.
The Ar flow rate through the injection system was evaluated experimentally as a function of the back pressure and with linear dependence as follows:
| (1) |
where is in bars and is in particless. The pressure used for the plateau discharges were and bar, corresponding to particle flow rates of and particles/s, respectively. The valve is roughly estimated to be open ms, better knowlegde of gas valve performance will be available soon by the installation of a fast opening and more reliable valve.
Since there is a pipe between the valve and the tokamak vessel, the duration time for Ar to enter the vessel is larger then the opening time of the valve and this Ar puff duration in the tokamak vessel will be estimated here. For the two aforementioned back pressures, bar and bar, the manufacturer gives a flux through the solenoid valve at standard conditions of and Pa ms corresponding to flow rates of and particless at K, respectively. Therefore, assuming a constant flow rate of the solenoid gas valve with the increase of pressure in the stainless steel pipe and neglecting the flow rate through the injection system in the tokamak, one can calculate the number of particles that fill the pipe and that will be puffed in the tokamak later on. Remembering that the valve stays open for about ms, one can find that there will be about and particles for bar and bar, respectively. Notice that these numbers are much smaller than the total number of particles that can be stored in the pipes at bar and bar ( and respectively), justifying the assumption of constant flow rate through the solenoid valve. Now, knowing the flow rate through the injection system and the number of particles in the pipes, one can give an estimation of what the Ar puff duration in the tokamak vessel is: ms for bar and ms for bar. The runaway plateau created in this manner lasted from to ms.
2.2 Plateau Observation
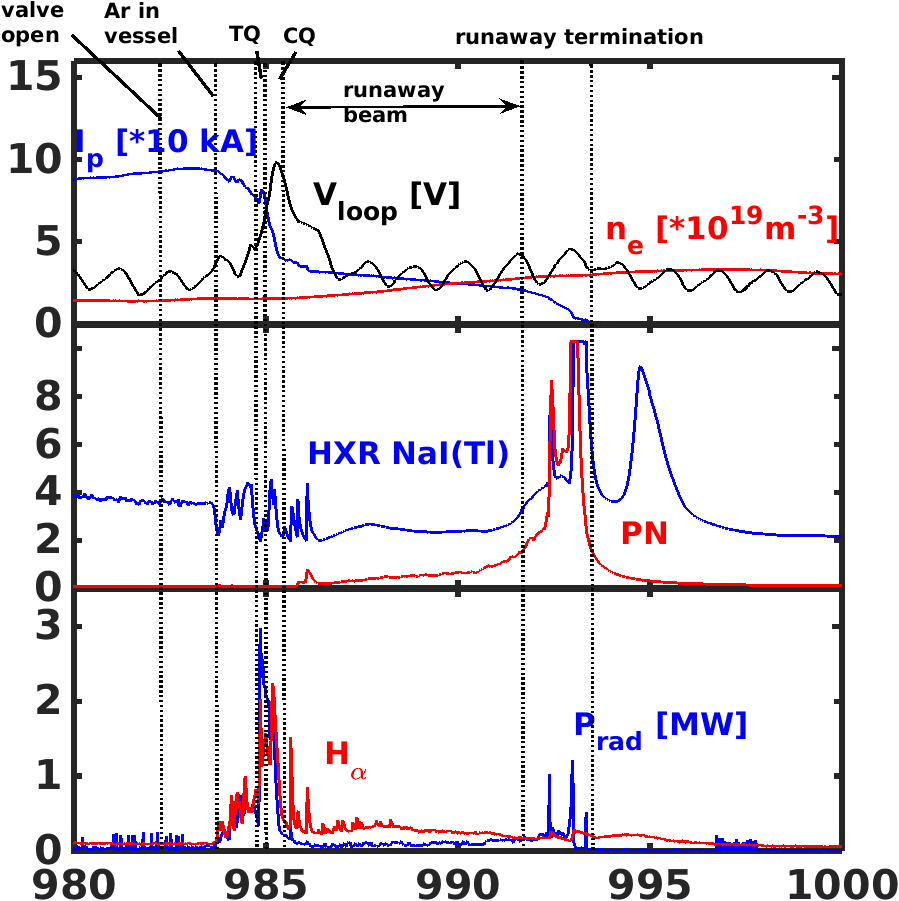
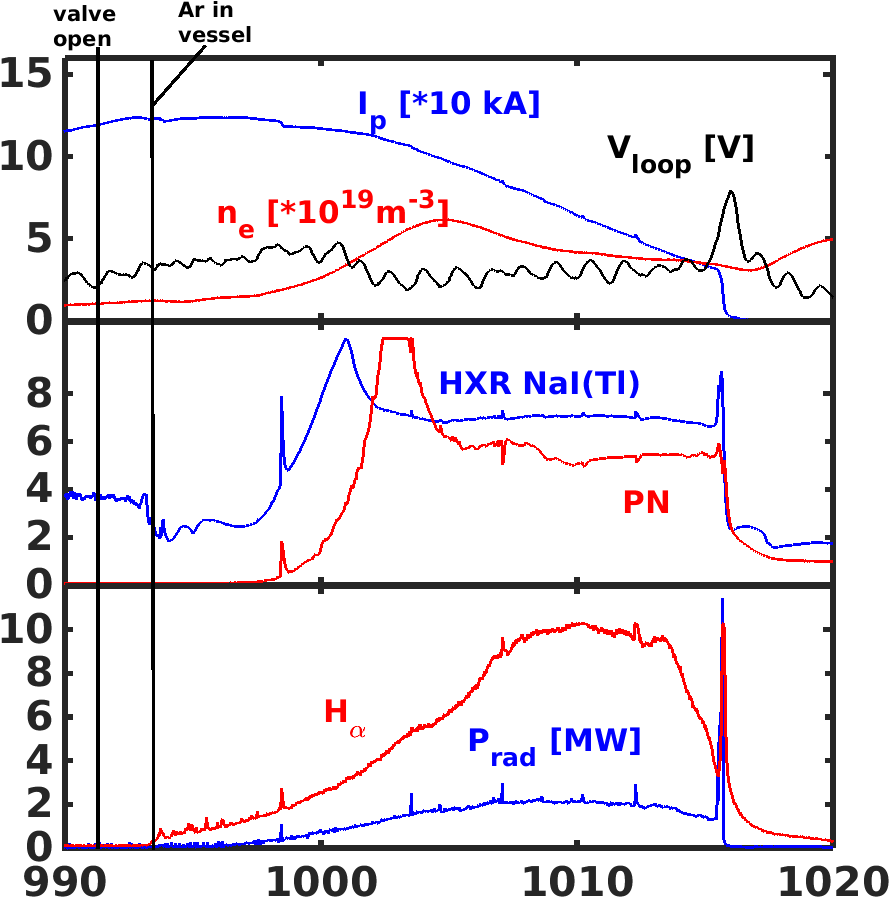
An example of a typical COMPASS discharge with MGI generated runaway plateau is shown in Fig. 2(a), together with slow decay for comparison in Fig. 2(b). Fig. 2(a) shows the plateau discharge #8585, when Ar puff starts to cool down the plasma, starts to drop and plasma radiation increases. After approximately ms (this delay will be justified in the next section), TQ occurs and almost all plasma energy is radiated. At the same time the HXR measurement shows relatively low peaks in half saturated state and PN signal is rather low, meaning that high energy RE created during the discharge initial phase are still confined. Then, during the CQ, is increased and boosts runaway production creating and amplifying the runaway beam. After the CQ the runaway beam carries non-zero current called , lasting for few milliseconds as one can see from the top graph in Fig. 2(a). Finally, the RE beam terminates with the loss seen in HXR and PN signals, while there are almost no radiation and radiated power from plasma proving the runaway plateau existence. On the other hand, the COMPASS discharge #8668 (see Fig. 2(b)) displays an example of the slow radiative decay with MGI on COMPASS resembling to ramp-down, for which no TQ and CQ (a typical sign of fast disruption) are observed. In this discharge plasma radiates on a long time scale ( ms). Although HXR and PN signals show presence of released RE, we shall not consider this as the runaway plateau, because the current is mainly driven by the thermalised plasma and not by the runaway beam, as one can see from strong emission. Notice that the difference in and measurements makes the distinction between the runaway plateau and the slow radiative decay. The former one has a relatively low radiation level after the disruption, indicating that there is only cold plasma beside the runaway population.
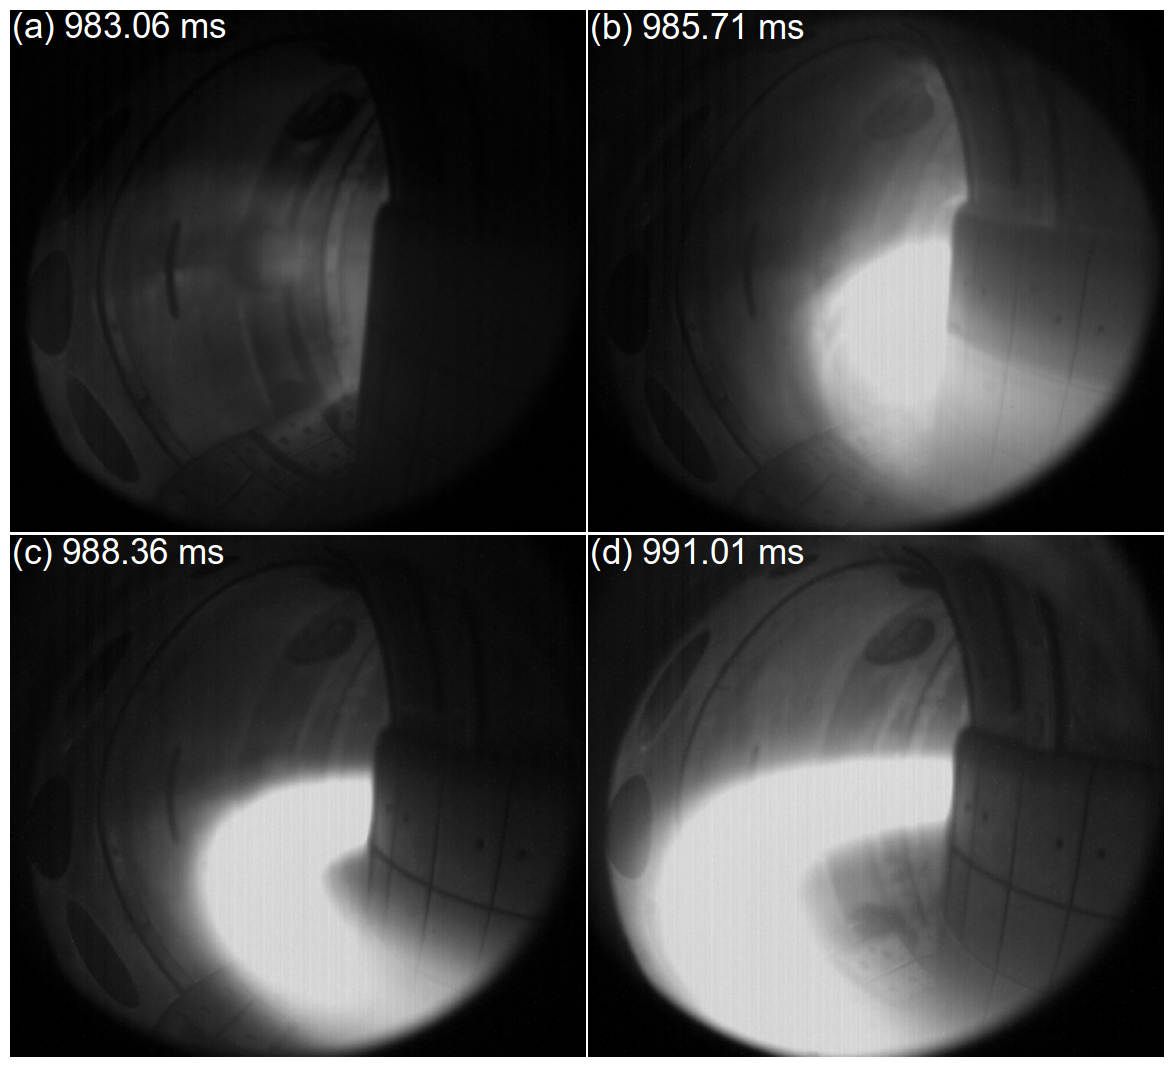
Supplementary to the previous description of the RE plateau, the observation of RE beam with visible camera is displayed in Fig.3 for discharge #8585. The creation and localisation of the beam are well visible.
3 Results
Out of 137 discharges performed during the COMPASS RE campaign, Ar puff was used in 39 discharges where only 5 discharges ended in spontaneous disruption. Out of the 39 discharges, 14 had the RE plateau after the Ar puff, while 9 resulted in slow radiative decay, similar to a ramp-down. The remaining 11 discharges ended in a typical COMPASS disruption, i.e. without any RE.
Based on these observations, all discharges with the Ar puff can be classified as:
-
1.
STRONG (RE plateau) - kA
-
2.
WEAK (RE plateau) - kA
-
3.
SLOW (radiative current decay) - plasma current slowly decreases in the similar manner as a ramp-down phase
-
4.
ZERO (RE plateau) - “typical” disruption for COMPASS with no RE remaining or generated after the disruption
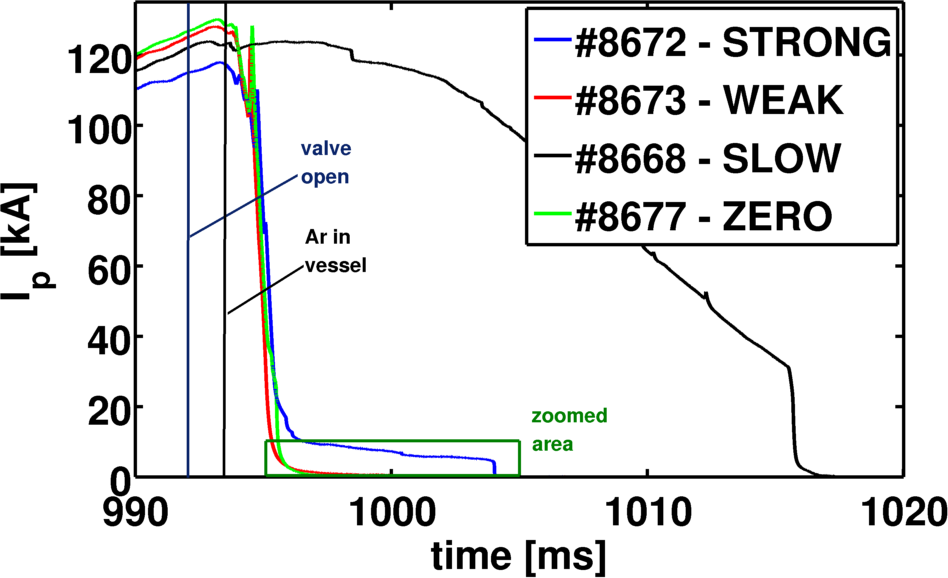
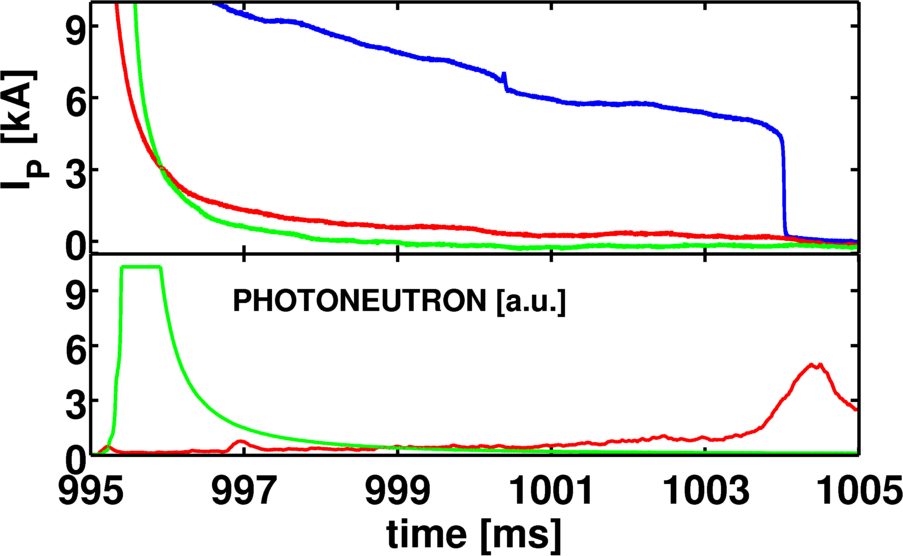
An example of each class is shown in Fig. 4, where Fig. 4(b) is a zoom of Fig. 4(a) to emphasize the difference between weak and zero plateau measurements. Although these two cases could seem identical at the first sight, the PN signal confirms release of the RE after the disruption in the weak case (b) and their loss during the disruption in the zero case (d). This classification is very important, as it will be used from now on throughout the paper. We shall now present the main results of the RE COMPASS campaign.
First, we have estimated the typical maximum runaway energy for the analyzed discharges to be MeV by taking into account the electron acceleration due to electric field with the synchrotron radiation losses only, as suggested in Martín-Solís et al. (2010); Yu et al. (2013).
Second, since the RE before or during the disruption are more likely to be produced in the hottest center of the plasma Gill et al. (2002), the remaining and newly produced post-disruptive RE may have more peaked radial current profile than the pre-disruption profile. The peaking represents localisation of the plasma current around the magnetic axis and can be expressed through the internal inductance , which is calculated by the EFIT reconstruction Havlíček & Hronová (2010) at COMPASS. It was observed that the value increases by only 5-45% in comparison to measurements on JET Loarte et al. (2011). In addition to the modest rise, the normalised plasma pressure rises above for the same discharges and thus confirms that the overestimated as seen by EFIT Vlainić et al. (2014) is caused by the presence of RE.
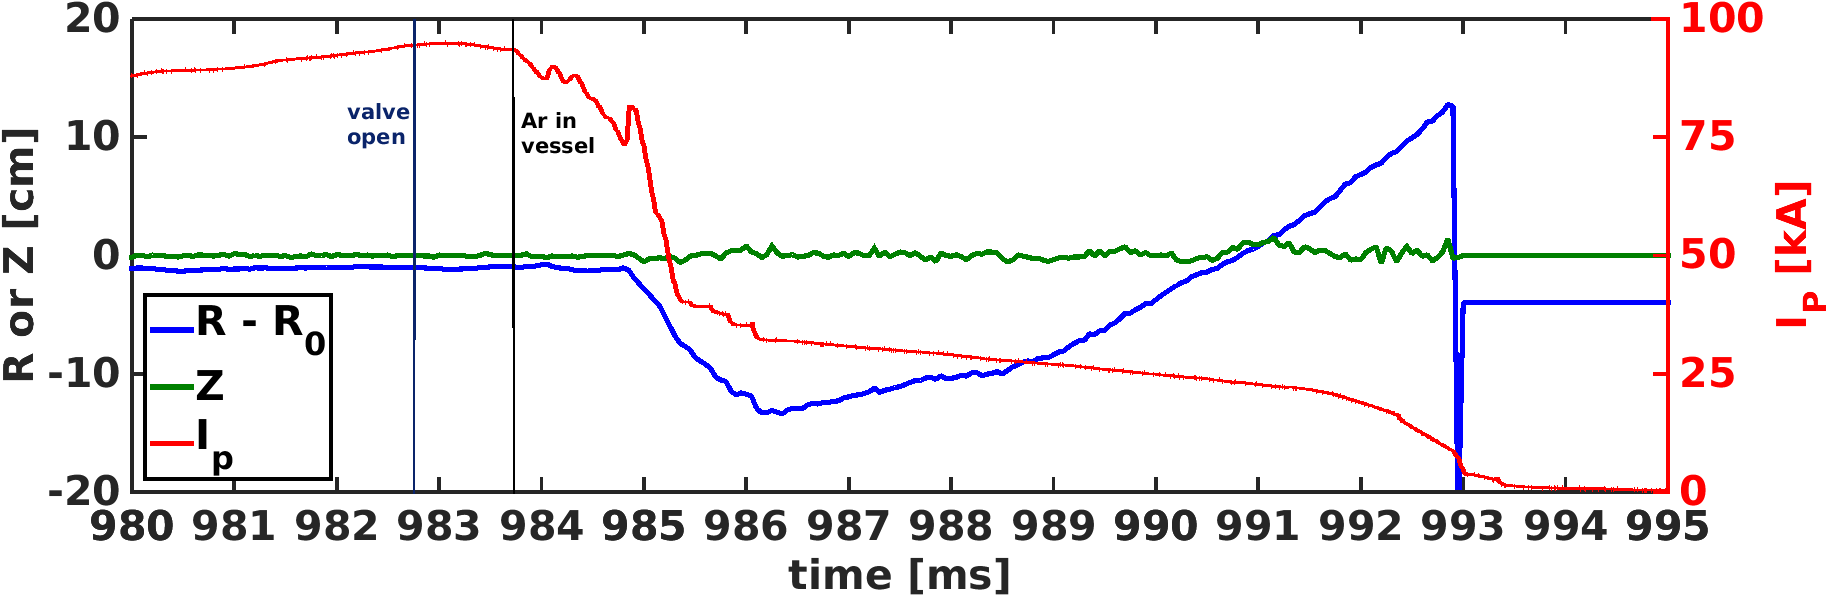
The inward motion (towards the HFS wall, negative values in Fig. 5) of the post-disruptive plasma, followed by its return towards the vessel center is in agreement with the TFTR Fredrickson et al. (2015) and Tore Supra Saint-Laurent et al. (2009) observations. However, TFTR and Tore Supra feedback systems were able to stabilise the runaway beam, while presently in COMPASS the beam continues to shift outwards until its termination, as shown in Fig. 5. Note that the outward shift is also visible in Fig. 3. The vertical plasma position for the majority of cases is rather stable (an example being given in Fig. 5), only in a few discharges some downward shifts were noticed.
3.1 Disruption Generated by Argon
As already mentioned, a solenoid valve was used to inject Ar gas into the plasma. Even though two different pressures were used ( and bar), no particular differences in runaway beam parameters were identified. The reason could be that the pressure was only varied by a factor of 2.
In devices larger than COMPASS, high-Z gas injection is used to trigger fast CQ in order to improve runaway generation Reux et al. (2014). The plasma current quench rate :
| (2) |
is the quantifying parameter for the CQ speed. The calculation of values for disruptions with and without Ar puff was performed. No particular differences were observed between the discharges, as the majority of the values are between s-1 in both cases. The values implicate that the whole pre-disruptive is lost in ms, which is the order of magnitude of the electromagnetic field penetration time of the COMPASS vacuum vessel ( ms).
3.2 Parametrisation of Runaway Plateau
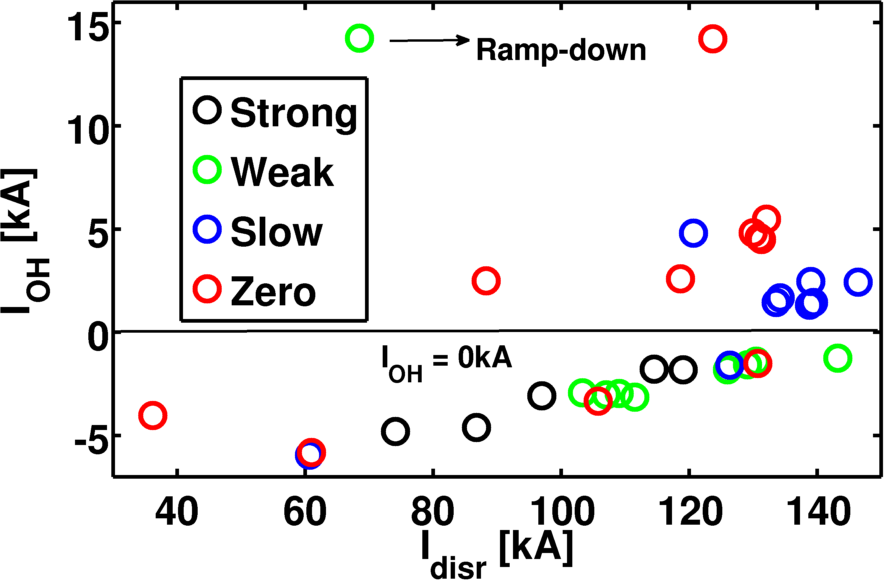
The ohmic heating (OH) central solenoid current - called MFPS in Havlíček & Hronová (2008) - will be used to indicate on the appearence time of the runaway plateau. For the RE discharges analyzed in the article is negative during the current ramp-up phase followed by at zero value for few milliseconds during the transition towards the current flat-top phase. For the rest of the discharge, i.e. current flat-top and ramp-down, it becomes positive and controlled by the feedback system Janky et al. (2014). In Fig. 6, ms before TQ is plotted versus also taken ms before the TQ and denoted as . The reason why exactly ms are taken will be seen later in this section, but it can be explained as the time before Ar starts to cool down the plasma, displayed in Fig. 4(a). Also, later in the article, the measured parameters denoted with the index (e.g. and ) are taken at the same time.
Fig. 6 shows that only one weak plateau out of 14 plateau discharges did not appear during the ramp-up phase, but during the ramp-down phase. Hence, RE plateaus are more likely to be produced during the current ramp-up phase than during the flat-top. The ramp-down case requires further investigation in future experiments, as only one such discharge was observed.
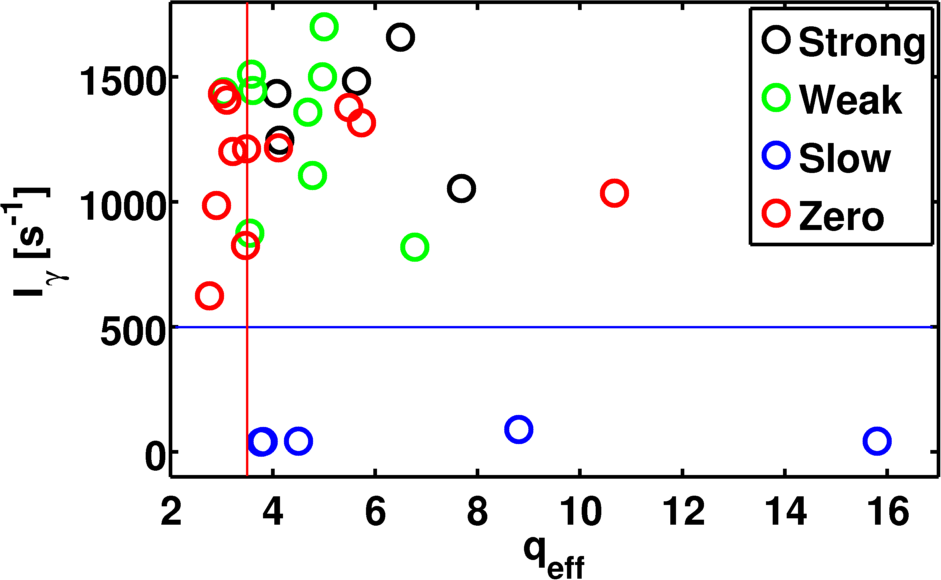
Yoshino et al. (1999) did the first detailed parametrisation of disruptions with runaway occurence in JT-60U tokamak. According to his article, study of versus is important for the plateau occurrence, where the effective edge safety factor for circular plasma is defined as:
| (3) |
The internal inductance and the poloidal beta are taken from the EFIT reconstruction at the closest moment from the disruption. is already defined in Eq. 2. Fig. 7 shows versus for the case of COMPASS. For all plateaus except the slow ones, is between and s-1 and is between and . It is interesting to observe how majority of the zero disruptions are under . Obviously, slow disruptions have significantly slower current decay than the rest of the discharges, their values are under s-1.
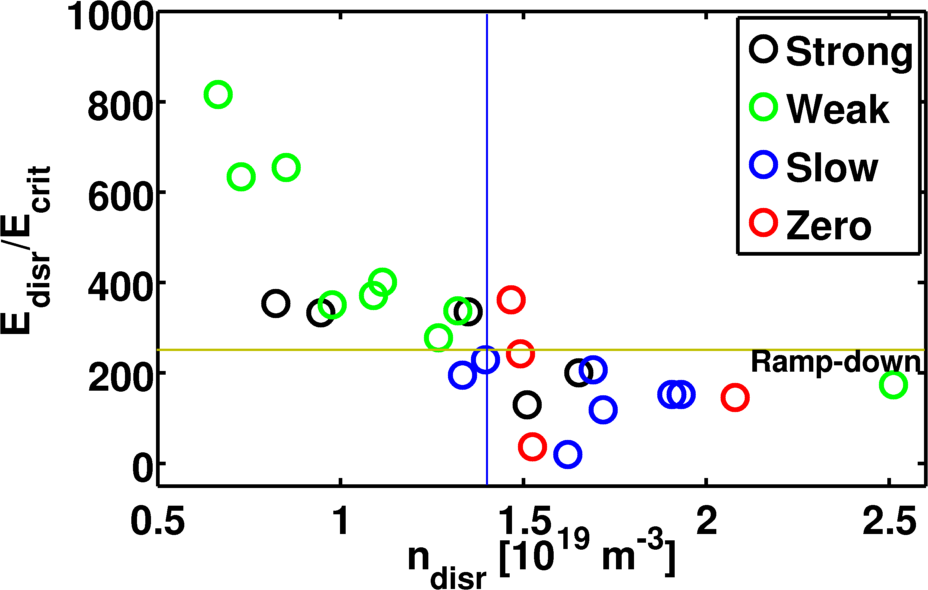
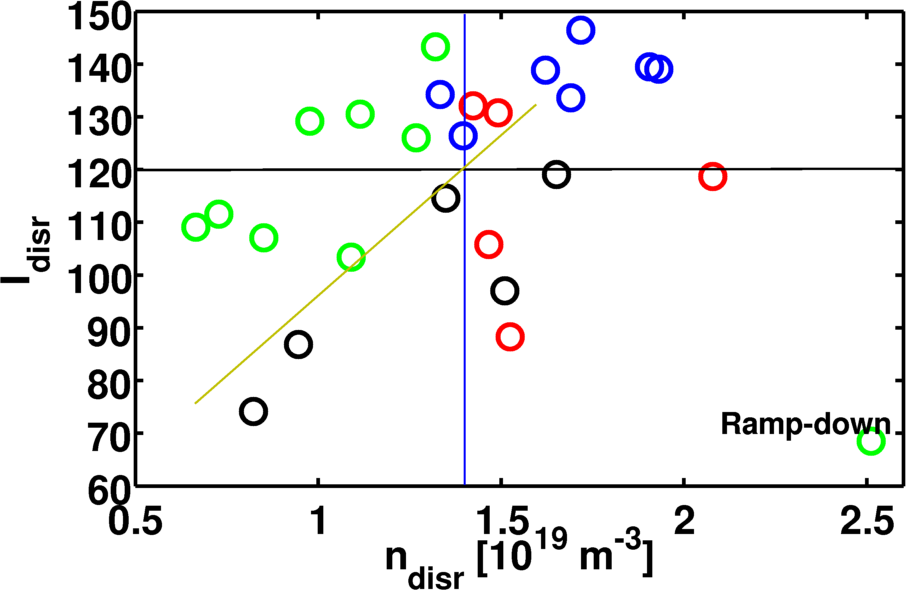
According to the theory the production of the RE is more intense for lower densities. Thus, normalised to and are plotted as a function of the line averaged density measured by the interferometer in Fig. 8. Approximately, the critical value of electron density for obtaining the runaway plateau seems to be m-3. The ratio represents the relative strength of . Critical value of the ratio on Fig. 8(a) is around for the analyzed discharges. Figure 8(b) shows that the strong plateaus are created for lower value than weak plateaus, taking the same value. In addition, no strong plateau is observed above kA, while half of the weak ones have above kA.
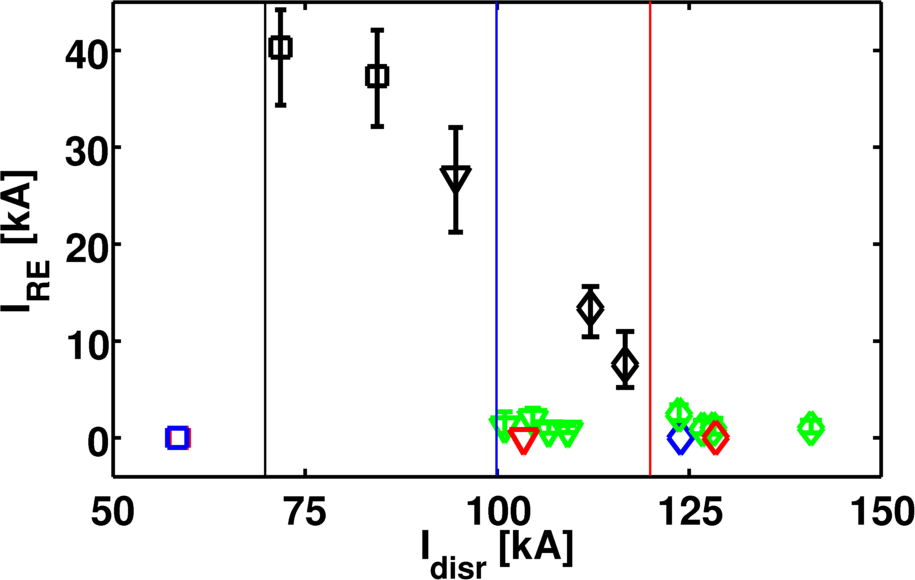
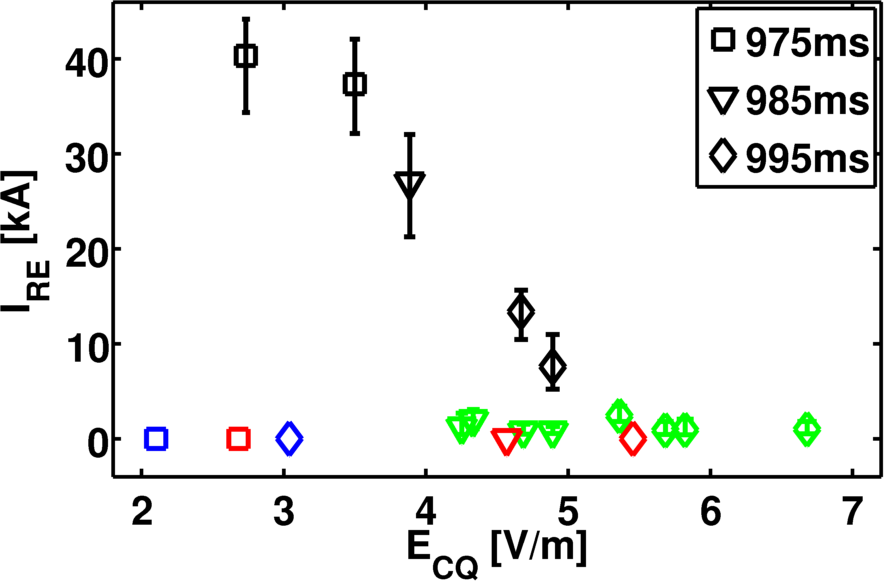
Another parameter of interest is the current carried by the RE beam . The dependence of on the is shown in Fig. 9(a), where only the ramp-up Ar MGI discharges are presented. The discharges in Fig. 9 are grouped by the time of Ar puff. Typical weak plateau is between kA, while for strong plateaus decreases with and time of the puff. Furthermore, for the Ar injections performed at ms and ms the upper limit of the is indicated, namely kA and kA respectively. For values lower than these values strong plateau seems to be produced, while above either weak plateau or no plateau occurred. In contrast to this, for the Ar injection at ms the lower limit of is observed for about kA, under which no plateau was detected. Anyway, more statistics are required. The dependence of on the maximum electric field during the current quench (Fig. 9(b)) has similar behavior like in Fig. 9(a), as one could expect from the self-inductance effect between and .
4 Discussion
Even though the number of discharges devoted to runaway plateau studies was limited on COMPASS in the dedicated RE campaign, it was still possible to do comparative analyses. The results presented in the previous section are discussed in following order:
-
•
general characteristics on RE are outlined
-
•
observed differences between discharges with and without the runaway plateau are reported
-
•
issues on obtaining the RE plateau with Ar puff are discussed
-
•
achieving strong plateau is commented
In Loarte et al. (2011), an increase of by factor of 2 to 3 has been reported for the RE plateau, which is significantly larger then the modest rise observed in COMPASS (0.05-0.45). This modest rise could mean that RE seeds generated during the ramp-up phase are occuring in larger relative area than for the case of JET. Similarly to Tore Supra Saint-Laurent et al. (2009), JET Loarte et al. (2011) and TFTR Fredrickson et al. (2015), the inward motion of the RE beam is observed for the beginning of the plateau phase at COMPASS.
Almost all (13 out of 14) generated RE plateaus were achieved for Ar puff in the ramp-up current phase, as for Tore Supra Saint-Laurent et al. (2011). Regarding disruptions itself, the CQ speed is one order of magnitude larger than for the case of JT-60U Yoshino et al. (1999), where s-1 was reported as the plateau formation condition. Concluding that COMPASS has fast enough disruption for the plateau formation (see Fig. 7), but other factors - e.g. , , avalanching Rosenbluth & Putvinski (1997) - are not fulfilled, explaining why the Ar MGI is necessary for COMPASS to obtain the runaway plateau.
Next, and its relation with is one more important plasma characteristics for the plateau creation. In the case of JT-60U Yoshino et al. (1999), on top of the condition, has to be over . From Fig. 7 it is obvious that disruptions analyzed here are deep in the reported parameter region. However, there is an indication how the plateau condition for and in COMPASS could be different from those observed in JT-60U. Anyhow, this is still to be investigated by enhancing the statistics.
As observed from Fig. 8(a), the limiting for plateau to appear is around m-3, which corresponds to Vm. The Dreicer mechanism is the most probable source of the post-disruptive production of RE at COMPASS, because the avalanching is expected to be important for the tokamaks with MA Rosenbluth & Putvinski (1997). However, from Fig. 8(a) it is apparent how the strong plateaus are obtained for low values compare to the weak plateaus. This observation, at the first sight contra-intuitive, could be explained with the appearance of the avalanching effect, as avalanching is dominant runaway generation mechanism for lower assuming that the electron temperature profile remains unchanged (see Nilsson et al., 2015, Fig. 10). Anyhow, this possibilty is still to be investigated. The Dreicer field is currently difficult to determine as the Ar injections were often too early, so that no Thomson scattering data were collected yet. For the cases plotted in Fig. 8(b), it seems that lower densities are necessary in order to achieve plateau for above kA, making important parameter for the plateau production.
In the COMPASS case, it seems that the inverse dependence is recognised for the strong plateaus (Fig. 9(a)). The dependence of on from Fig. 9(b) looks almost the same as the one from Fig. 9(a), as one would expect. This observation comes from the fact that the amplitude of induced during the CQ is directly proportional to the before the disruption. Lower and upper boundary signs of plasma current for strong plateaus from Fig. 9(b) are not unique, these boundaries have been observed in JET by Gill et al. (2002). In this article, the lower limit is assigned to low , while the upper limit is possibly connected to magnetic fluctuations. For COMPASS more discharges would be required to improve the statistics and find the two limits.
5 Conclusion and Future Work
Before this dedicated campaign, runaway plateau was never observed in COMPASS. As a matter of fact, there was scepticism concerning the possible plateau occurrence for any plasma condition, due to the COMPASS tokamak size, low and the low plasma currents leading to relatively low electric field during the disruption. Nevertheless, in this paper a clear demonstration of obtaining runaway plateau by MGI is reported. The RE plateau currents varied between to kA, with duration from to ms.
Argon injection disrupted discharges in COMPASS have been investigated in order to clarify the necessary conditions for runaway plateau production. It was found that the easiest way to produce the RE plateau was to inject Ar during the ramp-up of the plasma current. Furthermore, the typical COMPASS disruptions without RE can satisfy various parameters important for the runaway plateau creation (e.g. , , , ) without Ar injection, thus high-Z MGI is probably required only for activating thermal quench to enhance runaway population. Unusually, for the discharges considered in the paper, it seems that the plateau generation also depends on plasma current during the Ar puff injection. Even though, the CQ after MGI induced disruption has a very short time, it is possible that avalanche mechanism is present in COMPASS during the runaway plateau formation.
More experiments need to be done in order to draw final conclusions on the definite conditions for the runaway plateau generation in COMPASS tokamak. From present knowledge we can conclude that some observations correspond to reports from larger tokamaks, although the amplitude is sometimes different. Indeed, this difference in the magnitudes could be important for scaling towards ITER.
The experiment presented here confirm that COMPASS is a tokamak suitable for various ITER-relevant runaway studies, such as:
- 1.
-
2.
improvements of the runaway beam mitigation
-
3.
testing the runaway control system
-
4.
benchmarking of the runaway models
Nonetheless, the scenario for inducing the runaway plateau is necessary before further ITER-relevant studies are performed. Presently, LUKE Decker & Peysson (2004) code is being used in collaboration with CEA for a better understanding of the physics behind the measurements.
The “Joint Doctoral Programme in Nuclear Fusion Science and Engineering” is acknowledged by the first author for supporting the studies. Next to thank is the project MSMT LM2011021 from which the COMPASS operation is supported. Then, the authors would like to acknowledge work of the WP14-MST2-9 research project team. The first author would like to thank to Francois Saint-Laurent for advising and sharing his experience with us, Jozef Varju for installing the injection system and Josef Havlíček and Michael Komm for fruitful discussions. Faculty of Nuclear Sciences and Physical Engineering (Czech Technical University) is also appreciated for lending us the HXR detectors.
This work has been carried out within the framework of the EUROfusion Consortium and has received funding from the Euratom research and training programme 2014-2018 under grant agreement No 633053. The views and opinions expressed herein do not necessarily reflect those of the European Commission.
References
- Connor & Hastie (1975) Connor, J.W. & Hastie, R.J. 1975 Relativistic limitations on runaway electrons. Nuclear Fusion 15 (3), 415.
- Decker & Peysson (2004) Decker, J. & Peysson, Y. 2004 DKE: A fast numerical solver for the 3-D relativistic bounce-averaged electron drift kinetic equation. Technical report EUR-CEA-FC-1736. Plasma science and fusion center, MIT.
- Dreicer (1959) Dreicer, H. 1959 Electron and ion runaway in a fully ionized gas. I. Phys. Rev. 115, 238–249.
- Dreicer (1960) Dreicer, H. 1960 Electron and ion runaway in a fully ionized gas. II. Phys. Rev. 117, 329–342.
- Esposito et al. (2003) Esposito, B., Martín-Solís, J. R., Poli, F. M., Mier, J. A., Sánchez, R. & Panaccione, L. 2003 Dynamics of high energy runaway electrons in the Frascati Tokamak Upgrade. Physics of Plasmas (1994-present) 10 (6).
- Fredrickson et al. (2015) Fredrickson, E.D., Bell, M.G., Taylor, G. & Medley, S.S. 2015 Control of disruption-generated runaway plasmas in TFTR. Nuclear Fusion 55 (1), 013006.
- Gill et al. (2002) Gill, R.D., Alper, B., de Baar, M., Hender, T.C., Johnson, M.F., Riccardo, V. & contributors to the EFDA-JET Workprogramme 2002 Behaviour of disruption generated runaways in JET. Nuclear Fusion 42 (8), 1039.
- Gill et al. (2000) Gill, R. D., Alper, B., Edwards, A. W., Ingesson, L. C., Johnson, M. F. & Ward, D. J. 2000 Direct observations of runaway electrons during disruptions in the JET tokamak. Nuclear Fusion 40 (2), 163.
- Havlíček & Hronová (2008) Havlíček, J. & Hronová, O. 2008 Characterization of magnetic fields in the COMPASS tokamak. In WDS’08 Proceedings of Contributed Papers. Prague, Czech Republic: Charles University.
- Havlíček & Hronová (2010) Havlíček, J. & Hronová, O. 2010 Magnetic diagnostics of COMPASS tokamak: http://www.ipp.cas.cz/tokamak/euratom/index.php/en/compass-diagnostics/magnetic-diagnostics.
- Hender et al. (2007) Hender, T.C., Wesley, J.C, Bialek, J., Bondeson, A., Boozer, A.H., Buttery, R.J., Garofalo, A., Goodman, T.P, Granetz, R.S., Gribov, Y., Gruber, O., Gryaznevich, M., Giruzzi, G., Günter, S., Hayashi, N., Helander, P., Hegna, C.C., Howell, D.F., Humphreys, D.A., Huysmans, G.T.A., Hyatt, A.W., Isayama, A., Jardin, S.C., Kawano, Y., Kellman, A., Kessel, C., Koslowski, H.R., Haye, R.J. La, Lazzaro, E., Liu, Y.Q., Lukash, V., Manickam, J., Medvedev, S., Mertens, V., Mirnov, S.V., Nakamura, Y., Navratil, G., Okabayashi, M., Ozeki, T., Paccagnella, R., Pautasso, G., Porcelli, F., Pustovitov, V.D., Riccardo, V., Sato, M., Sauter, O., Schaffer, M.J., Shimada, M., Sonato, P., Strait, E.J., Sugihara, M., Takechi, M., Turnbull, A.D., Westerhof, E., Whyte, D.G., Yoshino, R., Zohm, H., the ITPA MHD, Disruption & Group, Magnetic Control Topical 2007 Chapter 3: MHD stability, operational limits and disruptions. Nuclear Fusion 47 (6), S128.
- Hollmann et al. (2013) Hollmann, E. M., Austin, M. E., Boedo, J. A., Brooks, N. H., Commaux, N., Eidietis, N. W., Humphreys, D. A., Izzo, V. A., James, A. N., Jernigan, T. C., Loarte, A., Martín-Solís, J. R., Moyer, R. A., ooz Burgos, J. M. Mu Parks, P.B., Rudakov, D.L., Strait, E. J., Tsui, C., Zeeland, M. A. Van, Wesley, J. C. & Yu, J. H. 2013 Control and dissipation of runaway electron beams created during rapid shutdown experiments in DIII-D. Nuclear Fusion 53 (8), 083004.
- Janky et al. (2014) Janky, F., Havlicek, J., Batista, A.J.N., Kudlacek, O., Seidl, J., Neto, A.C., Pipek, J., Hron, M., Mikulin, O., Duarte, A.S., Carvalho, B.B., Stockel, J. & Panek, R. 2014 Upgrade of the COMPASS tokamak real-time control system. Fusion Engineering and Design 89 (3), 186 – 194, Design and implementation of real-time systems for magnetic confined fusion devices.
- Loarte et al. (2011) Loarte, A., Riccardo, V., Martín-Solís, J.R., Paley, J., Huber, A., Lehnen, M. & Contributors, JET EFDA 2011 Magnetic energy flows during the current quench and termination of disruptions with runaway current plateau formation in JET and implications for ITER. Nuclear Fusion 51 (7), 073004.
- Martin et al. (1995) Martin, G., Chatelier, M. & Doloc, C. 1995 New insight into runaway electrons production and confinement. In 22nd EPS Conference on Plasma Physics. Bournemouth, United Kingdom: Plasma Physics and Controlled Fusion.
- Martín-Solís et al. (2014) Martín-Solís, J. R., Loarte, A., Hollmann, E. M., Esposito, B., Riccardo, V., FTU, Teams, DIII-D & Contributors, JET EFDA 2014 Inter-machine comparison of the termination phase and energy conversion in tokamak disruptions with runaway current plateau formation and implications for ITER. Nuclear Fusion 54 (8), 083027.
- Martín-Solís et al. (2010) Martín-Solís, J. R., Sánchez, R. & Esposito, B. 2010 Experimental observation of increased threshold electric field for runaway generation due to synchrotron radiation losses in the FTU tokamak. Phys. Rev. Lett. 105, 185002.
- Nilsson et al. (2015) Nilsson, E., Decker, J., Peysson, Y., Granetz, R.S, Saint-Laurent, F. & Vlainić, M. 2015 Kinetic modelling of runaway electron avalanches in tokamak plasmas. Plasma Physics and Controlled Fusion Status: To Be Submitted.
- Pánek et al. (2006) Pánek, R., Bilyková, O., Fuchs, V., Hron, M., Chráska, P., Pavlo, P., Stöckel, J., Urban, J., Weinzettl, V., Zajac, J. & Žáček, F. 2006 Reinstallation of the COMPASS-D tokamak in IPP ASCR. Czechoslovak Journal of Physics 56 (2), B125–B137.
- Papřok et al. (2013) Papřok, R., Krlín, L. & Stöckel, J. 2013 Observation and prediction of runaway electrons in the COMPASS tokamak. In WDS’13 Proceedings of Contributed Papers. Prague, Czech Republic: Charles University.
- Reux et al. (2014) Reux, C., Plyusnin, V., Alper, B., Alves, D., Bazylev, B., Belonohy, E., Brezinsek, S., Decker, J., Devaux, S., de Vries, P., Fil, A., Gerasimov, S., Lupelli, I., Jachmich, S., Khilkevitch, E.M., Kiptily, V., Koslowski, R., Kruezi, U., Lehnen, M., Manzanares, A., Mlynář, J., Nardon, E., Nilsson, E., Riccardo, V., Saint-Laurent, F., Shevelev, A.E., Sozzi, C. & contributors, JET EFDA 2014 Runaway beam studies during disruptions at JET-ILW. In 21st International Conference on Plasma Surface Interactions. Kanazawa, Japan: Journal of Nuclear Materials.
- Rosenbluth & Putvinski (1997) Rosenbluth, M.N. & Putvinski, S.V. 1997 Theory for avalanche of runaway electrons in tokamaks. Nuclear Fusion 37 (10), 1355.
- Saint-Laurent et al. (2011) Saint-Laurent, F., Bucalossi, J., Reux, C., Bremond, S., Douai, D., Gil, C. & Moreau, P. 2011 Control of runaway electron beam heat loads on Tore Supra. In 38th EPS Conference on Plasma Physics. Strasbourg, France: Plasma Physics and Controlled Fusion.
- Saint-Laurent et al. (2009) Saint-Laurent, F., Reux, C., Bucalossi, J., Loarte, A., Bremond, S., Gil, C. & Moreau, P. 2009 Control of runaway electron beams on Tore Supra. In 36th EPS Conference on Plasma Physics. Sofia, Bulgaria: Plasma Physics and Controlled Fusion.
- Smith & Verwichte (2008) Smith, H. M. & Verwichte, E. 2008 Hot tail runaway electron generation in tokamak disruptions. Physics of Plasmas (1994-present) 15 (7), 072502.
- Vlainić et al. (2014) Vlainić, M., Mlynář, J., Weinzettl, V., Papřok, R., Imrísek, M., Ficker, O., Vondráček, P. & Havlíček, J. 2014 First dedicated observations of runaway electrons in COMPASS tokamak. Nukleonika Status: Sumbitted For Publication.
- Yoshino et al. (1999) Yoshino, R., Tokuda, S. & Kawano, Y. 1999 Generation and termination of runaway electrons at major disruptions in JT-60U. Nuclear Fusion 39 (2), 151.
- Yu et al. (2013) Yu, J. H., Hollmann, E. M., Commaux, N., Eidietis, N. W., Humphreys, D. A., James, A. N., Jernigan, T. C. & Moyer, R. A. 2013 Visible imaging and spectroscopy of disruption runaway electrons in DIII-D. Physics of Plasmas (1994-present) 20 (4), 042113.