Effects of deformation on the beta-decay patterns of light even-even and odd-mass Hg and Pt isotopes
Abstract
Bulk and decay properties, including deformation energy curves, charge mean square radii, Gamow-Teller (GT) strength distributions, and -decay half-lives, are studied in neutron-deficient even-even and odd- Hg and Pt isotopes. The nuclear structure is described microscopically from deformed quasiparticle random-phase approximation calculations with residual interactions in both particle-hole and particle-particle channels, performed on top of a self-consistent deformed quasiparticle Skyrme Hartree-Fock basis. The observed sensitivity of the, not yet measured, GT strength distributions to deformation is proposed as an additional complementary signature of the nuclear shape. The -decay half-lives resulting from these distributions are compared to experiment to demonstrate the ability of the method.
pacs:
PACS: 21.60.Jz, 23.40.-s, 27.70.+q, 27.80.+wI Introduction
Neutron-deficient isotopes in the lead region are nowadays well established examples of the shape coexistence phenomenon in nuclei heyde11 ; julin01 . They have been subject of much experimental and theoretical interest in the last years. The first direct evidence of the shape coexistence in the region was obtained in neutron-deficient Hg isotopes from isotope shift measurements bonn72 . Those measurements showed a sharp transition in the nuclear size between the ground states of 187Hg and 185Hg that was interpreted frauendorf75 as a change from a weak oblate shape in the heavier isotopes to a more deformed prolate shape in the lighter ones from calculations based on Strutinsky’s shell correction method. Later, new isotope shift measurements ulm86 revealed a weakly oblate deformed character of the ground states of the even-mass Hg isotopes down to , with an odd-even staggering persisting down to 181Hg. The radius of the oblate isomeric state in 185Hg follows the trend of the even-even ground-state radii.
Shape evolution and shape coexistence in the region of -unstable nuclei with were subsequently studied experimentally by -ray spectroscopy in the -decay of the products created in fusion-evaporation reactions (see Ref. julin01 and references therein). Maybe, the most singular case corresponds to 186Pb, where two excited states below 700 keV andreyev00 have been found. Furthermore, low-lying excited states have been experimentally observed at excitation energies below 1 MeV julin01 ; andreyev00 in all even Pb isotopes between and . Similarly, excited states below 1 MeV have been found in neutron-deficient Hg isotopes from up to julin01 .
The spectroscopy of the Hg isotopes julin01 ; hannachi ; lane95 shows a nearly constant behavior of the energy of the yrast states in the range , which are interpreted as members of a rotational band on top of a weakly deformed oblate ground state. For lighter isotopes, excited states appear at low energies, decreasing in excitation energy up to . They are interpreted as the band-heads of prolate configurations. Their excited states become yrast above for , whereas the levels become close enough in energy to the weakly deformed states, opening the possibility of mixing strongly with them. Nevertheless, to determine the magnitude and type of deformation of the bands and their mixing, spectroscopy studies are not enough and the electromagnetic properties (E2 transition strengths) of the low-lying states have to be determined. Lifetime measurements in neutron-deficient Hg isotopes have been performed in the last years grahn09 ; scheck10 ; gaffney14 . More recently bree14 , Coulomb-excitation experiments have been performed to study the electromagnetic properties of light Hg isotopes 182-188Hg. In these experiments, the deformation of the ground state and low-lying excited states were deduced, confirming the presence of two different coexisting structures in the light even-even Hg isotopes that are pure at higher spin values and mix at low excitation energy. The ground states of Hg isotopes in the mass range are found to be weakly deformed and of predominantly oblate nature, while the excited states in 182,184Hg exhibit a larger deformation. Similarly, low-lying states in light Pt isotopes have been studied experimentally with -ray spectroscopy cederwall90 ; dracoulis91 ; davidson99 , showing that shape coexistence of states with different deformation is still present in neutron-deficient Pt isotopes with . Moderate odd-even staggering was also found in very light Pt isotopes from laser spectroscopy leblanc99 .
From the theoretical point of view different types of models have been used to explain the coexistence of several states at low energies heyde11 . In a shell model picture, the excited states are interpreted as multi particle-hole excitations. Protons and neutrons outside the inert core interact through pairing and quadrupole interactions to generate deformed structures. Within a mean-field description of the nuclear structure, the presence of several minima at low energies in the energy surface, corresponding to different states, is understood as due to the coexistence of various collective nuclear shapes. In the mean-field approach, the energy of the different shape configurations can be evaluated with constrained calculations, minimizing the Hartree-Fock energy under the constraint of keeping fixed the nuclear deformation. The resulting total energy plots versus deformation are called in what follows deformation-energy curves (DEC). These calculations have become more and more refined with time, resulting in accurate descriptions of the nuclear shapes and the configurations involved. Calculations based on phenomenological mean fields and Strutinsky method bengtsson , are already able to predict the existence of several competing minima in the deformation-energy surface of neutron-deficient Pt, Hg, and Pb isotopes. Self-consistent mean-field calculations with non-relativistic Skyrme bender04 ; yao13 and Gogny delaroche ; libert ; egido ; rayner10 , as well as relativistic niksic02 energy density functionals have been carried out. Inclusion of correlations beyond mean field bender04 ; yao13 ; delaroche ; libert ; egido ; rayner10 are needed to obtain a detailed description of the spectroscopy. They involve symmetry restoration by means of angular momentum and particle number projection and configuration mixing within a generator coordinate method. It is shown that the underlying mean field picture of coexisting shapes is in general supported, except in those cases where the deformed mean-field structures appear at close energies. In this case mixing can be important, affecting B(E2) strengths and their corresponding deformation parameters. The basic picture is also confirmed from recent calculations within the interacting boson model with configuration mixing carried out for Hg nomura13 ; gramos14hg and Pt morales08 ; gramos09 ; gramos11 ; gramos14pt isotopes.
Triaxiality in this mass region has also been explored systematically yao13 ; rayner10 ; nomura13 ; gramos14pt ; nomura11 , showing that although the axial deformations seem to be the basic ingredients, triaxiality may play a role in some cases. A systematic survey of energy surfaces in the plane with the Gogny D1S interaction can be found in the Bruyères-le-Châtel database web_Gogny .
On the other hand, it has been shown frisk95 ; sarri98 ; sarri99 that the decay properties of -unstable nuclei may depend on the nuclear shape of the decaying nucleus. In particular, the Gamow-Teller (GT) strength distributions corresponding to /EC-decay of proton-rich nuclei in the mass region have been studied systematically sarri01prc ; sarri01npa ; sarri05epja ; sarri09 as a function of the deformation, using a deformed quasiparticle random-phase approximation (QRPA) approach built on a self-consistent Hartree-Fock (HF) mean field with Skyrme forces and pairing correlations. The study has also been extended to stable -shell nuclei sarri03 ; sarri13 and to neutron-rich nuclei in the mass region sarri_pere . This sensitivity of the GT strength distributions to deformation has been exploited to determine the nuclear shape in neutron-deficient Kr and Sr isotopes by comparing theoretical results with -decay measurements using the total absorption spectroscopy technique (TAS) isolde .
Similar studies for the decay properties of even-even neutron-deficient Pb, Po, and Hg isotopes were initiated in Refs. sarri05prc ; moreno06 to predict the extent to which GT strength distributions may be used as fingerprints of the nuclear shapes in this mass region. In those works, it was shown that the existence of shape isomers, as well as the location of their equilibrium deformations, are rather stable and independent on the Skyrme and pairing forces. It was also found that the GT strength distributions calculated at the various equilibrium deformations exhibit specific features that can be used as signatures of the shape isomers and, what is important, these features remain basically unaltered against changes in the Skyrme and pairing forces.
In this paper we extend those calculations by studying the DECs and the GT strength distributions of neutron-deficient 174-204Hg and 170-192Pt isotopes, focusing on their dependence on deformation. In addition, we also include as a novelty the decay properties of the odd- isotopes and discuss the sensitivity of the decay patterns to the spin-parity of the decaying nucleus. The aim here is to identify possible signatures of the shape of the nucleus in the decay patterns. This study is timely because the possibility to carry out these measurements in odd- nuclei is being considered at present at ISOLDE/CERN algora . A program aiming to measure the Gamow-Teller strength distributions in neutron-deficient isotopes in the lead region with TAS techniques started with 188,190,192Pb isotopes. These data have been already analyzed and submitted for publication submitted ; thesis . Similar measurements have been carried out in 182,183,184,186Hg and are being presently analyzed algora .
The paper is organized as follows. In Sec. II we present briefly the main features of our theoretical framework. Section III contains our results for the energy deformation curves and GT strength distributions in the neutron-deficient Hg and Pt isotopes relevant for /EC-decay. We also compare the experimental half-lives with our results and discuss the GT strength distributions and their sums in various ranges of excitation energies. Section IV contains the main conclusions.
II Theoretical Formalism
In this section we present a summary of the theoretical formalism used in this paper to describe the -decay properties in Hg and Pt neutron-deficient isotopes. More details of the microscopic calculations can be found in Refs. sarri98 ; sarri99 ; sarri01prc ; sarri01npa . The method starts with a self-consistent calculation based on a deformed Hartree-Fock mean field obtained with effective two-body density-dependent Skyrme interactions including pairing correlations in BCS approximation. From these calculations we obtain energies, occupation probabilities and wave functions of the single-particle states. Most of the calculations in this work have been performed with the interaction SLy4 sly4 , being among the most successful and extensively studied Skyrme force in the last years bender08 ; bender09 ; stoitsov . Furthermore, comparison with other widely used Skyrme forces like the simpler Sk3 sk3 and SGII sg2 that has been shown to provide good spin-isospin properties, will be shown in some instances.
The solution of the HF equation is found by using the formalism developed in Ref. vautherin , assuming time reversal and axial symmetry. The single-particle wave functions are expanded in terms of the eigenstates of an axially symmetric harmonic oscillator in cylindrical coordinates, using twelve major shells. The method also includes pairing between like nucleons in BCS approximation with fixed gap parameters for protons and neutrons, which are determined phenomenologically from the odd-even mass differences through a symmetric five-term formula involving the experimental binding energies audi12 . In those cases where experimental information for masses is still not available, same pairing gaps as the closer isotope measured are used.
The DECs are analyzed as a function of the quadrupole deformation parameter from constrained HF calculations. Calculations for GT strengths are performed subsequently at the equilibrium shapes of each nucleus, that is, for the solutions (in general deformed) for which minima are obtained in the energy curves.
It is worth mentioning some existing works in this mass region based on mean-field approaches other than the present Skyrme HF+BCS calculations. In particular, mean-field studies of structural changes with the Gogny interaction can be found in Ref. nomura13 for Hg isotopes and in Refs. rayner10 ; gramos14pt ; nomura11 for Pt isotopes. The clear advantage of the finite-range Gogny force over the contact Skyrme force is that pairing correlations can be treated self-consistently using the same interaction through a Hartree-Fock-Bogoliubov (HFB) calculation. Triaxial landscapes were studied in those references, showing that the (axial) prolate and oblate minima, which are well separated by high-energy barriers in the degree of freedom, are in many cases softly linked along the direction. Indeed, some axial minima become saddle points when the degree of freedom is included in the analysis. The differences found with the present HF+BCS approach for the axial equilibrium values are not significant, but the topology of the surfaces are somewhat different. Similarities and differences of the various topologies are discussed in the next section.
In the case of odd- nuclei, the ground state is expressed as a one-quasiparticle (1qp) state, which is determined by finding the blocked state that minimizes the total energy. In the present study we use the equal filling approximation (EFA), a prescription widely used in mean-field calculations to treat the dynamics of odd nuclei preserving time-reversal invariance rayner2 . In this approximation the unpaired nucleon is treated on equal footing with its time-reversed state by putting half a nucleon in a given orbital and the other half in the time-reversed partner. This approximation has been found to be equivalent to the exact blocking when the time-odd fields of the energy density functional are neglected and then, it is sufficiently precise for most practical applications schunck10 . Effects of time-odd terms in HFB calculations have also been studied in Ref. hellemans12 . An extension of beyond-mean-field calculations, where the generator coordinate method is built from self-consistently blocked 1qp HFB states for odd-mass nuclei has recently been presented in Ref. bally14 .
The deformation in the decaying nuclei in both even-even and odd- cases, is self-consistently determined. In the odd- case, the core polarization induced by the odd particle is then taken into account. The effect found is however very small and we get very similar axial deformations in the even-even and neighbor odd-A nuclei. The small effect can be also observed in the Gogny database web_Gogny , comparing the DECs of the even-even and nearest odd- isotopes.
Since the GT operator of the allowed transitions is a pure spin-isospin operator without any radial dependence, one expects the spatial functions of the parent and daughter wave functions to be as close as possible in order to overlap maximally. Then, transitions connecting different radial structures in the parent and daughter nuclei will be suppressed. Thus, we assume similar shapes for the decaying parent nucleus and for all populated states in the daughter nucleus, neglecting core polarization effects in the daughter nuclei. This is a common assumption to deformed QRPA calculations moller1 . That core polarization effects are small in both odd-odd case in relation to even-even parent and odd-even (even-odd) case in relation to the even-odd (odd-even) parent can be seen in the Gogny database web_Gogny , where potential energy surfaces obtained from Gogny HFB calculations are shown all along the nuclear chart. By comparing the surfaces of parent (Hg, Pt) and daughter (Au, Ir) isotopes considered in this work, one realizes that the profiles are very similar with practically no effect from core polarization due to the odd particles.
The reduction in the transitions connecting different shapes have been quantified in the case of double decay alvarez04 . It has been shown that the overlaps between the wave functions in the intermediate nucleus reached from different shapes of the parent and daughter nuclei are dramatically reduced when the deformations differ from each other. Only with similar deformations the overlap is significant. Consequently, given the small polarization effects and the suppression of the overlaps with different deformations, we consider in this work only GT transitions between parent and daughter partners with like deformations.
To describe GT transitions, a spin-isospin residual interaction is added to the mean field and treated in a deformed proton-neutron QRPA moller1 ; moller2 ; homma ; moller3 ; moller08 ; hir1 ; hir2 ; frisk95 ; sarri01npa . This interaction contains two parts, particle-hole (ph) and particle-particle (pp). The interaction in the ph channel is responsible for the position and structure of the GT resonance homma ; sarri01npa and it can be derived consistently from the same Skyrme interaction used to generate the mean field, through the second derivatives of the energy density functional with respect to the one-body densities. The ph residual interaction is finally expressed in a separable form by averaging the Landau-Migdal resulting force over the nuclear volume, as explained in Ref. sarri98 . The pp component is a neutron-proton pairing force in the coupling channel, which is also introduced as a separable force hir1 ; hir2 ; sarri01npa . Its strength is usually fitted to reproduce globally the experimental half-lives. Various attempts have been made in the past to fix this strength homma , arriving to expressions that depend on the model used to describe the mean field, Nilsson model in the above reference. In previous works we studied the sensitivity of the GT strength distributions to the various ingredients contributing to the deformed QRPA calculations, namely to the nucleon-nucleon effective interaction, to pairing correlations, and to residual interactions. We found different sensitivities to them. In this work, all of these ingredients have been fixed to the most reasonable choices found previously sarri05prc ; moreno06 . In particular we use the coupling strengths MeV and MeV for the ph and pp channels, respectively. The technical details to solve the QRPA equations have been described in Refs. hir1 ; hir2 ; sarri98 . Here we only mention that, because of the use of separable residual forces, the solutions of the QRPA equations are found by solving first a dispersion relation, which is an algebraic equation of fourth order in the excitation energy . Then, for each value of the energy, the GT transition amplitudes in the intrinsic frame connecting the ground state of an even-even nucleus to one phonon states in the daughter nucleus are found to be
| (1) |
where and
| (2) | |||||
| (3) |
with
| (4) |
in terms of the occupation amplitudes for neutrons and protons () and the matrix elements of the spin operator, , connecting proton and neutron single-particle states, as they come out from the HF+BCS calculation. and are the forward and backward amplitudes of the QRPA phonon operator, respectively.
Once the intrinsic amplitudes in Eq. (1) are calculated, the GT strength in the laboratory system for a transition can be obtained as
| (5) | |||||
in units. To obtain this expression, the initial and final states in the laboratory frame have been expressed in terms of the intrinsic states using the Bohr-Mottelson factorization bm .
When the parent nucleus has an odd nucleon, the ground state can be expressed as a one-quasiparticle (1qp) state in which the odd nucleon occupies the single-particle orbit of lowest energy. Then two types of transitions are possible. One type is due to phonon excitations in which the odd nucleon acts only as a spectator. These are three-quasiparticle (3qp) states and the GT transition amplitudes in the intrinsic frame are basically the same as in the even-even case in Eq. (1), but with the blocked spectator excluded from the calculation. The other type of transitions are those involving the odd nucleon state (1qp), which are treated by taking into account phonon correlations in the quasiparticle transitions in first-order perturbation. The transition amplitudes for the correlated states can be found in Refs. hir2 ; sarri01prc .
In this work we refer the GT strength distributions to the excitation energy in the daughter nucleus. In the case of even-even decaying nuclei, the excitation energy of the 2qp states in the odd-odd daughter nuclei is simply given by
| (6) |
where and are the lowest quasiparticle energies for protons and neutrons, respectively. In the case of an odd- nucleus we have to deal with 1qp and 3qp transitions. For Hg and Pt isotopes we have odd-neutron parents decaying into odd-proton daughters. The excitation energies for 1qp transitions are
| (7) |
The excitation energy with respect to the ground state of the daughter nucleus for 3qp transitions is
| (8) |
Therefore, the lowest excitation energy of 3qp type is of the order of twice the neutron pairing gap and then, the strength contained below typically 2-3 MeV in the odd- nuclei corresponds to 1qp transitions.
The -decay half-life is obtained by summing all the allowed transition strengths to states in the daughter nucleus with excitation energies lying below the corresponding energy, i.e., , written in terms of the nuclear masses and the electron mass (), and weighted with the phase-space factors ,
| (9) |
with s and , where 0.77 is a standard quenching factor. In this work we use experimental values audi12 . In /EC decay, contains two parts, positron emission and electron capture. The former, , is computed numerically for each value of the energy including screening and finite size effects, as explained in Ref. gove ,
| (10) |
with
| (11) |
where ; ; is the fine structure constant and the nuclear radius. is the total energy of the particle, is the total energy available in units, and is the momentum in units.
The electron capture phase factors, , have also been included following Ref. gove :
| (12) |
where denotes the atomic sub-shell from which the electron is captured, is the neutrino energy, is the radial component of the bound state electron wave function at the nucleus, and stands for other exchange and overlap corrections gove .
III Results and discussion
In this section we first discuss the energy curves and shape coexistence expected, discussing the shape evolution in Hg and Pt isotopic chains. Then, we present the results obtained for the Gamow-Teller strength distributions in the neutron-deficient 176-192Hg and 172-186Pt isotopes with special attention to their dependence on the nuclear shape and discuss their relevance as signatures of deformation to be explored experimentally. Finally, we discuss the half-lives and compare them with the experimental values.
III.1 Equilibrium deformations
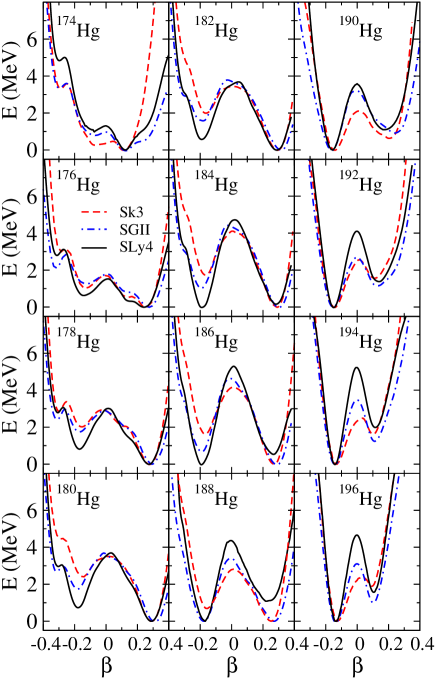
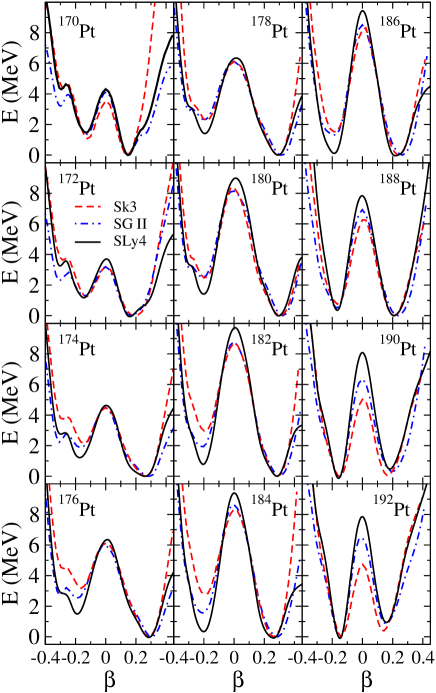
We show in Figs. 1 and 2 the DECs calculated with three Skyrme forces, Sk3, SGII, and SLy4, for Hg and Pt isotopes, respectively. The energies are shown as a function of the quadrupole deformation parameter calculated microscopically as , defined in terms of the proton quadrupole moment, , and charge m.s. radius, . We get similar qualitative results with the three Skyrme forces considered. More specifically, we obtain the same patterns of shape coexistence with minima located at practically the same deformations although the relative energies may change from one force to another. Thus, we focus the discussion on the SLy4 interaction.
In the case of Hg isotopes (Fig. 1) we get prolate and oblate minima in all the isotopes from up to . We can see that the ground state is predicted to be prolate for 174-182Hg and oblate for 184-196Hg isotopes. The transition occurs smoothly around 184Hg for SLy4, where we obtain two coexisting shapes at the same energy and it takes place around 186Hg (188Hg) with SGII (Sk3). Similarly, in the case of Pt isotopes (Fig. 2) we get prolate and oblate minima in all the isotopes from up to , but in this case the ground state is always prolate except in the heavier isotopes, 190,192Pt, where the oblate shape becomes ground state with the three forces. The transition is very smooth and the two shapes are practically degenerate between 184Pt and 190Pt for SLy4. Except for the very light isotopes, we observe in both isotopic chains the existence of rather sharp oblate and prolate energy minima, close in energy and separated by very high energy barriers, giving raise to shape coexistence. These findings are in qualitative agreement with recent calculations yao13 ; nomura13 ; gramos14hg ; rayner10 ; gramos14pt ; nomura11 . Looking in more detail the results from different calculations, one observes differences and similarities within the various approaches. There are robust features common to all calculations, such as the existence of oblate and prolate minima located at similar deformations and separated by spherical barriers, or the isotopic evolution from oblate shapes in the heavier isotopes to prolate shapes in the lighter ones. But there are also particular features that change according to the different calculations, such as the height of the barriers or the relative energies between the minima that finally determines the exact isotope where the shape transition takes place. Obviously, the exact location of the shape transition is very sensitive to small details of the calculation because the shape transition occurs precisely around the region where the energies of the competing shapes are practically degenerate. Thus, it is not surprising that the shape transition in Pt isotopes predicted in Ref. yao13 within a beyond mean field approach with the Skyrme SLy6 occurs at instead of in our calculation. In the same line triaxial D1M-Gogny calculations predict a smooth shape transition at nomura13
Similarly, the shape transition in Pt isotopes in our calculations takes place at . This agrees with triaxial calculations with the Gogny force that exhibit a smooth transition at , passing through a soft triaxial solution rayner10 ; gramos14pt ; nomura11 , as well as with the calculations in sarri08 ; robledo09 . In particular, the DECs in Pt isotopes were studied in Ref. sarri08 , comparing the effects of different interactions (SLy4, SLy6, Gogny) and pairing treatments (constant strength, constant pairing gaps, density-dependent zero-range forces). Little changes in the energy profiles were found within those treatments, but still enough to change the absolute minimum from one deformation to another in the transitional region around 188Pt, where the energies are practically degenerate. Nevertheless, for the purpose of this work, the exact location at which the shape transitions occur is not of relevance. The important aspect in this work is that a shape competition is taken place and whether the sensitivity of the B(GT) profiles to deformation can be used as a fingerprint of the nuclear shape. Then, we choose in this work a reasonable mean-field based on the Skyrme SLy4 with constant pairing gaps. to be used as a starting point for a QRPA calculation of the decay properties.
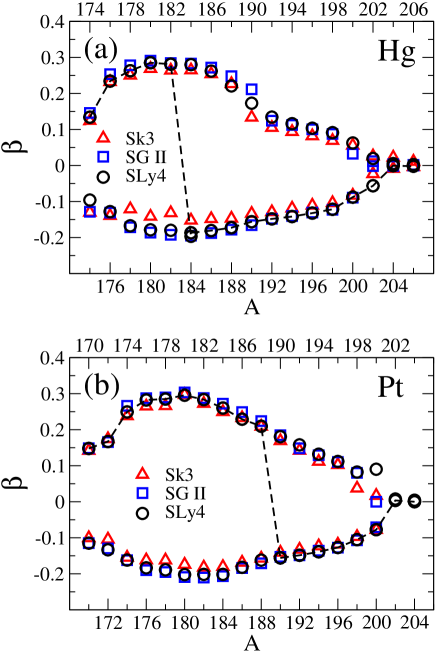
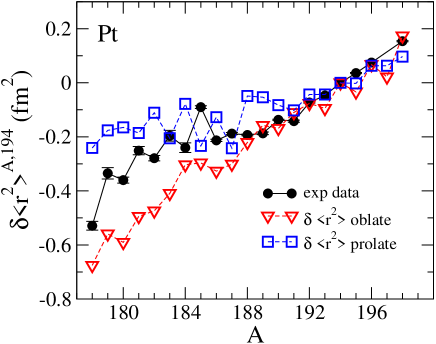
To illustrate better the role of deformation in the isotopic evolution, we show in Fig. 3 the quadrupole deformation parameter of the various energy minima as a function of the mass number , for Hg (a) and Pt (b) isotopic chains. The dashed lines join the deformations corresponding to the lowest HF+BCS minimum in the DECs obtained with SLy4. Starting from the heaviest isotopes in Fig. 3, we get spherical shapes, as they correspond to the neutron shell closure. Moving into the neutron-deficient region, we observe the appearance of both oblate and prolate shapes with increasing quadrupole moments. The shape of the minimum energy changes from oblate in the heavier isotopes to prolate in the lighter ones at 182-184Hg and 188-190Pt for SLy4. The shapes reach maximum quadrupole deformations of about in the prolate sector and about in the oblate one.
Charge radii and their differences have been shown rayner1 ; rayner2 to be suitable quantities to study the evolution of the nuclear-shape changes as they can be measured with remarkable precision using laser spectroscopic techniques cheal . They are calculated by folding the proton distribution of the nucleus with the finite size of the protons and the neutrons. The m.s. radius of the charge distribution in a nucleus can be expressed as negele
| (13) |
where is the m.s. radius of the point proton distribution in the nucleus
| (14) |
fm2 sick03 and fm2 gentile11 are the m.s. radii of the charge distributions in a proton and a neutron, respectively. is a small correction due to the center of mass motion. It is worth noticing that the most important correction to the point proton m.s. nuclear radius, coming from the proton charge distribution , vanishes when isotopic differences are considered, since it does not involve any dependence on .
The variations of the charge radii trends in isotopic chains are related to deformation effects and can be used as signatures of shape transitions. For an axially symmetric static quadrupole deformation the increase of the charge radius with respect to the spherical value is given to first order by
| (15) |
where usually is taken from the droplet model. In this work we analyze the effect of the quadrupole deformation on the charge radii from a microscopic self-consistent approach.
One should notice that our calculations at the mean-field level correspond to the oblate and prolate mean-field solutions and, consequently, they don’t correspond to the actual ground state to which the experimental radii are referred.
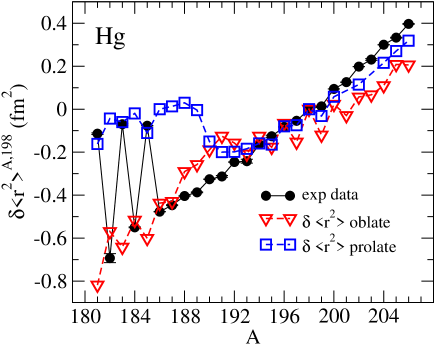
In Figs. 4-5 we show the differences , where the reference isotope is () for the Hg (Pt) isotopic chain. Our calculations are compared with experimental data measured by laser spectroscopy and compiled in Ref. angeli04 . For Hg isotopes, the experiment bonn72 ; ulm86 ; lee78 shows an even-odd staggering in the lighter isotopes (), with larger radii in the odd- isotopes. When we compare the data for light Hg isotopes with our calculations we see that the even-even isotopes are well described with an oblate shape, whereas the odd- isotopes are rather associated with a prolate shape. We also observe in our calculations a bump in the oblate radii around and a more pronounced one in the prolate radii around that are related to the shape variation of the energy minima. In the case of Pt isotopes, the experimental radii leblanc99 ; lee88 ; sauvage00 in the interval are in between the oblate and prolate radii of reference, pointing out that strong mixing between these two structures is necessary to describe the ground state. The agreement with experiment is reasonable in the heavier Hg and Pt isotopes for both oblate and prolate radii, indicating that these nuclei are approaching a spherical shape.
III.2 Gamow-Teller strength distributions
In this subsection we study the energy distribution of the Gamow-Teller strengths calculated at the equilibrium shapes that minimize the energy of the nucleus. But before showing the results of our calculations it is worth discussing briefly the expected sensitivity of these calculations to the choice of the nucleon-nucleon effective Skyrme interaction, as well as to the coupling strengths of the residual forces.
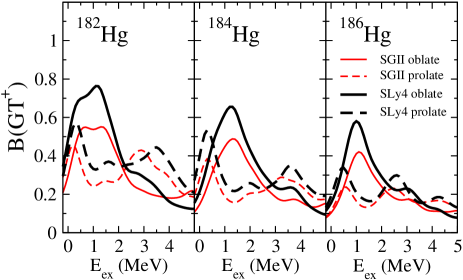
Figure 6 illustrates the sensitivity of the GT strength distributions to the Skyrme interaction. We show in this figure continuous distributions obtained by folding the strength at each excitation energy with 1 MeV width Breit-Wigner functions. The results correspond to the Skyrme interactions SLy4 and SGII, and for three Hg isotopes, 182,184,186Hg. For a given type of deformation (oblate or prolate), we observe very similar decay patterns for both interactions, with slightly lower strength in the case of SGII. On the other hand, for a given Skyrme force the dependence on the deformation is manifest. This example demonstrates that the profiles of the GT strength distributions are characteristic of the nuclear shape and depend little on the details of the two-body force. This marked sensitivity to deformation can then be used to get information about the nuclear shape of the decaying nucleus, something that has been exploited in the past in other mass regions isolde .
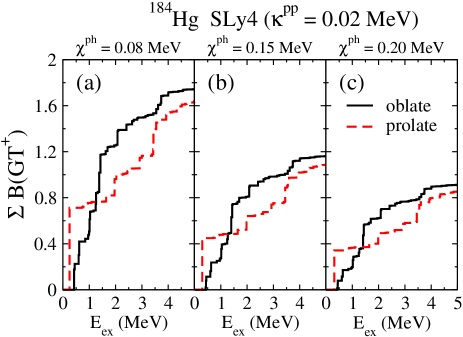
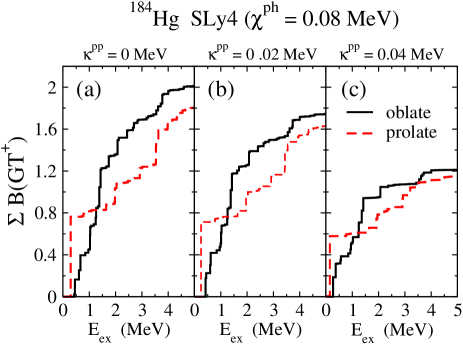
In the next two figures we discuss the effect of the residual force on the GT strength distributions, using 184Hg as an example. In this case, for a better comparison, we plot the summed strengths that give us the total strength contained below a given energy. In Fig. 7 we can see the effect of the ph residual force. For that purpose we show the results obtained with a fixed value of the pp interaction ( MeV) for MeV (a), MeV (b), and MeV (c). As increases, the strength is reduced, especially in the low-energy region, but the profiles of both prolate and oblate shapes remain basically the same. This reduction has immediate consequences on the half-lives that increase with increasing values of . Similarly, we show in Fig. 8 the effect of the pp residual force by taking fixed the ph residual interaction ( MeV) and varying the value of the pp interaction from (a) to MeV (b), and finally to MeV (c). As increases the strength is reduced and slightly shifted to lower energies, but again the prolate and oblate profiles persist.
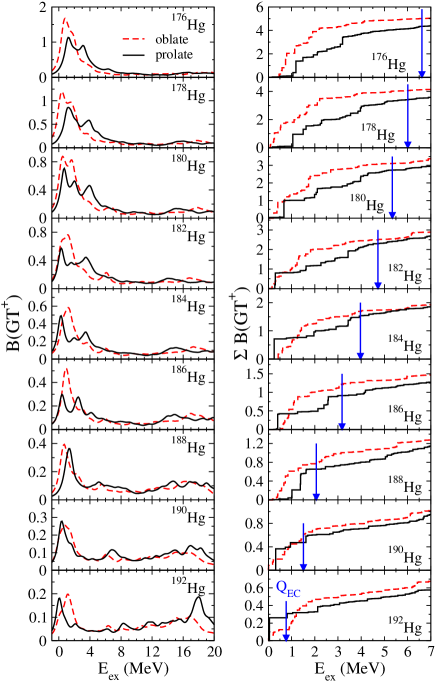
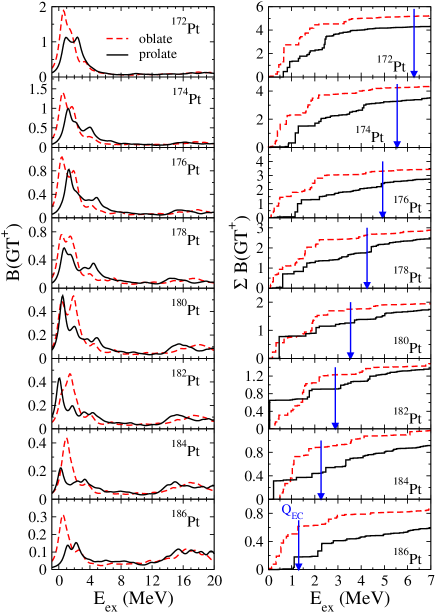
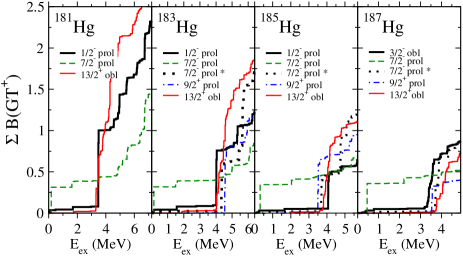
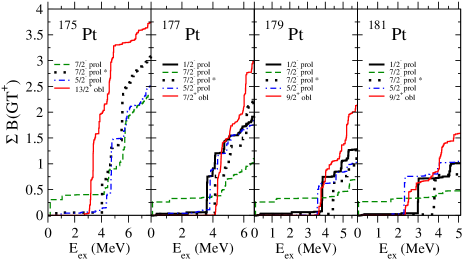
In the next figures, Figs. 9-12, we show the GT strength distributions for oblate and prolate shapes as a function of the excitation energy in the daughter nucleus obtained with SLy4 and with the residual forces written in Sec. II. Although a similar figure to Fig. 10 was already presented in Ref. moreno06 , for the sake of completeness and to facilitate the comparison, we also show here those results for the Pt isotopes. In the first two figures we show the results for the even Hg and Pt isotopes, whereas in the last two figures we present the results for the odd- isotopes. In the left panels we can see continuous GT strength distributions resulting from a folding procedure using 1 MeV width Breit-Wigner functions on the discrete spectrum. On the other hand, in the right panels we plot the accumulated GT strength up to a reduced energy range that covers the energies represented by the vertical arrows. Thus, we can see in more detail both the strength distribution and the total GT strength contained in the energy window relevant to the -decay and to the half-lives. In particular, the crossing of the curves with the vertical arrows shows us the total GT strength available by -decay and eventually measurable. It should be noted that no quenching factor is included in these distributions and therefore one should consider a reduction of this strength prior to comparison with future experiments.
The left panels in Figs. 9 and 10 show the GT strength distributions for the even-even Hg and Pt isotopes, respectively. The strength increases as we move away from the valley of stability to more and more neutron-deficient (lighter) isotopes (note the different scales). On a global scale the strength distribution from different shapes differ mainly in the low energy region. With minor exemptions, oblate shapes produce more strength at low energies and therefore smaller half-lives. In all cases we observe a strong peak (or double peak) at low excitation energy (below 5 MeV) and little strength above this energy, except in the heavier isotopes where a bump at high energy is developed. The differences between oblate and prolate shapes can be better appreciated in the accumulated plots displayed in the right-hand sides. In general we observe that the results from oblate shapes are more fragmented and the strength in the accumulated plots increases steadily. Conversely, prolate shapes produce in most cases a strong peak at low excitation energy an very little strength above. The location of the energies determines the GT strength distribution available in the decay and thus, contributing to the half-lives. Clearly, energies increase when moving away from stability.
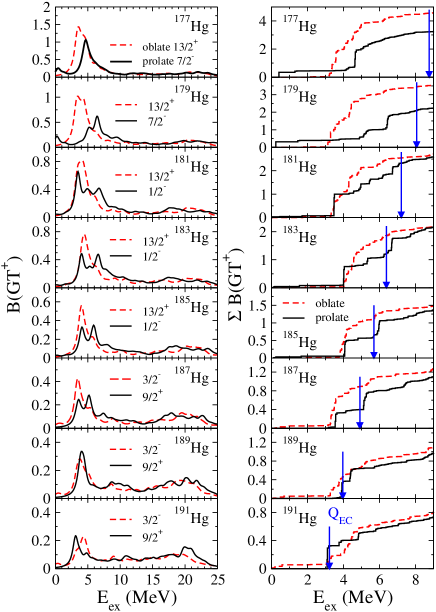
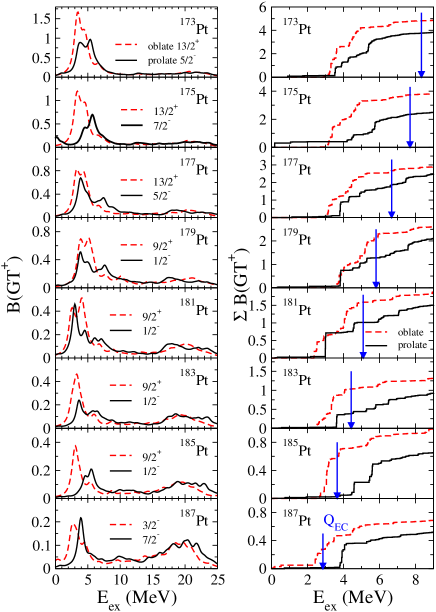
The next two figures, Figs. 11 and 12, contain the GT strength distributions for the odd-even Hg and Pt isotopes, respectively. In the case of odd nuclei the spin and parity of the nucleus are determined by those of the odd nucleon. In principle one would sit the odd nucleon in the single-particle orbit that minimizes the energy. However, it turns out that for deformed nuclei in this mass region several states with different spin projections and parities are very close to the Fermi surface at practically the same energy, and tiny details in the interaction can change the ground state from one to another. Given that the spin () and parity () of these Hg and Pt isotopes are known experimentally, we have chosen these assignments for our odd nucleons that correspond in all cases to states close to the Fermi energy. Namely, the experimental assignments of the odd- Hg isotopes are given by for 177,179Hg; for 181,183,185Hg; and for 187,189,191Hg. Similarly, for odd- Pt isotopes they are given by for 173Pt; for 175Pt; for 177Pt; for 179,181,183Pt; for 185Pt; and for 187Pt. Besides these values, for each nucleus, we also consider in our calculations the spin and parity corresponding to the energy minimum of the other nuclear shape. All of these values appear as labels in each isotope, where solid (dashed) lines stand for prolate (oblate) shapes.
In the odd- isotopes we observe a displacement of the GT strength to higher excitation energies with respect to the even neighbor isotopes. This is due to the character of the excitation mentioned in the previous section, where we discussed that 3qp transitions, similar to those of the even isotopes but with the odd orbital blocked, appear only at energies above twice the pairing gap, typically 2-3 MeV. Similarly, the values are displaced in an equivalent amount since the mass differences involved in the definitions are sensitive to the pairing energy in a similar way.
To show further the sensitivity of GT strength distributions to the spin and parity of the odd-A parent nucleus, we show in Fig. 13 and Fig. 14 the results for several more choices of spins and parities in 181,183,185,187Hg and 175,177,179,181Pt, respectively. These are nuclei that are currently being considered as candidates to measure their GT strength distributions at ISOLDE/CERN, using the TAS technique algora , and will complement the measurements already taken in Pb and Hg isotopes algora ; submitted ; thesis . Obviously, the decay patterns should be affected by the spin and parity of the odd nucleon because they determine to a large extent the allowed spin and parities that can be reached in the daughter nucleus. This is especially true in the case of 1qp transitions where the odd nucleon involved determines the low-lying spectrum. Thus, one expects the low-lying GT strength to be especially sensitive to the spin-parity of the odd nucleon. This sensitivity translates immediately to the half-lives that depend on the strength contained below . In the case 181Hg it is found experimentally that the ground state corresponds to with band heads at and . The ground state in 183Hg is with another band head and a isomer at 266 keV. 185Hg has again a ground state with a band head at 34 keV, a at 213 keV, and a state at 99 keV. 187Hg is a nucleus with a band head and a state at 162 keV. In our calculations the experimental ground states correspond to prolate states with asymptotic quantum Nilsson numbers given by . We also consider prolate () states, very close in energy an observed experimentally, as well as prolate () states. Finally, we show the results for oblate shapes corresponding to () states that are also seen experimentally. In 187Hg the experimental ground state corresponds to the oblate state . Besides the prolate () with origin in the spherical orbital, we also consider a second prolate () state in 183,185,187Hg with origin in the spherical orbital and labeled with an asterisk in Figs. 13-14. These two states lead to quite different profiles of the GT strength distributions. Similarly, the ground state of 175Pt is experimentally found to be with a band head at an undetermined energy. The ground state of 177Pt is with a at 95 keV. 179Pt (181Pt) has a ground state with a excited state at 299 keV (276 keV) and a excited state at 145 keV (117 keV). In addition to the states considered for Hg isotopes, calculations for Pt isotopes are also shown for prolate () states and oblate () and () states.
As we can see in the figures, the sensitivity of the distributions to the spin-parity is large because of the selection rules of allowed transitions. In these examples it is comparable to the effect from deformation and therefore, one can conclude that odd- isotopes may not be the best candidates to look for deformation signatures on the -decay patterns. On the other hand, this sensitivity could be helpful to get information on the nuclear shape based on the spin and parity of the decaying nucleus, which are characteristic and very different for oblate or prolate shapes. As a matter of fact, the possibility of measuring the GT strength distributions in odd- nuclei corresponding to the ground and isomeric states separately algora , would represent a breakthrough in the sense that the decay patterns of prolate and oblate configurations could be disentangled by selecting properly the spin-parity of the decaying isotope. This information could be used thereafter to infer information on the shape of the ground state of the even-even isotopes.
| isotope | exp | QRPA(SLy4) | |||||
|---|---|---|---|---|---|---|---|
| 181Hg | 7.210 | 4.9 | pro | 7.53 | |||
| pro | 3.39 | ||||||
| obl | 8.13 | ||||||
| 183Hg | 6.385 | 10.7 | pro | 21.55 | |||
| pro | 5.71 | ||||||
| pro | 45.21 | ||||||
| pro | 86.73 | ||||||
| obl | 36.18 | ||||||
| 185Hg | 5.690 | 52.2 | pro | 62.54 | |||
| pro | 9.95 | ||||||
| pro | 75.38 | ||||||
| pro | 71.74 | ||||||
| obl | 84.30 | ||||||
| 187Hg | 4.910 | 114 | obl | 83.19 | |||
| pro | 19.44 | ||||||
| pro | 194.4 | ||||||
| pro | 379.8 | ||||||
| obl | 464.4 | ||||||
| isotope | exp | QRPA(SLy4) | |||||
|---|---|---|---|---|---|---|---|
| 175Pt | 7.694 | 7.20 | pro | 2.33 | |||
| pro | 6.96 | ||||||
| pro | 10.06 | ||||||
| obl | 3.63 | ||||||
| 177Pt | 6.677 | 11.24 | pro | 15.98 | |||
| pro | 5.53 | ||||||
| pro | 23.61 | ||||||
| pro | 19.14 | ||||||
| obl | 30.91 | ||||||
| 179Pt | 5.811 | 21.25 | pro | 45.02 | |||
| pro | 10.38 | ||||||
| pro | 86.30 | ||||||
| pro | 53.49 | ||||||
| obl | 63.11 | ||||||
| 181Pt | 5.097 | 52.0 | pro | 64.23 | |||
| pro | 17.66 | ||||||
| pro | 143.6 | ||||||
| pro | 39.77 | ||||||
| obl | 51.73 | ||||||
III.3 Half-lives
As we have seen above, the sensitivity of the GT strength distributions to the nuclear deformation could be used to get information about the nuclear shape in the neutron-deficient Hg and Pt isotopes. Unfortunately, these measurements are not yet available. However, we have experimental information on the EC-decay half-lives that summarize in a single quantity the detailed structure of the GT strength distribution profiles. As we can see from Eq. (9), half-lives are no more that integral quantities obtained as sums of the GT strengths weighted with the energy-dependent phase-space factors given by Eq. (10). Therefore, it is natural to contrast our calculations with this information.
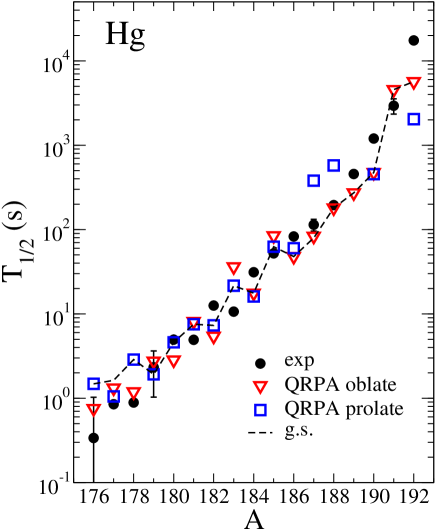
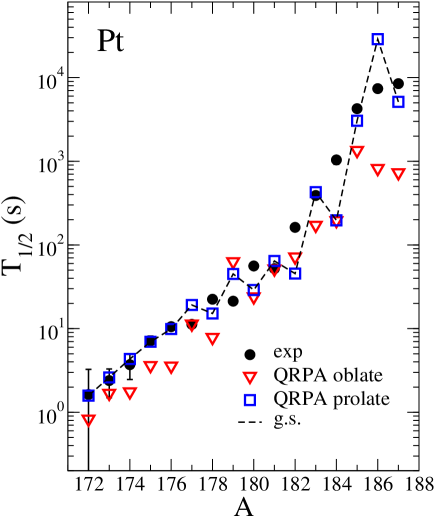
The experimental half-lives of the neutron-deficient Hg and Pt isotopes can be seen in Figs. 15 and 16, respectively. The total half-lives taken from audi12 contain also contributions from the competing decay. Using the experimental percentage of the EC involved in the total decay, we have extracted the EC half-lives, which are displayed in the figures. These half-lives are compared to our calculations using the two shapes (oblate and prolate) that minimize the energy in each isotope. We have joined with dashed lines the results corresponding to the absolute energy minimum in our calculations. The spins and parities of the odd- isotopes are those considered in Figs. 11 and 12. In both cases, Hg and Pt isotopes, we obtain fair agreement with the trend observed experimentally.
In the heavier Hg isotopes oblate shapes reproduce better the experimental trend, whereas in the lighter Hg isotopes the results are more spread around the data and there is no clear advantage of one shape over the other. No firm conclusions can be extracted on preferences about the shape, except for the higher masses above . In the case of Pt isotopes, the prolate shape looks more consistent with the data for . The spread of results is somehow expected taking into account the uncertainties in the calculations coming from Skyrme forces, pairing gap parameters, residual interactions, values, and quenching factors included in the calculations. They were discussed in Refs. sarri05prc ; moreno06 . In the case of the heavier isotopes the agreement with experiment is somewhat worse, but one has to take into account that in these cases we are dealing with very large half-lives that are the natural consequence of very small energies as we approach the stable isotopes. Therefore, the half-lives are only sensitive to the very low-energy tail of the GT strength distribution and little changes in this tail can change the half-lives dramatically. In any case, the half-lives of almost stable nuclei can only constrain a tiny portion of the whole GT strength distribution and therefore their significance is minor.
Table 1 (2) shows the half-lives in the odd- Hg (Pt) isotopes considered in Fig. 13 (14). We show the experimental , , and values audi12 together with the calculated QRPA(SLy4) results obtained for various states and deformations. The dispersion of the results due to the spin and parity of the odd nucleus is apparent.
IV CONCLUSIONS
In this work we have studied bulk and decay properties of even and odd neutron-deficient Hg and Pt isotopes using a deformed pnQRPA formalism with spin-isospin ph and pp separable residual interactions. The quasiparticle mean field is generated from a deformed HF approach with two-body Skyrme effective interactions, taking SLy4 as a reference and comparing with results from Sk3 and SGII. The formalism includes pairing correlations in the BCS approximation, using fixed gap parameters extracted from the experimental masses. The equilibrium deformations in each isotope are derived self-consistently within the HF procedure obtaining oblate and prolate coexisting shapes in most isotopes. These results are very robust and different schemes including non-relativistic self-consistent treatments with either Skyrme or Gogny interactions, as well as relativistic mean field approaches produce similar results. The isotopic evolution in Hg and Pt chains show a shape transition in agreement with experimental findings. In addition, we have calculated mean square charge radii differences and have compared them to data from laser spectroscopy with reasonable agreement.
Then, we have focused on the main objective in this work, studying the decay properties of these isotopes. We have payed special attention to the deformation dependence of these properties in a search for additional fingerprints of nuclear shapes that would complement the information extracted by other means, such as rotational bands built on low-lying states and quadrupole transition rates among them. We have evaluated the energy distributions of the GT strength for the possible equilibrium shapes and have shown their energy profiles that will be compared with experiments already carried out on Hg isotopes that are being currently analyzed algora . It is also highly encouraged to investigate experimentally the decay of odd- isotopes from both ground and shape-isomeric states. Measuring separately the decay patterns of states characterized by rather different spins and parities corresponding to different nuclear shapes would be a significant piece of information regarding deformation effects that can be later exploited to learn about the deformation in even systems.
The EC half-lives have been calculated and compared to the available experimental information. The reasonable agreement achieved validates the quality of our results. These calculations contribute to extend our knowledge of this interesting mass region characterized by shape coexistence by describing their decay properties in terms of the deformation.
Acknowledgements.
We are grateful to E. Moya de Guerra, A. Algora, E. Nácher, and L. M. Fraile for useful discussions. This work was supported by Ministerio de Economía y Competitividad (Spain) under Contract No. FIS2011–23565 and the Consolider-Ingenio 2010 Programs CPAN CSD2007-00042.References
- (1) K. Heyde and J. L. Wood, Rev. Mod. Phys. 83, 1467 (2011).
- (2) R. Julin, K. Helariutta, and M. Muikku, J. Phys. G.: Nucl. Part. Phys. 27, R109 (2001).
- (3) J. Bonn, G. Huber, H.-J. Kluge, L. Kluger, and E. W. Otten Phys. Lett. B 38, 308 (1972).
- (4) S. Frauendorf and V. V. Pashkevich, Phys. Lett. B 55, 365 (1975).
- (5) G. Ulm et al., Z. Phys. A 325, 247 (1986).
- (6) A. N. Andreyev et al., Nature 405, 430 (2000).
- (7) F. Hannachi et al., Z. Phys. A 330, 15 (1988); Nucl. Phys. A 481, 135 (1988).
- (8) G. J. Lane et al., Nucl. Phys. A589, 129 (1995).
- (9) T. Grahn et al., Phys. Rev. C 80, 014324 (2009).
- (10) M. Scheck et al., Phys. Rev. C 81, 014310 (2010).
- (11) L. P. Gaffney et al., Phys. Rev. C 89, 024307 (2014).
- (12) N. Bree et al., Phys. Rev. Lett. 112, 162701 (2014).
- (13) B. Cederwall et al., Z. Phys. A 337, 283 (1990).
- (14) G. D. Dracoulis et al., Phys. Rev. C 44, R1246 (1991).
- (15) P. M. Davidson et al., Nucl. Phys. A657, 219 (1999).
- (16) F. Le Blanc et al., Phys. Rev. C 60, 054310 (1999).
- (17) R. Bengtsson et al., Phys. Lett. B 183, 1 (1987); W. Nazarewicz, Phys. Lett. B 305, 195 (1993).
- (18) M. Bender, P. Bonche, T. Duguet, and P.-H. Heenen, Phys. Rev. C 69, 064303 (2004).
- (19) J. M. Yao, M. Bender, and P.-H. Heenen, Phys. Rev. C 87, 034322 (2013).
- (20) J. P. Delaroche et al., Phys. Rev. C 50, 2332 (1994).
- (21) J. Libert, M. Girod, and J.-P. Delaroche, Phys. Rev. C 60, 054301 (1999).
- (22) J. L. Egido, L. M. Robledo, and R. R. Rodríguez-Guzmán, Phys. Rev. Lett. 93, 082502 (2004); R. R. Rodríguez-Guzmán, J. L. Egido, and L. M. Robledo, Phys. Rev. C 69, 054319 (2004).
- (23) R. Rodríguez-Guzmán, P. Sarriguren, L. M. Robledo, and J. E. García-Ramos, Phys. Rev. C 81, 024310 (2010).
- (24) M. M. Sharma and P. Ring, Phys. Rev. C 46, 1715 (1992); S. Yoshida, S. K. Patra, N. Takigawa, and C. R. Praharaj, Phys. Rev. C 50, 1398 (1994); T. Niksic, D. Vretenar, P. Ring, and G. A. Lalazissis, Phys. Rev. C 65, 054320 (2002).
- (25) K. Nomura, R. Rodríguez-Guzmán, and L. M. Robledo, Phys. Rev. C 87, 064313 (2013).
- (26) J. E. García-Ramos and K. Heyde, Phys. Rev. C 89, 014306 (2014).
- (27) I. O. Morales, A. Frank, C. E. Vargas, and P. Van Isacker, Phys. Rev. C 78, 024303 (2008).
- (28) J. E. García-Ramos and K. Heyde, Nucl. Phys. A825, 39 (2009).
- (29) J. E. García-Ramos, V. Hellemans, and K. Heyde, Phys. Rev. C 84, 014331 (2011).
- (30) J. E. García-Ramos, K. Heyde, L. M. Robledo, and R. Rodríguez-Guzmán, Phys. Rev. C 89, 034313 (2014).
- (31) K. Nomura, T. Otsuka, R. Rodríguez-Guzmán, L. M. Robledo, and P. Sarriguren, Phys. Rev. C 83, 014309 (2011).
-
(32)
http://www-phynu.cea.fr/science_en_ligne/carte_
potentiels_microscopiques/carte_potentiel_nucleaire_
eng.htm - (33) F. Frisk, I. Hamamoto, and X. Z. Zhang, Phys. Rev. C 52, 2468 (1995).
- (34) P. Sarriguren, E. Moya de Guerra, A. Escuderos, and A. C. Carrizo, Nucl. Phys. A635, 55 (1998).
- (35) P. Sarriguren, E. Moya de Guerra, and A. Escuderos, Nucl. Phys. A658, 13 (1999).
- (36) P. Sarriguren, E. Moya de Guerra, and A. Escuderos, Phys. Rev. C 64, 064306 (2001).
- (37) P. Sarriguren, E. Moya de Guerra, and A. Escuderos, Nucl. Phys. A691, 631 (2001).
- (38) P. Sarriguren, R. Alvarez-Rodríguez, and E. Moya de Guerra, Eur. Phys. J. A 24, 193 (2005).
- (39) P. Sarriguren, Phys. Rev. C 79, 044315 (2009); Phys. Lett. B 680, 438 (2009); Phys. Rev. C 83, 025801 (2011).
- (40) P. Sarriguren, E. Moya de Guerra, and R. Alvarez-Rodríguez, Nucl. Phys. A716, 230 (2003).
- (41) P. Sarriguren, Phys. Rev. C 87, 045801 (2013).
- (42) P. Sarriguren and J. Pereira, Phys. Rev. C 81, 064314 (2010); P. Sarriguren, A. Algora, and J. Pereira, Phys. Rev. C 89, 034311 (2014).
- (43) E. Poirier et al., Phys. Rev. C 69, 034307 (2004); E. Nácher et al., Phys. Rev. Lett. 92, 232501 (2004); A. B. Pérez-Cerdán et al., Phys. Rev. C 88, 014324 (2013).
- (44) P. Sarriguren, O. Moreno, R. Alvarez-Rodríguez, and E. Moya de Guerra, Phys. Rev. C 72, 054317 (2005).
- (45) O. Moreno, P. Sarriguren, R. Alvarez-Rodríguez, and E. Moya de Guerra, Phys. Rev. C 73, 054302 (2006).
- (46) A. Algora, private communication.
- (47) A. Algora et al., to be published.
-
(48)
M. E. Estevez Aguado, Ph. D. thesis, Valencia 2012;
http://webgamma.ific.uv.es/gamma/wp-content/
uploads/2013/12/Tesis_Esther_Estevez_Aguado.pdf - (49) E. Chabanat, P. Bonche, P. Haensel, J. Meyer, and R. Schaeffer, Nucl. Phys. A635, 231 (1998).
- (50) M. Bender, G. F. Bertsch, and P.-H. Heenen, Phys. Rev. C 78, 054312 (2008).
- (51) M. Bender, K. Bennaceur, T. Duguet, P.-H. Heenen, T. Lesinski, and J. Meyer, Phys. Rev. C 80, 064302 (2009).
- (52) M. V. Stoitsov, J. Dobaczewski, W. Nazarewicz, S. Pittel, and D. J. Dean, Phys. Rev. C 68, 054312 (2003).
- (53) M. Beiner, H. Flocard, N. Van Giai, and P. Quentin, Nucl. Phys. A 238, 29 (1975).
- (54) N. Van Giai and H. Sagawa, Phys. Lett. B 106, 379 (1981).
- (55) D. Vautherin and D. M. Brink, Phys. Rev. C 5, 626 (1972); D. Vautherin, Phys. Rev. C 7, 296 (1973).
- (56) G. Audi et al., Chinese Physics C 36, 1157 (2012); 1603 (2012).
- (57) R. Rodríguez-Guzmán, P. Sarriguren, and L. M. Robledo, Phys. Rev. C 82, 061302(R) (2010); Phys. Rev. C 83, 044307 (2011).
- (58) N. Schunck, J. Dobaczewski, J. McDonnell, J. Moré, W. Nazarewicz, J. Sarich, and M. V. Stoitsov, Phys. Rev. C 81, 024316 (2010).
- (59) V. Hellemans, P.-H. Heenen, and M. Bender, Phys. Rev. C 85, 014326 (2012).
- (60) B. Bally, B. Avez, M. Bender, and P.-H. Heenen, Phys. Rev. Lett. 113, 162501 (2014).
- (61) J. Krumlinde and P. Möller, Nucl. Phys. A417, 419 (1984).
- (62) R. Alvarez-Rodriguez, P. Sarriguren, E. Moya de Guerra, L. Pacearescu, A. Faessler, and F. Simkovic, Phys. Rev. C 70, 064309 (2004); F. Simkovic, L. Pacearescu, and A. Faessler, Nucl. Phys. A 733, 321 (2004).
- (63) P. Möller and J. Randrup, Nucl. Phys. A514, 1 (1990).
- (64) H. Homma, E. Bender, M. Hirsch, K. Muto, H. V. Klapdor-Kleingrothaus, and T. Oda, Phys. Rev. C 54, 2972 (1996).
- (65) P. Möller, B. Pfeiffer, and K.-L. Kratz, Phys. Rev. C 67, 055802 (2003).
- (66) P. Möller, R. Bengtsson, B. G. Carlsson, P. Olivius, T. Ichikawa, H. Sagawa, and A. Iwamoto, At. Data Nucl. Data Tables 94, 758 (2008).
- (67) M. Hirsch, A. Staudt, K. Muto, and H. V. Klapdor-Kleingrothaus, Nucl. Phys. A535, 62 (1991).
- (68) K. Muto, E. Bender, T. Oda, and H. V. Klapdor-Kleingrothaus, Z. Phys. A 341, 407 (1992).
- (69) A. Bohr and B. Mottelson, Nuclear Structure, Vols. I and II, (Benjamin, New York 1975).
- (70) N. B. Gove and M. J. Martin, Nucl. Data Tables 10, 205 (1971).
- (71) P. Sarriguren, R. Rodríguez-Guzmán, and L. M. Robledo, Phys. Rev. C 77, 064322 (2008).
- (72) L. M. Robledo, R. Rodríguez-Guzmán, and P. Sarriguren, J. Phys. G: Nucl. Part. Phys. 36, 115104 (2009).
- (73) R. Rodríguez-Guzmán, P. Sarriguren, L. M. Robledo, and S. Perez-Martin, Phys. Lett. B 691, 202 (2010).
- (74) B. Cheal and K. T. Flanagan, J. Phys. G: Nucl. Part. Phys. 37, 113101 (2010).
- (75) J. W. Negele, Phys. Rev. C 1, 1260 (1970); W. Bertozzi, J. Friar, J. Heisenberg, and J. W. Negele, Phys. Lett. B 41, 408 (1972).
- (76) I. Sick, Phys. Lett. B 576, 62 (2003).
- (77) T. R. Gentile and C. B. Crawford, Phys. Rev. C 83, 055203 (2011).
- (78) I. Angeli, At. Data Nucl. Data Tables 87, 185 (2004).
- (79) P. L. Lee, F. Boehm, and A. A. Hahn, Phys. Rev. C 17, 1859 (1978).
- (80) P. L. Lee et al., Phys. Rev. C 38, 2985 (1988).
- (81) J. Sauvage et al., Hyperfine Interactions 129, 303 (2000).