Multiwavelength observations of a partially eruptive filament on 2011 September 8
Abstract
In this paper, we report our multiwavelength observations of a partial filament eruption event in NOAA active region 11283 on 2011 September 8. A magnetic null point and the corresponding spine and separatrix surface are found in the active region. Beneath the null point, a sheared arcade supports the filament along the highly complex and fragmented polarity inversion line. After being activated, the sigmoidal filament erupted and split into two parts. The major part rose at the speeds of 90150 km s-1 before reaching the maximum apparent height of 115 Mm. Afterwards, it returned to the solar surface in a bumpy way at the speeds of 2080 km s-1. The rising and falling motions were clearly observed in the extreme-ultravoilet (EUV), UV, and H wavelengths. The failed eruption of the main part was associated with an M6.7 flare with a single hard X-ray source. The runaway part of the filament, however, separated from and rotated around the major part for 1 turn at the eastern leg before escaping from the corona, probably along large-scale open magnetic field lines. The ejection of the runaway part resulted in a very faint coronal mass ejection (CME) that propagated at an apparent speed of 214 km s-1 in the outer corona. The filament eruption also triggered transverse kink-mode oscillation of the adjacent coronal loops in the same AR. The amplitude and period of the oscillation were 1.6 Mm and 225 s. Our results are important for understanding the mechanisms of partial filament eruptions and provide new constraints to theoretical models. The multiwavelength observations also shed light on space weather prediction.
Online-only material: animations, color figures
1 Introduction
Solar prominences or filaments are cool and dense plasmas embedded in the million-Kelvin corona (Mackay et al., 2010). The plasmas originate from the direct injection of chromospheric materials into a preexisting filament channel, levitation of chromospheric mass into the corona, or condensation of hot plasmas from the chromospheric evaporation due to the thermal instability (Xia et al., 2011, 2012; Keppens & Xia, 2014; Zhou et al., 2014). Prominences are generally believed to be supported by the magnetic tension force of the dips in sheared arcades (Guo et al., 2010b; Terradas et al., 2015) or twisted magnetic flux ropes (MFRs; Su & van Ballegooijen, 2012; Sun et al., 2012a; Zhang et al., 2012a; Cheng et al., 2012, 2014a; Xia et al., 2014a, b). They can keep stable for several weeks or even months, but may get unstable after being disturbed. Large-amplitude and long-term filament oscillations before eruption have been observed by spaceborne telescopes (Chen et al., 2008; Li & Zhang, 2012; Zhang et al., 2012b; Bi et al., 2014; Shen et al., 2014) and reproduced by numerical simulations (Zhang et al., 2013), which makes filament oscillation another precursor for coronal mass ejections (CMEs; Chen, 2011) and the accompanying flares. When the twist of a flux rope supporting a filament exceeds the threshold value (2.53.5), it will also become unstable and erupt due to the ideal kink instability (KI; Hood & Priest, 1981; Kliem et al., 2004; Török et al., 2004, 2010; Fan, 2005; Srivastava et al., 2010; Aschwanden, 2011; Kumar et al., 2012). However, whether the eruption of the kink-unstable flux rope becomes failed or ejective depends on how fast the overlying magnetic field declines with height (Török & Kliem, 2005; Liu, 2008; Kumar et al., 2010). When the decay rate of the background field exceeds a critical value, the flux rope will lose equilibrium and erupt via the so-called torus instability (TI; Kliem & Török, 2006; Jiang et al., 2014; Amari et al., 2014). On the other hand, if the confinement from the background field is strong enough, the filament will decelerate to reach the maximum height before falling back to the solar surface, which means the eruption is failed (Ji et al., 2003; Liu et al., 2009; Guo et al., 2010a; Kumar et al., 2011; Song et al., 2014; Joshi et al., 2013, 2014).
In addition to the successful and failed eruptions, there are partial filament eruptions (Gilbert et al., 2007; Liu et al., 2007). After examining 54 H prominence activities, Gilbert et al. (2000) found that a majority of the eruptive prominences show separation of escaping material from the bulk of the prominence; the latter initially lifted away from and then fell back to the solar surface. To explain the partial filament eruptions, the authors proposed a cartoon model in which magnetic reconnection occurs inside an inverse-polarity flux rope, leading to the separation of the escaping portion of the prominence and the formation of a second X-type neutral line in the upper portion of the prominence. The inner splitting and subsequent partial prominence eruption is also observed by Shen et al. (2012). Gilbert et al. (2001) interpreted an active prominence with the process of vertical reconnection between an inverse-polarity flux rope and an underlying magnetic arcade. Liu et al. (2008) reported a partial filament eruption characterised by a quasi-static, slow phase and a rapid kinking phase showing a bifurcation of the filament. The separation of the filament, the extreme-ultravoilet (EUV) brightening at the separation location, and the surviving sigmoidal structure provide convincing evidences that magnetic reconnection occurs within the body of filament (Tripathi et al., 2013). Gibson & Fan (2006a, b) carried out three-dimensional (3D) numerical simulations to model the partial expulsion of a MFR. After multiple reconnections at current sheets that form during the eruption, the rope breaks in an upper, escaping rope and a lower, surviving rope. The “partially-expelled flux rope” (PEFR) model has been justified observationally (Tripathi et al., 2009). Tripathi et al. (2006) observed a distinct coronal downflow following a curved path at the speed of 150 km s-1 during a CME-associated prominence eruption. Their observation provides support for the pinching off of the field lines drawn-out by the erupting prominences and the contraction of the arcade formed by the reconnection. Similar multithermal downflow at the speed of 380 km s-1 starting at the cusp-shaped structures where magnetic reconnection occurred inside the erupting flux rope that led to its bifurcation was reported by Tripathi et al. (2007). Liu et al. (2012) studied a flare-associated partial eruption of a double-decker filament. Cheng et al. (2014b) found that a stable double-decker MFR system existed for hours prior to the eruption on 2012 July 12. After entering the domain of instability, the high-lying MFR impulsively erupted to generate a fast CME and GOES X1.4 class flare; while the low-lying MFR remained behind and continuously maintained the sigmoidicity of the active region (AR). From the previous literatures, we can conclude that magnetic reconnection and the release of free energy involve in most of the partial filament eruptions. However, the exact mechanism of partial eruptions, which is of great importance to understanding the origin of solar eruptions and forecasting space weather, remain unclear and controversial.
In this paper, we report multiwavelength observations of a partial filament eruption and the associated CME and M6.7 flare in NOAA AR 11283 on 2011 September 8. The AR emerged from the eastern solar limb on 2011 August 30 and lasted for 14 days. Owing to its extreme complexity, it produced a couple of giant flares and CMEs during its lifetime (Feng et al., 2013; Dai et al., 2013; Jiang et al., 2014; Liu et al., 2014; Li et al., 2014; Ruan et al., 2014). In Section 2, we describe the data analysis using observations from the Big Bear Solar Observatory (BBSO), SOHO, Solar Dynamics Observatory (SDO), Solar Terrestrial Relation Observatory (STEREO; Kaiser, 2005), GOES, Reuven Ramaty High-Energy Solar Spectroscopic Imager (RHESSI; Lin et al., 2002), and WIND. Results and discussions are presented in Section 3 and Section 4. Finally, we draw our conclusion in Section 5.
2 Instruments and data analysis
2.1 BBSO and SOHO observations
On September 8, the dark filament residing in the AR was most clearly observed at H line center (6563 Å) by the ground-based telescope in BBSO. During 15:3016:30 UT, the filament rose and split into two parts. The major part lifted away and returned to the solar surface, while the runaway part separated from and escaped the major part, resulting in a very faint CME recorded by the SOHO Large Angle Spectroscopic Coronagraph (LASCO; Brueckner et al., 1995) CME catalog111http://cdaw.gsfc.nasa.gov/CME_list/. The white light (WL) images observed by the LASCO/C2 with field-of-view (FOV) of 26 solar radii () were calibrated using the c2_calibrate.pro in the Solar Software (SSW).
2.2 SDO observations
The partial filament eruption was clearly observed by the Atmospheric Imaging Assembly (AIA; Lemen et al., 2012) aboard SDO with high cadences and resolutions. There are seven EUV filters (94, 131, 171, 193, 211, 304, and 335 Å) and two UV filters (1600 Å and 1700 Å) aboard AIA to achieve a wide temperature coverage (). The AIA level_1 fits data were calibrated using the standard program aia_prep.pro. The images observed in different wavelengths were coaligned carefully using the cross-correlation method.
To investigate the 3D magnetic configurations before and after the eruption, we employed the line-of-sight (LOS) and vector magnetograms from the Helioseismic and Magnetic Imager (HMI; Scherrer et al., 2012) aboard SDO. The 180∘ ambiguity of the transverse field was removed by assuming that the field changes smoothly at the photosphere (Guo et al., 2013). We also performed magnetic potential field and non-linear force free field (NLFFF) extrapolations using the optimization method as proposed by Wheatland et al. (2000) and as implemented by Wiegelmann (2004). The FOV for extrapolation was 55854662 to cover the whole AR and make sure the magnetic flux was balanced, and the data were binned by 22 so that the resolution became 2.
2.3 STEREO and WIND observations
The eruption was also captured from different perspectives by the Extreme-Ultraviolet Imager (EUVI) and COR1222http://cor1.gsfc.nasa.gov/catalog/cme/2011/ coronagraph of the Sun Earth Connection Coronal and Heliospheric Investigation (SECCHI; Howard et al., 2008) instrument aboard the ahead satellite (STA hereafter) and behind satellite (STB hereafter) of STEREO. The COR1 has a smaller FOV of 1.34.0 compared with LASCO/C2, which is favorable for the detection of early propagation of CMEs. On September 8, the twin satellites (STA and STB) had separation angles of 103∘ and 95∘ with the Earth.
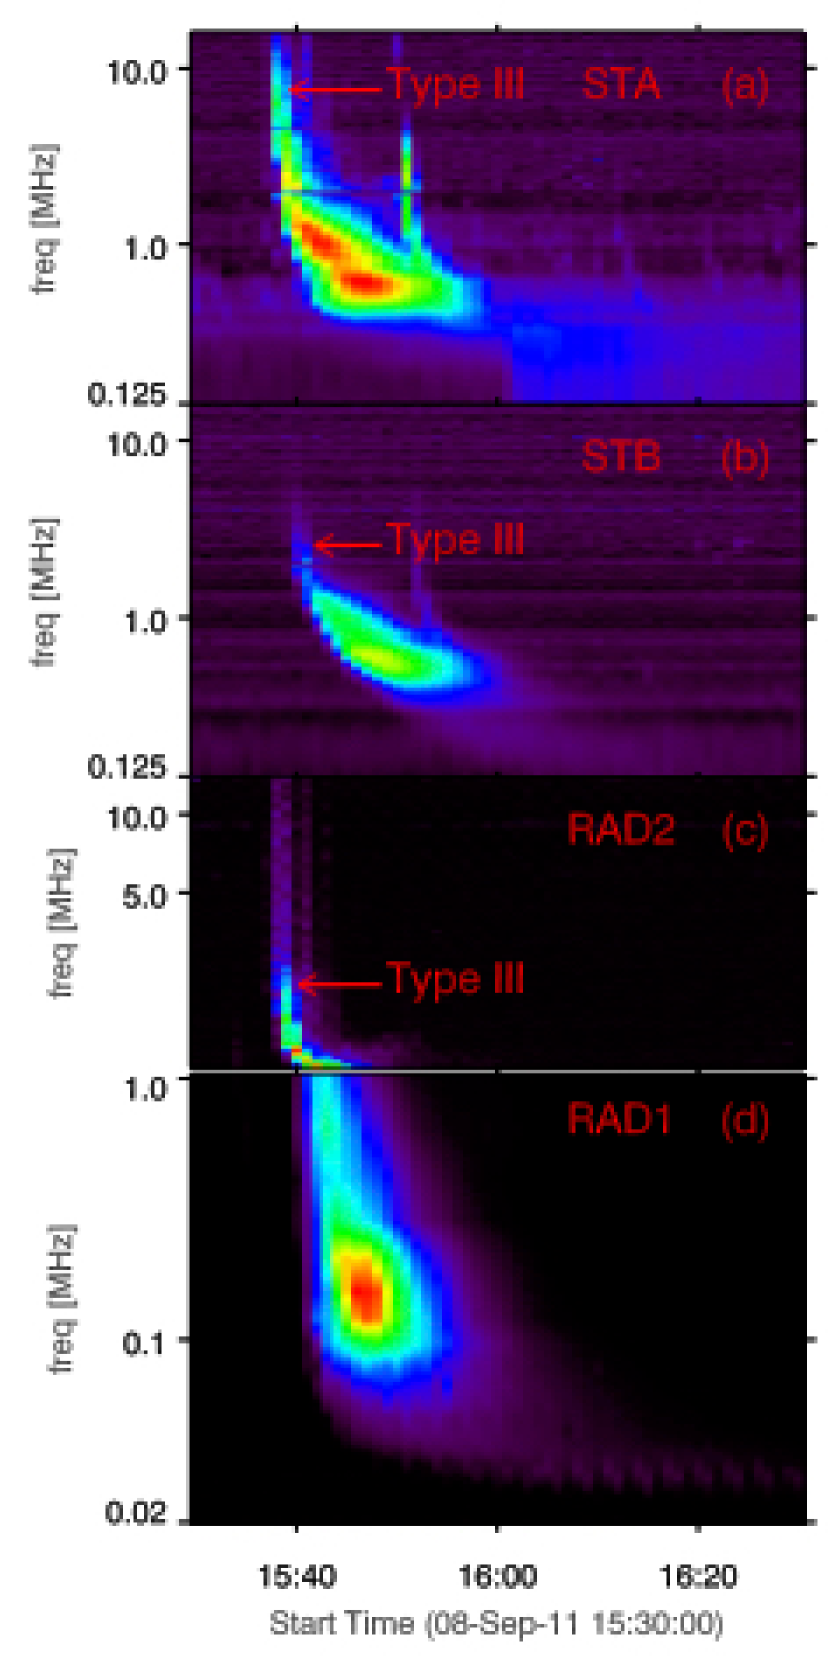
The presence of open magnetic field lines within the AR was confirmed indirectly by the evidence of type \@slowromancapiii@ burst in the radio dynamic spectra. The spectra were obtained by the S/WAVES (Bougeret et al., 2008) on board STEREO and the WAVES instrument (Bougeret et al., 1995) on board the WIND spacecraft. The frequency of S/WAVES ranges from 2.5 kHz to 16.025 MHz. The WAVES has two radio detectors: RAD1 (0.021.04 MHz) and RAD2 (1.07513.825 MHz).
2.4 GOES and RHESSI observations
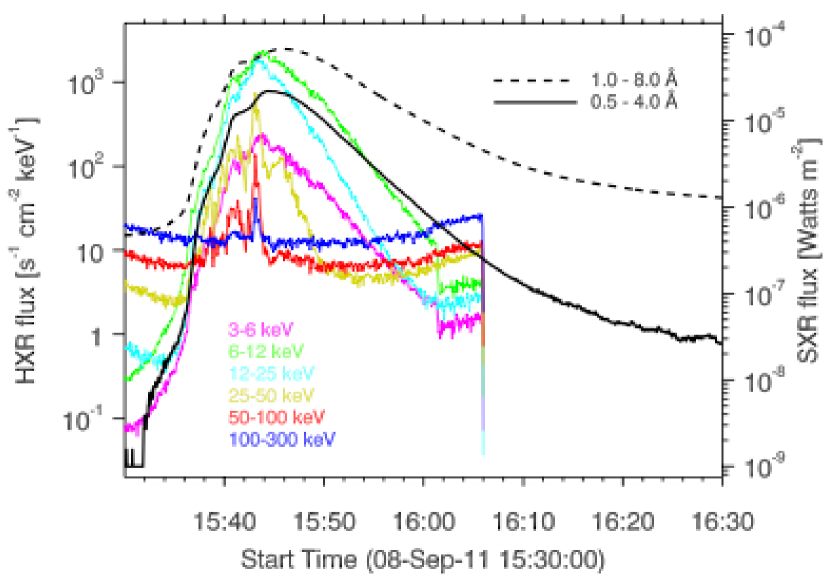
The accompanying M6.7 flare was obviously identified in the GOES soft X-ray (SXR) light curves in 0.54.0 Å and 18 Å. To figure out where the accelerated nonthermal particles precipitate, we also made hard X-ray (HXR) images and light curves at different energy bands (36, 612, 1225, 2550, and 50100 keV) using the observations of RHESSI. The HXR images were generated using the CLEAN method with integration time of 10 s. The observing parameters are summarized in Table 1.
3 Results
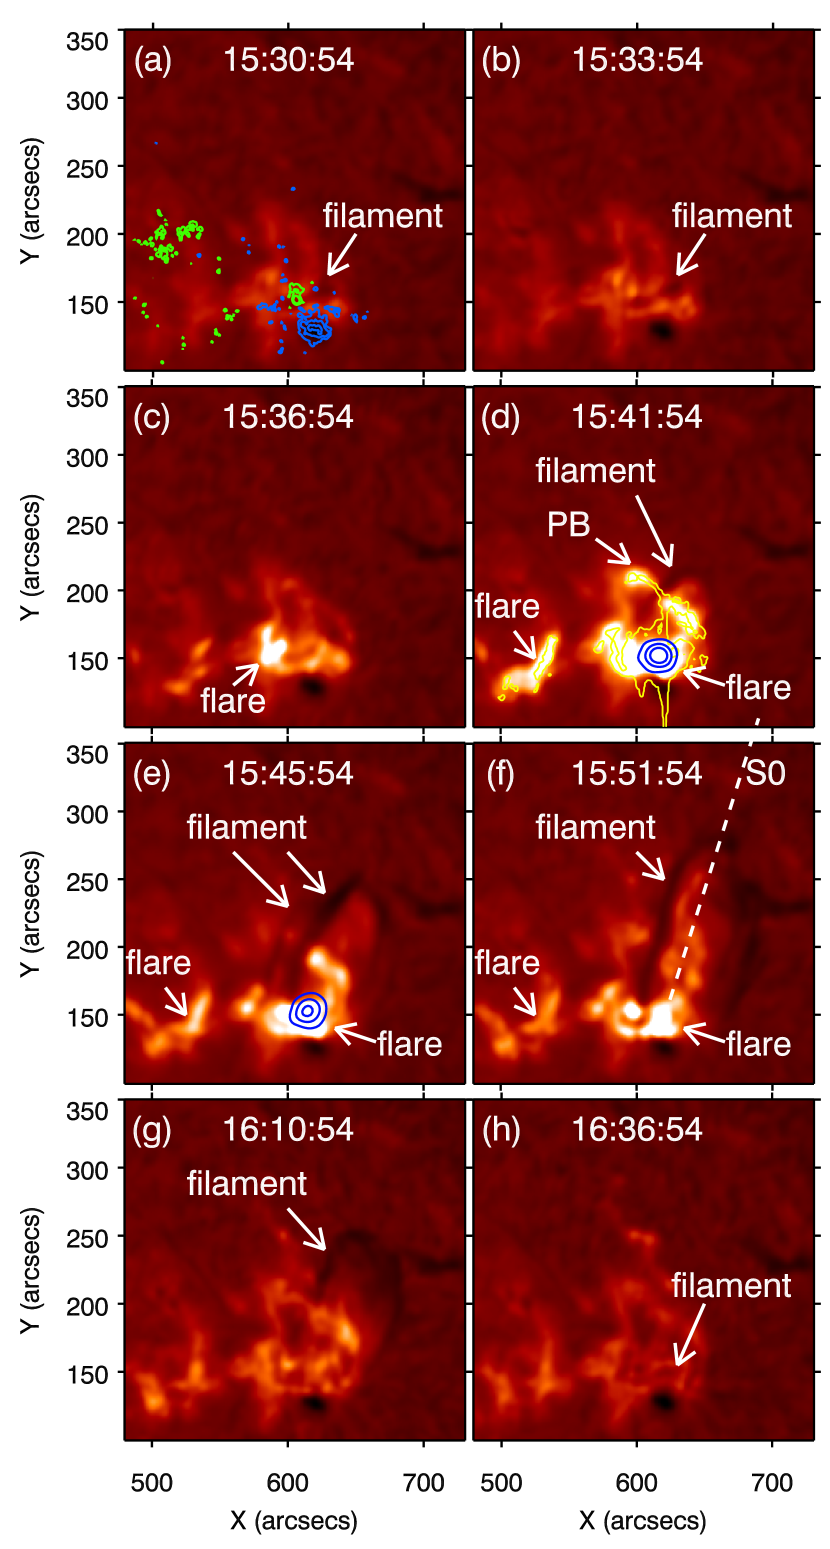
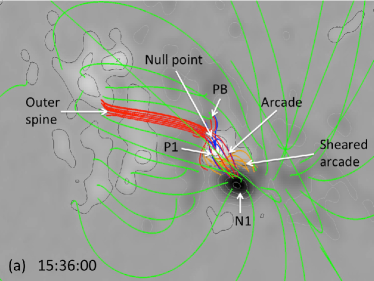
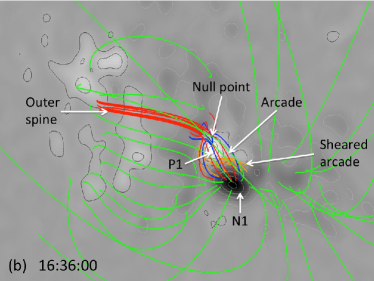
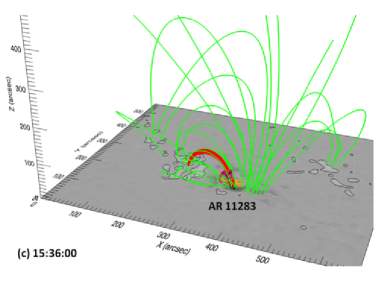
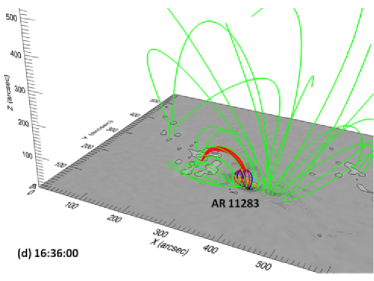
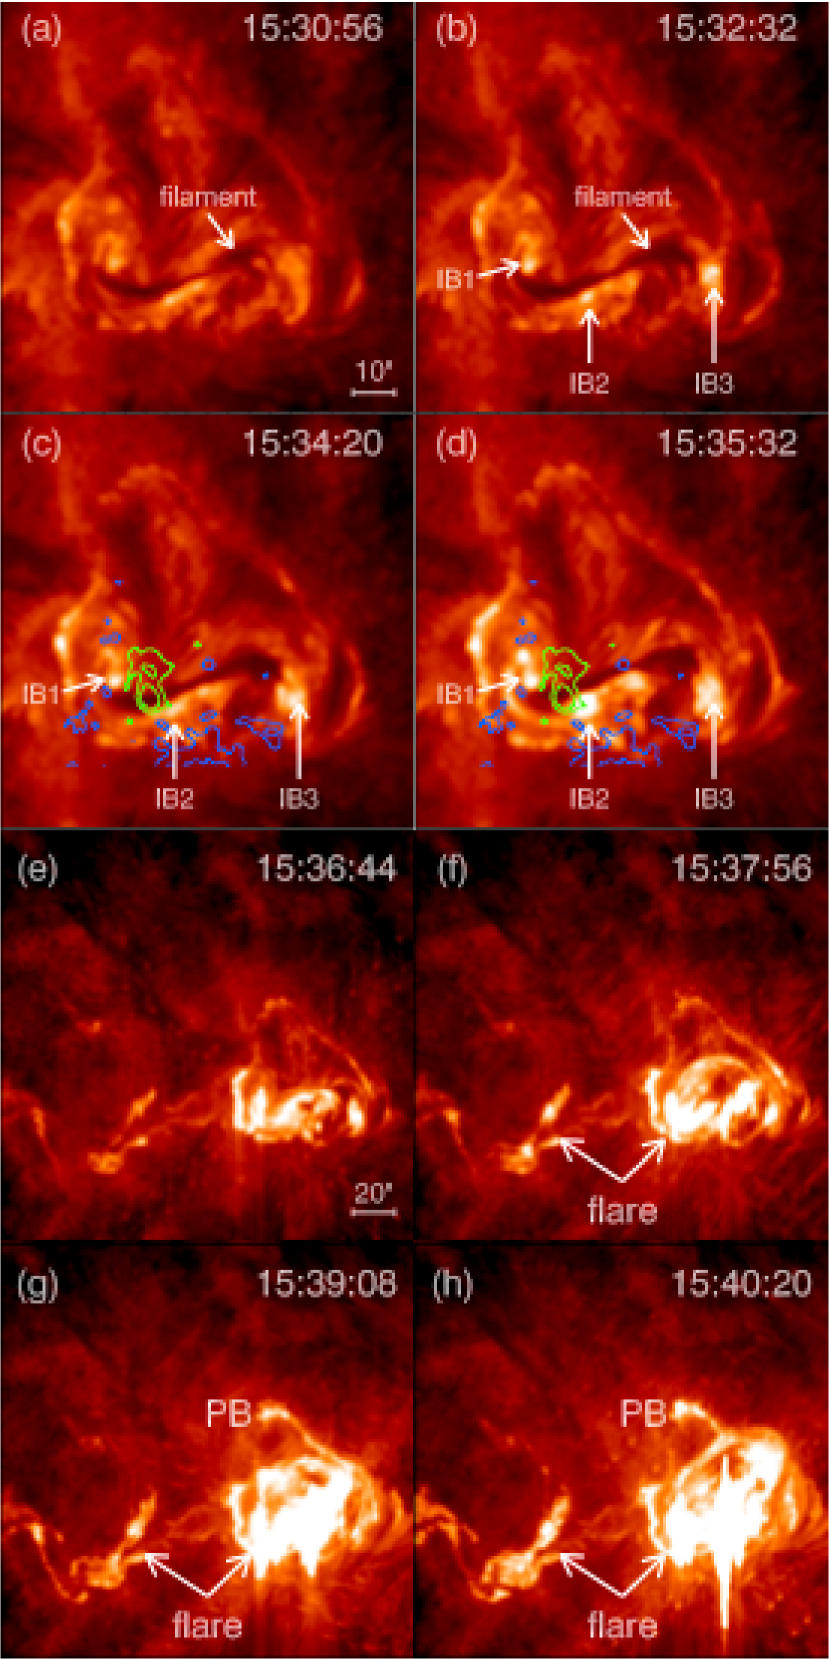
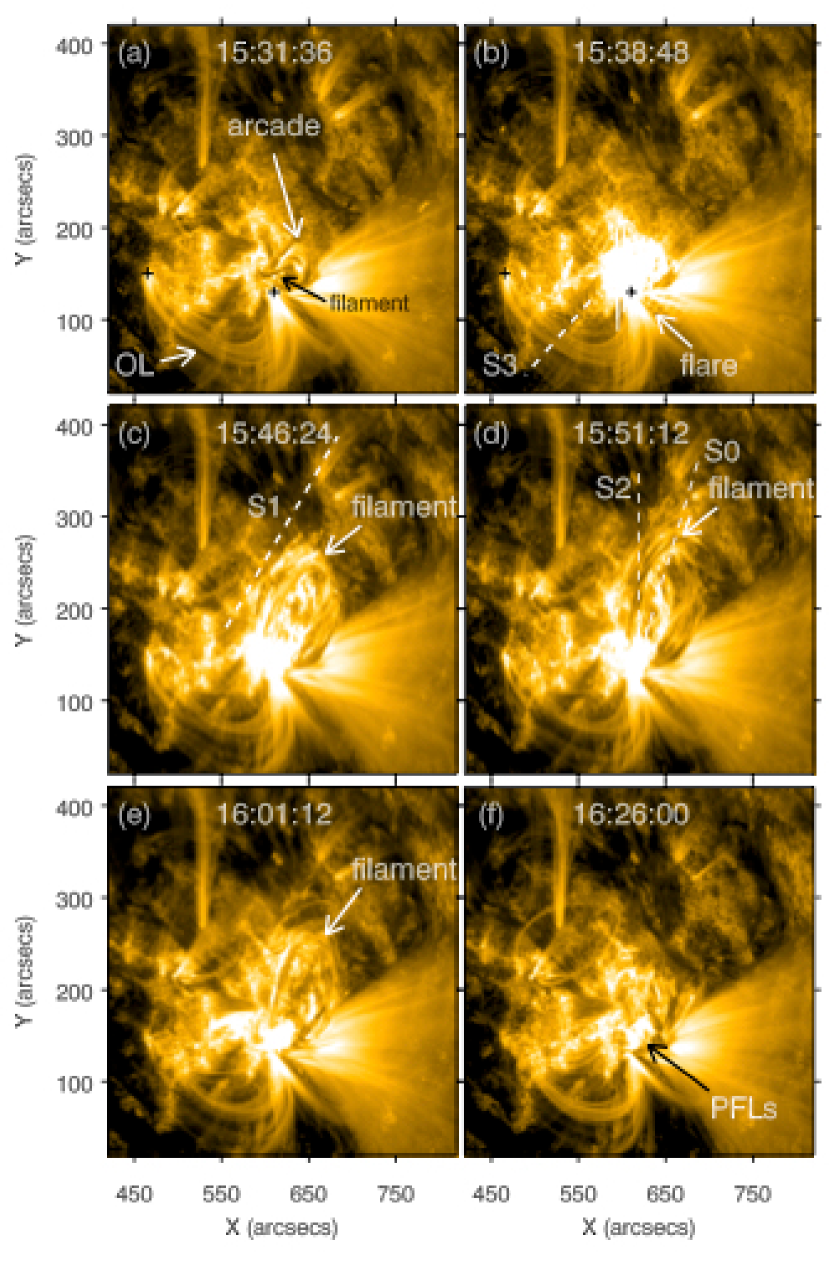
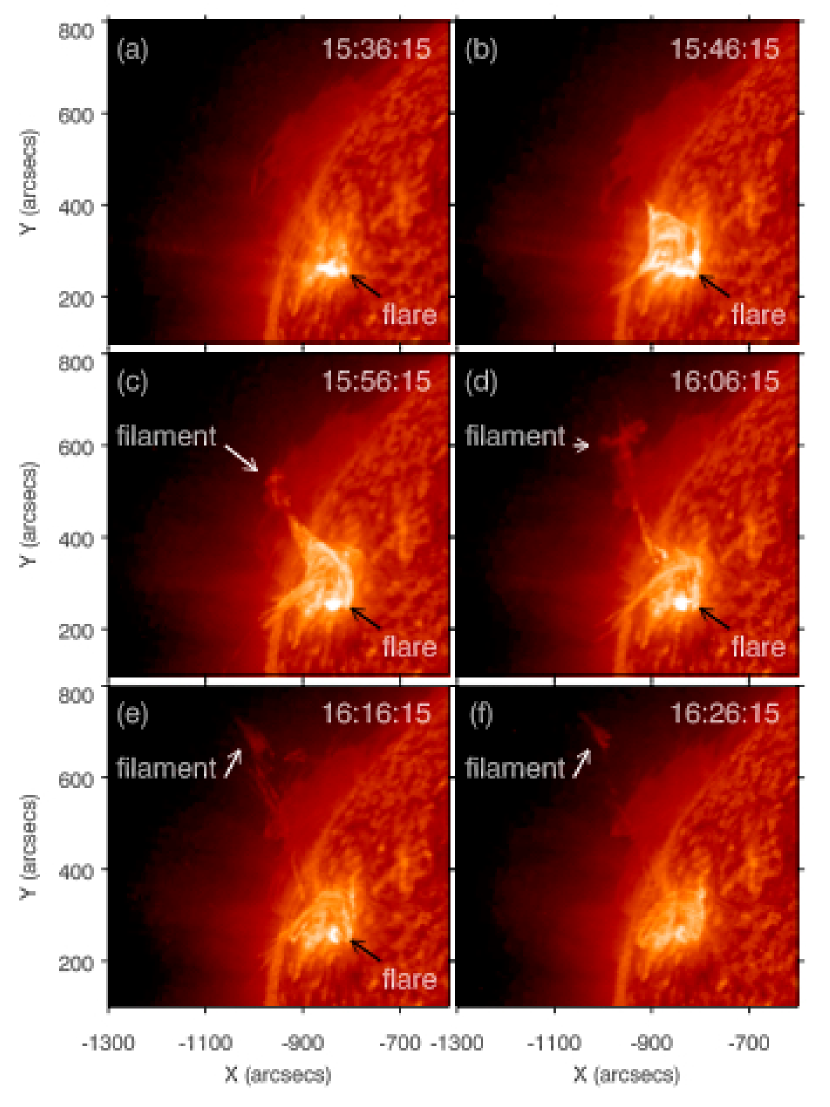
Figure 1 shows eight snapshots of the H images to illustrate the whole evolution of the filament (see also the online movie Animation1.mpg). Figure 1(a) displays the H image at 15:30:54 UT before eruption. It is overlaid with the contours of the LOS magnetic field, where green (blue) lines stand for positive (negative) polarities. The dark filament that is 39 Mm long resides along the polarity inversion line (PIL). The top panels of Figure 2 demonstrate the top-view of the 3D magnetic configuration above the AR at the beginning and after eruption, with the LOS magnetograms located at the bottom boundary. Using the same method described in Zhang et al. (2012c), we found a magnetic null point and the corresponding spine and separatrix surface. The normal magnetic field lines are denoted by green lines. The magnetic field lines around the outer/inner spine and the separatrix surface (or arcade) are represented by red/blue lines. Beneath the null point, the sheared arcades supporting the filament are represented by orange lines. The spine is rooted in the positive polarity (P1) that is surrounded by the negative polarities (N1 and PB). It extends in the northeast direction and connects the null point with a remote place on the solar surface. Such magnetic configuration is quite similar to those reported by Sun et al. (2012b), Jiang et al. (2013), and Mandrini et al. (2014).
As time goes on, the filament rose and expanded slowly (Figure 1(b)). The initiation process is clearly revealed by the AIA 304 Å observation (see the online movie Animation2.mpg). Figure 3 shows eight snapshots of the 304 Å images. Initial brigtenings (IB1, IB2, and IB3) appeared near the ends and center of the sigmoidal filament, implying that magnetic reconnection took place and the filament got unstable (Figure 3(b)-(d)). Such initial brightenings were evident in all the EUV wavelengths. With the intensities of the brigtenings increasing, the dark filament rose and expanded slowly, squeezing the overlying arcade field lines. Null-point magnetic reconnection might be triggered when the filament reached the initial height of the null point (15 Mm), leading to impulsive brightenings in H (Figure 1(c)-(d)) and EUV (Figure 3(e)-(h)) wavelengths and increases in SXR and HXR fluxes (Figure 4). The M6.7 flare entered the impulsive phase. The bright and compact flare kernel pointed by the white arrow in Figure 1(c) extended first westward and then northward, forming a quasi-circular ribbon at 15:42 UT (Figure 1(d)), with the intensity contours of the HXR emissions at 1225 keV superposed. There was only one HXR source associated with the flare, and the source was located along the flare ribbon with the strongest H emission, which is compatible with the fact that the footpoint HXR emissions come from the nonthermal bremsstrahlung of the accelerated high-energy electrons after penetrating into the chromosphere. The flare demonstrates itself not only around the filament but also at the point-like brightening (PB hereafter) and the V-shape ribbon to the left of the quasi-circular ribbon. Since the separatrix surface intersects with the photosphere at PB to the north and the outer spine intersects with the photosphere to the east (Figure 2(a)), it is believed that nonthermal electrons accelerated by the null-point magnetic reconnection penetrated into the lower atmosphere not only at the quasi-circular ribbon, but also at PB and the V-shape ribbon.
Figure 4 shows the SXR (black solid and dashed lines) and HXR (colored solid lines) light curves of the flare. The SXR fluxes started to rise rapidly at 15:32 UT and peaked at 15:45:53 UT for 18 Å and 15:44:21 UT for 0.54.0 Å. The HXR fluxes below 25 keV varied smoothly like the SXR fluxes, except for earlier peak times at 15:43:10 UT. The HXR fluxes above 25 keV, however, experienced two small peaks that imply precursor release of magnetic energy and particle acceleration at 15:38:36 UT and 15:41:24 UT and a major peak at 15:43:10 UT. The time delay between the SXR and HXR peak times implies the possible Neupert effect for this event (Ning & Cao, 2010). The main phase of the flare sustained until 17:00 UT, indicating that the flare is a long-duration event.
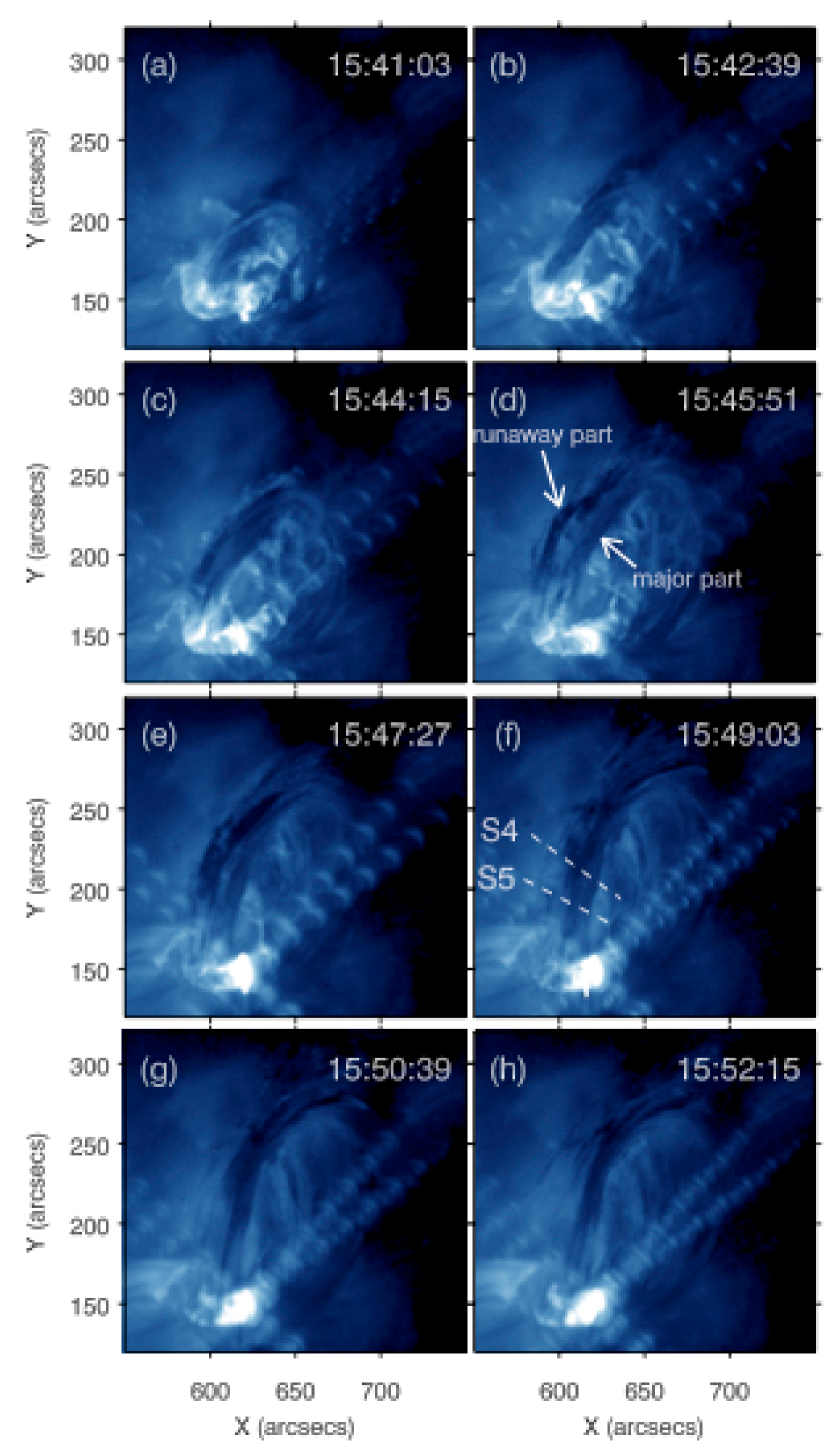
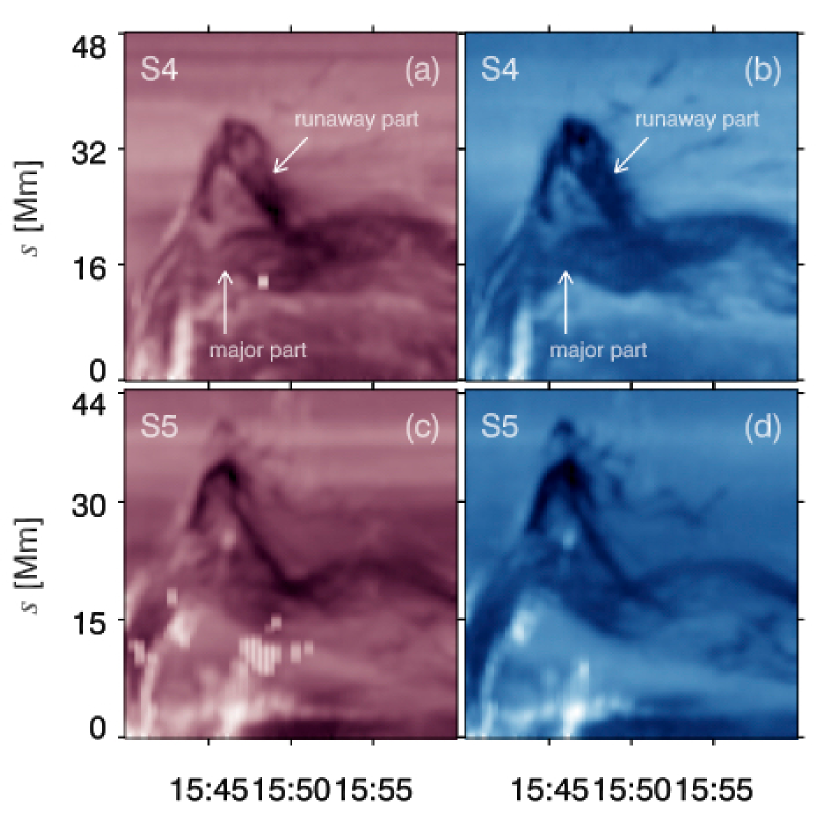
During the flare, the filament continued to rise and split into two branches at the eastern leg around 15:46 UT (Figure 1(e)), the right of which is thicker and darker than the left one. Such a process is most clearly revealed by the AIA 335 Å observation (see the online movie Animation3.mpg). Figure 5 displays eight snapshots of the 335 Å images. It is seen that the dark filament broadened from 15:42:30 UT and completely split into two branches around 15:45:51 UT. We define the left and right branches as the runaway part and major part of the filament. The two interwinding parts also underwent rotation (panels (d)-(h)). Meanwhile, the plasma of the runaway part moved in the northwest direction and escaped. To illustrate the rotation, we derived the time-slice diagrams of the two slices (S4 and S5 in panel (f)) that are plotted in Figure 6. The upper (lower) panels represent the diagrams of S4 (S5), and the left (right) panels represent the diagrams for 211 Å (335 Å). in the diagrams stands for the southwest endpoints of the slices. The filament began to split into two parts around 15:42:30 UT, with the runaway part rotating round the eastern leg of the major part for 1 turn until 15:55 UT.
During the eruption, the runaway branch of the filament disappeared (Figure 1(f)). The major part, however, fell back to the solar surface after reaching the maximum height around 15:51 UT, suggesting that the eruption of the major part of the filament was failed. The remaining filament after the flare was evident in the H image (Figure 1(h)). NLFFF modelling shows that the magnetic topology was analogous to that before the flare, with the height of the null point slightly increased by 0.4 Mm (Figure 2(b)).
Figure 7 shows six snapshots of the 171 Å images. The rising and expanding filament triggered the M-class flare and the kink-mode oscillation of the adjacent large-scale coronal loops within the same AR (see the online movie Animation4.mpg). With the filament increasing in height, part of its material was ejected in the northwest direction represented by “S1” in panel (c). After reaching the maximum height at 15:51:12 UT, the major part of the filament returned to the solar surface. The bright cusp-like post-flare loops (PFLs) in the main phase of the flare are clearly observed in all the EUV filters, see also Figure 7(f).
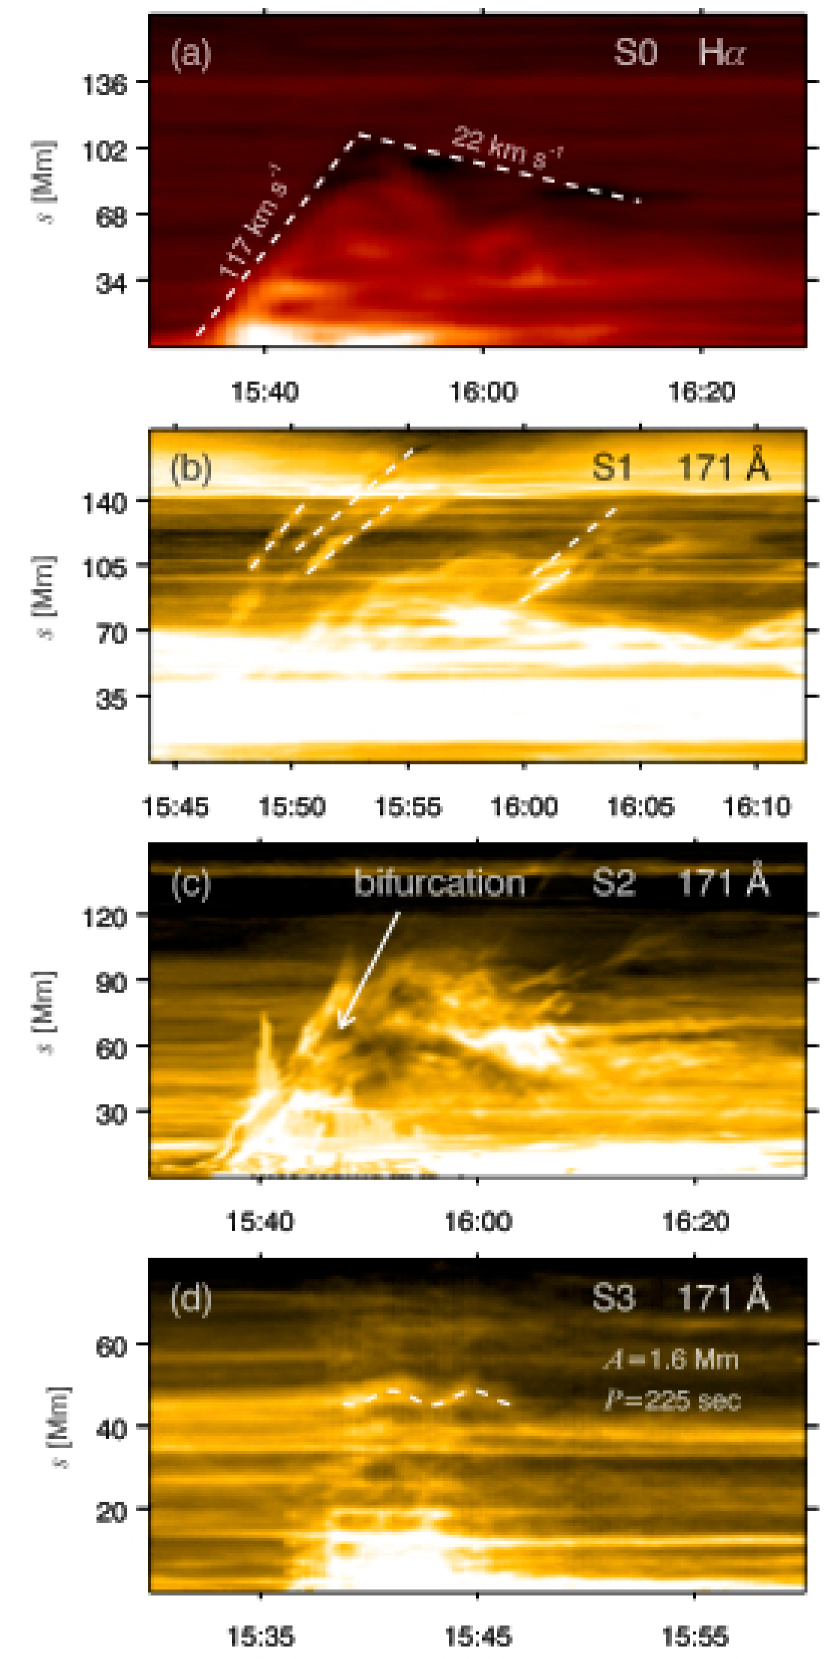
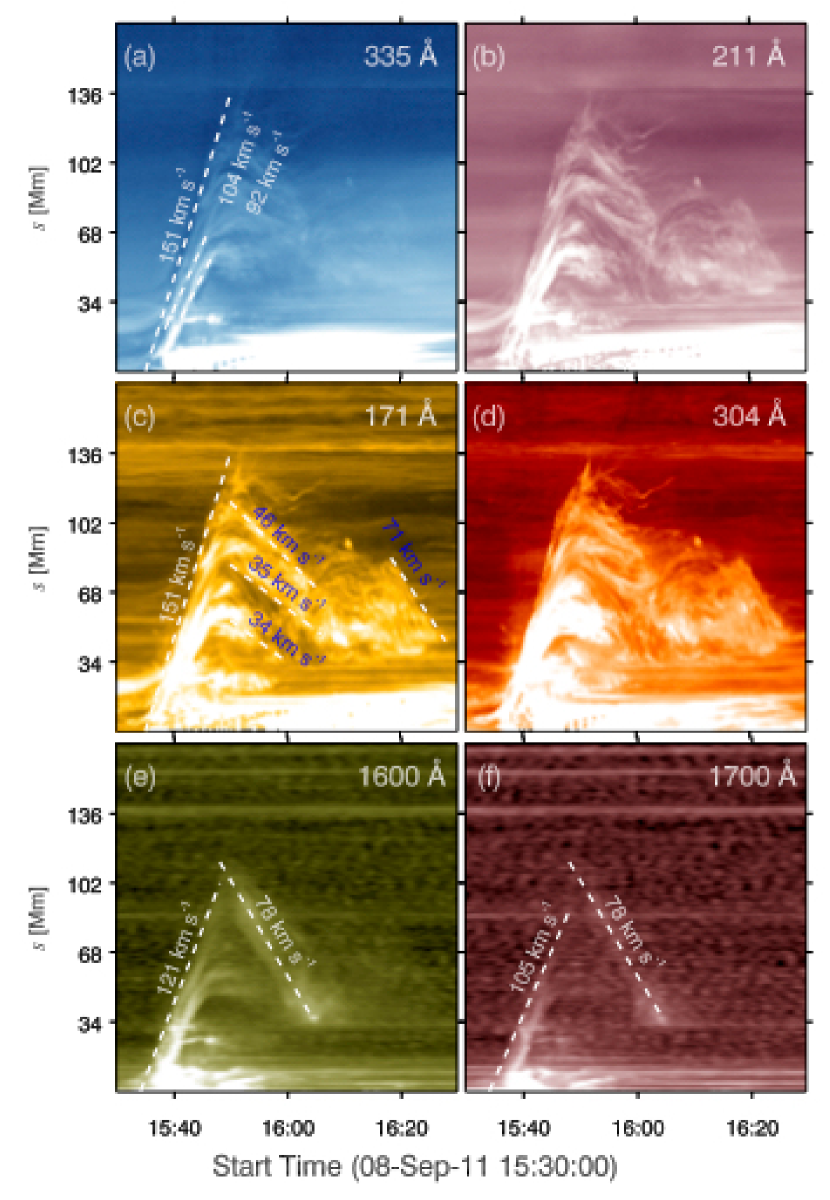
To illustrate the eruption and loop oscillation more clearly, we extracted four slices. The first slice, S0 in Figure 1(f) and Figure 7(d), is 170 Mm in length. It starts from the flare site and passes through the apex of the major part of the filament. The time-slice diagram of S0 in H is displayed in Figure 8(a). The filament started to rise rapidly at 15:34:30 UT with a constant speed of 117 km s-1. After reaching the peak height () of 115 Mm at 15:51 UT, it fell back to the solar surface in a bumpy way until 16:30 UT. Using a linear fitting, we derived the average falling speed (22 km s-1) of the filament in H wavelength. The time-slice diagram of S0 in UV and EUV passbands are presented in Figure 9. We selected two relatively hot filters (335 Å and 211 Å in the top panels), two warm filters (171 Å and 304 Å in the middle panels), and two cool filters (1600 Å and 1700 Å in the bottom panels), respectively. Similar to the time-slice diagram in H (Figure 8(a)), the filament rose at apparent speeds of 92151 km s-1 before felling back in an oscillatory way at the speeds of 3446 km s-1 during 15:5116:10 UT and 71 km s-1 during 16:1816:30 UT (Figure 9(a)-(d)). The falling speeds in UV wavelengths are 78 km s-1 during 15:5116:10 UT (Figure 9(e)-(f)). The times when the major part of the filament reached maximum height in UV and EUV passbands, 15:51 UT, are consistent with that in H. The later falling phase during 16:1816:30 UT is most obvious in the warm filters. The downflow of the surviving filament in an oscillatory way was also observed during a sympathetic filament eruption (Shen et al., 2012).
Owing to the lower time cadence of BBSO than AIA, the escaping process of the runaway part of the filament in Figure 1(e)-(f) was detected by AIA. We extracted another slice S1 that is 177 Mm in length along the direction of ejection (Figure 7(c)). Mm and Mm represent the southeast and northwest endpoints of the slice. The time-slice diagram of S1 in 171 Å is displayed in Figure 8(b). Contrary to the major part, the runaway part of the filament escaped successfully from the corona at the speeds of 125255 km s-1 without returning to the solar surface. The intermittent runaway process during 15:4516:05 UT was obviously observed in most of the EUV filters. We extracted another slice S2 that also starts from the flare site and passes through both parts of the filament (Figure 7(d)). The time-slice diagram of S2 in 171 Å is drawn in Figure 8(c). As expected, the diagram features the bifurcation of the filament as pointed by the white arrow, i.e., the runaway part escaped forever while the major part moved on after bifurcation and finally fell back.
The eruption of the filament triggered transverse kink oscillation of the adjacent coronal loops (OL in Figure 7(a)). The direction of oscillation is perpendicular to the initial loop plane (see the online movie Animation4.mpg). We extracted another slice S3 that is 80 Mm in length across the oscillating loops (Figure 7(b)). Mm and Mm represent the northwest and southeast endpoints of the slice. The time-slice diagram of S3 in 171 Å is shown in Figure 8(d), where the oscillation pattern during 15:3815:47 UT is evidently demonstrated. The OL moved away from the flare site during 15:3815:41 UT before returning to the initial position and oscillating back and forth for 2 cycles. By fitting the pattern with a sinusoidal function as marked by the white dashed line, the resulting amplitude and period of the kink oscillation were 1.6 Mm and 225 s. We also extracted several slices across the OL and derived the time-slice diagrams, finding that the coronal loops oscillated in phase and the mode was fundamental. The initial velocity amplitude of the oscillation was 44.7 km s-1. The speed of propagation of the mode , where is the loop length, is the period, is the Alfvén wave speed, and and are the plasma densities inside and outside the loop (Nakariakov et al., 1999; Nakariakov & Ofman, 2001; White & Verwichte, 2012). In Figure 7(a), we denote the footpoints of the OL with black crosses that are 106.1 Mm away. Assuming a semi-circular shape, the length of the loop Mm and km s-1. Using the same value of , we derived km s-1. In addition, we estimated the electron number density of the OL to be 2.5 cm-3 based on the results of NLFFF extrapolation in Figure 2(a). The kink-mode oscillation of the loops was best observed in 171 Å, indicating that the temperatures of loops were 0.8 MK.
The escaping part of the filament was also clearly observed by STA/EUVI. Figure 10 shows six snapshots of the 304 Å images, where the white arrows point to the escaping filament. During 15:4616:30 UT, the material moved outwards in the northeast direction without returning to the solar surface. The bright M6.7 flare pointed by the black arrows is also quite clear.
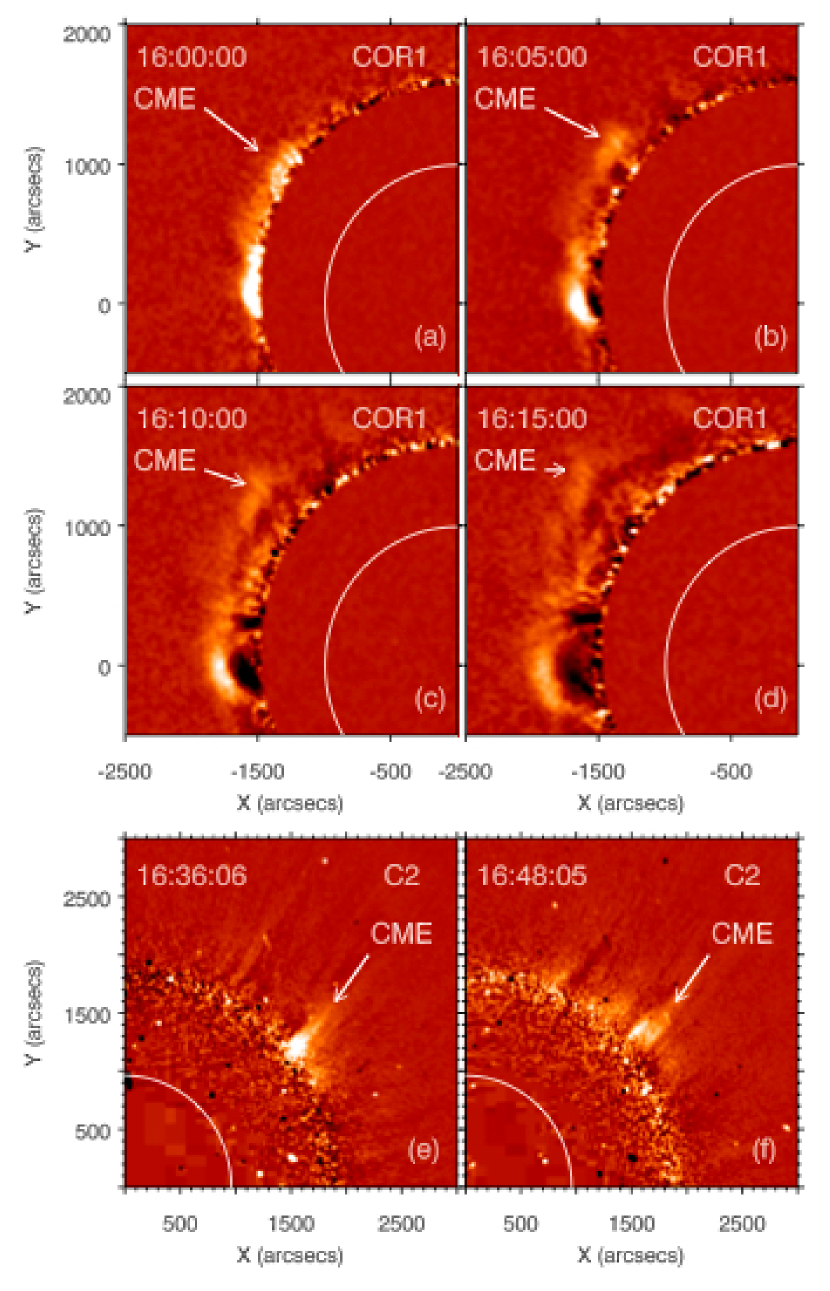
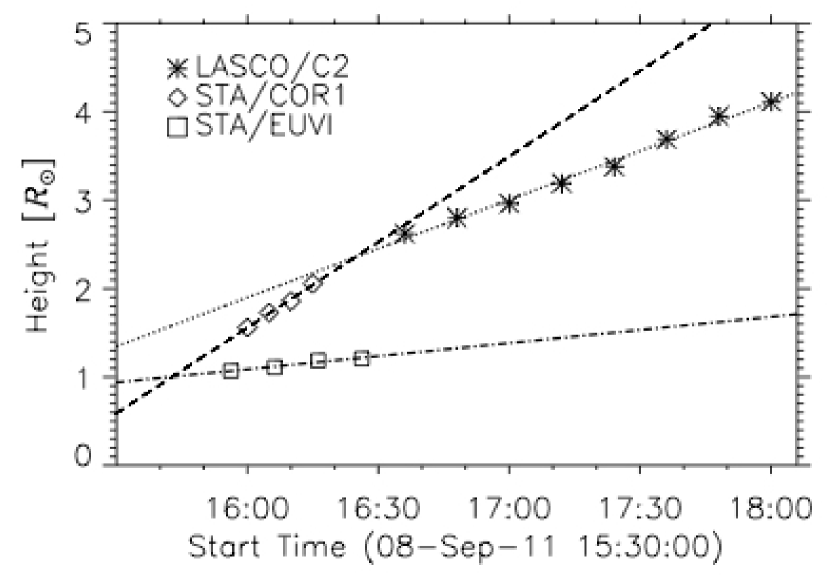
The runaway part of the filament resulted in a very faint CME observed by the WL coronagraphs. Figure 11(a)-(d) show the running-difference images of STA/COR1 during 16:0016:15 UT. As pointed by the arrows, the CME first appeared in the FOV of STA/COR1 at 16:00 UT and propagated outwards at a nearly constant speed, with the contrast between CME and the background decreasing as time goes on. The propagation direction of the CME is consistent with that of the runaway filament in Figure 10. Figure 11(e)-(f) show the running-difference images of LASCO/C2 during 16:3616:48 UT. The faint blob-like CME first appeared in the FOV of C2 at 16:36 UT and propagated in the same direction as that of the escaping filament observed by AIA in Figure 7(c). The central position angle and angular width of the CME observed by C2 are 311∘ and 37∘. The linear velocity of the CME is 214 km s-1. The time-height profiles of the runaway filament observed by STA/EUVI (boxes) and the corresponding CME observed by STA/COR1 (diamonds) and LASCO/C2 (stars) are displayed in Figure 12. The apparent propagating velocities represented by the slopes of the lines are 60, 358, and 214 km s-1, respectively. Taking the projection effect into account, the start times of the filament eruption and the CME observed by LASCO/C2 and STA/COR1 from the lower corona () are approximately coincident with each other. In the CDAW catalog, the preceding and succeeding CMEs occurred at 06:12 UT and 18:36 UT on September 8. In the COR1 CME catalog, the preceding and succeeding CMEs occurred slightly earlier at 05:45 UT and 18:05 UT on the same day, which is due to the smaller FOV of COR1 than LASCO/C2. Therefore, the runaway part of the filament was uniquely associated with the CME during 16:0018:00 UT.
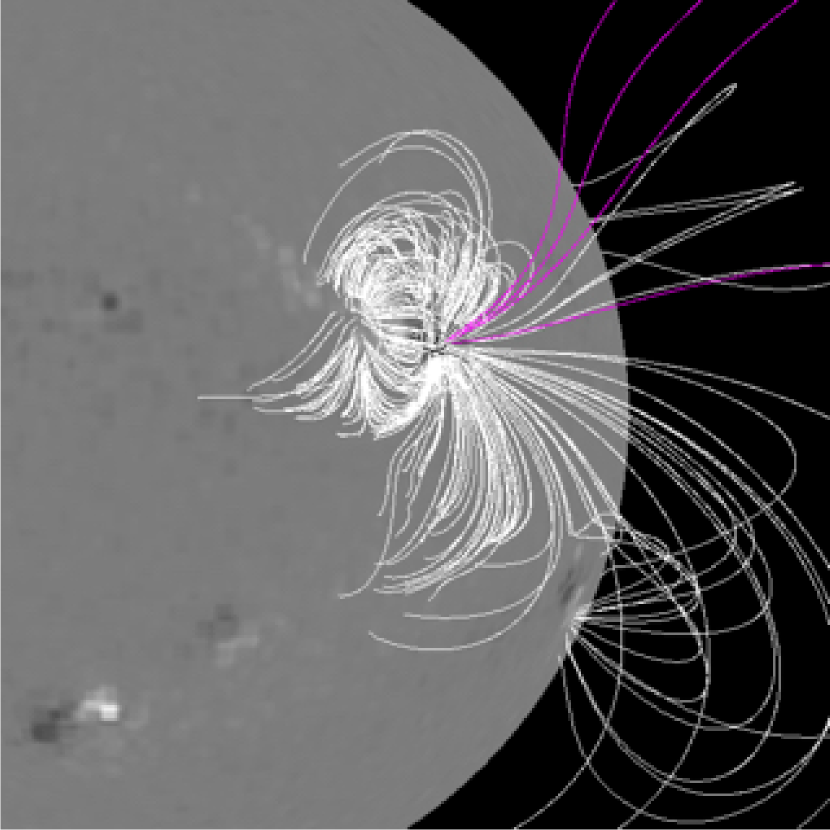
Then, a question is raised: How can the runaway part of the filament successfully escape from the corona and give rise to a CME? We speculate that open magnetic field lines provide a channel. In order to justify the speculation, we turn to the large-scale magnetic field calculated by the potential field source surface (PFSS; Schatten et al., 1969; Schrijver & De Rosa, 2003) modelling and the radio dynamic spectra from the S/WAVES and WAVES instruments. In Figure 13, we show the magnetic field lines whose footpoints are located in AR 11283 at 12:04 UT before the onset of flare/CME event. The open and closed field lines are represented by the purple and white lines. It is clear that open field lines do exist in the AR and their configuration accords with the directions of the escaping part of filament observed by AIA and the CME observed by C2. The radio dynamic spectra from S/WAVES and WAVES are displayed in panels (a)(b) and (c)(d) of Figure 14, respectively. There are clear signatures of type \@slowromancapiii@ radio burst in the spectra. For STA, the burst started at 15:38:30 UT and ended at 16:00 UT, during which the frequency drifted rapidly from 16 MHz to 0.3 MHz. For STB that was 0.07 AU further than STA from the Sun, the burst started slightly later by 2 minutes with the frequency drifting from 4.1 MHz to 0.3 MHz since the early propagation of the filament was blocked by the Sun. For WAVES, the burst started at 15:39:30 UT and ended at 16:00 UT with the frequency drifting from 13.8 MHz to 0.03 MHz. The starting times of the radio burst were consistent with the HXR peak times of the flare. Since the type \@slowromancapiii@ radio emissions result from the cyclotron maser instability of the nonthermal electron beams that are accelerated and ejected into the interplanetary space along open magnetic field lines during the flare (Tang et al., 2013), the type \@slowromancapiii@ radio burst observed by STEREO and WIND provides indirect and supplementary evidence that open magnetic field lines exist near the flare site.
4 Discussions
4.1 How is the energy accumulated?
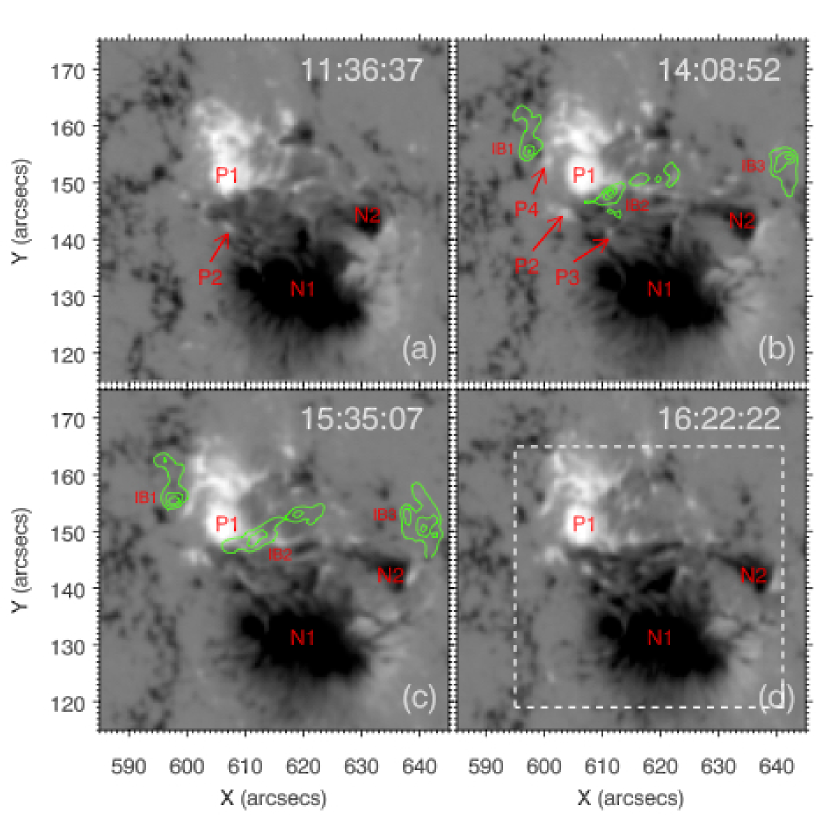
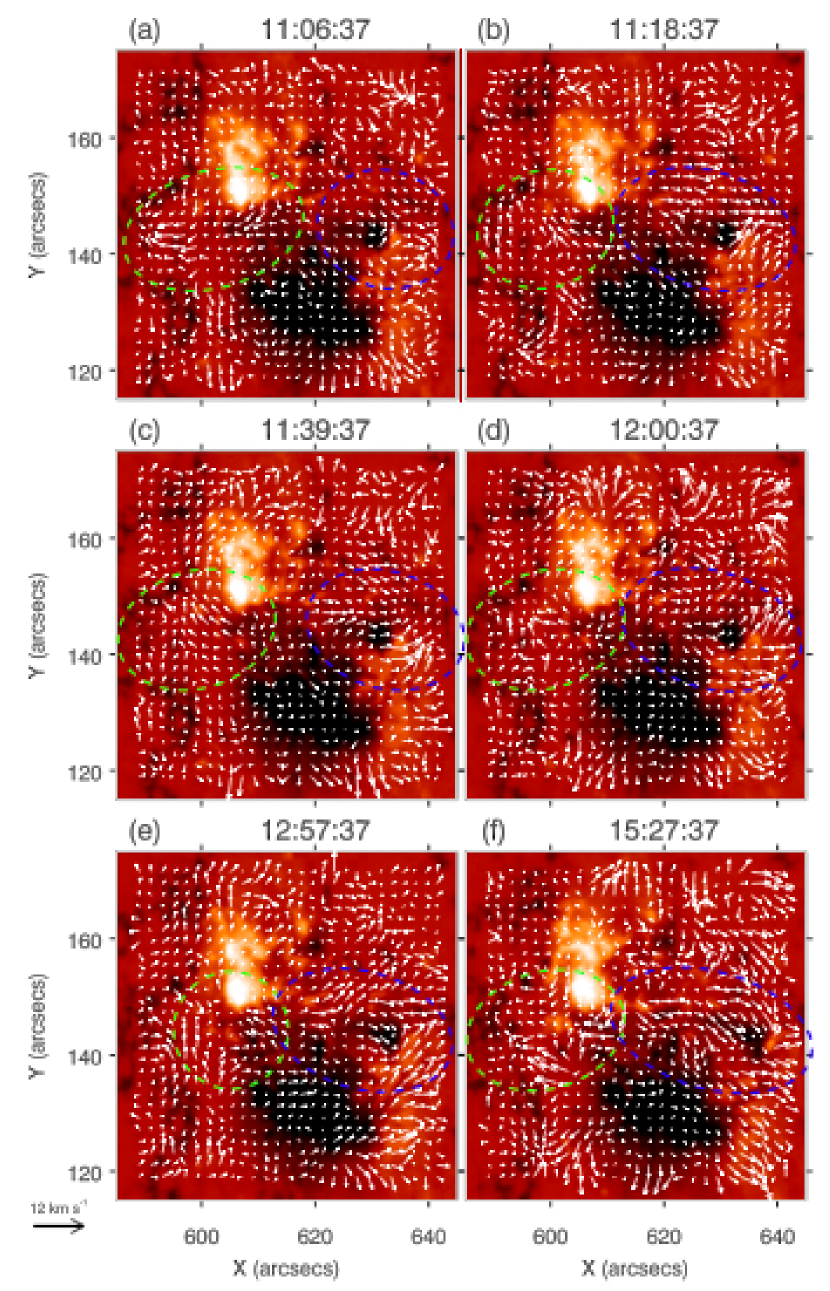
It is widely accepted that the solar eruptions result from the release of magnetic free energy. For this event, we studied how the energy is accumulated by investigating the magnetic evolution of the AR using the HMI LOS magnetograms (see the online movie Animation5.mpg). Figure 15 displays four snapshots of the magnetograms, where the AR is dominated by negative polarity (N1). A preexisting positive polarity (P1) is located in the northeast direction. From the movie, we found continuous shearing motion along the highly fragmented and complex PIL between N1 and P1. For example, the small negative region N2 at the boundary of the sunspot was dragged westward and became elongated (Figure 15(b)-(d)). To better illustrate the motion, we derived the transverse velocity field (, ) at the photosphere using the differential affine velocity estimator (DAVE) method (Schuck, 2005). The cadence of the HMI LOS magnetograms was lowered from 45 s to 180 s. Figure 16 displays six snapshots of the magnetograms overlaid with the transverse velocity field represented by the white arrows. The velocity field is clearly characterized by the shearing motions along the PIL. The regions within the green and blue elliptical lines are dominated by eastward and westward motions at the speeds of 1.5 km s-1. From the online movie (Animation6.mpg), we can see that the continuous shearing motions were evident before the flare, implying that the magnetic free energy and helicity were accumulated and stored before the impulsive release.
4.2 How is the eruption triggered?
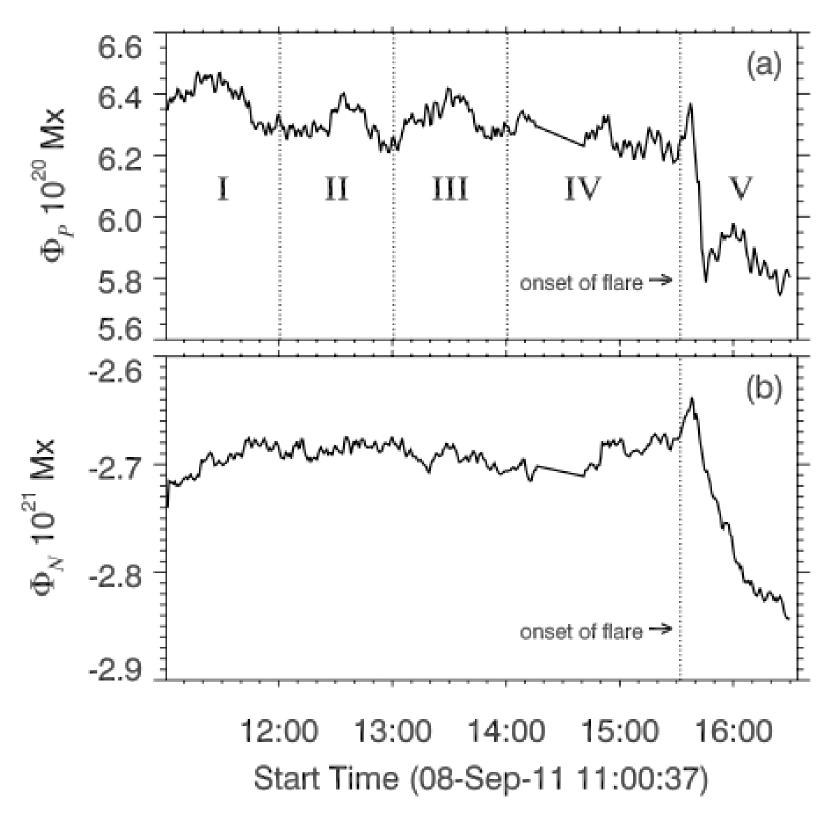
Once the free energy of the AR is accumulated to a critical value, chances are that the filament constrained by the overlying magnetic field lines undergoes an eruption. Several types of triggering mechanism have been proposed. One type of processes where magnetic reconnection is involved include the flux emergence model (Chen & Shibata, 2000), catastrophic model (Lin & Forbes, 2000), tether-cutting model (Moore et al., 2001; Chen et al., 2014), and breakout model (Antiochos et al., 1999), to name a few. Another type is the ideal magnetohydrodynamic (MHD) processes as a result of KI (Kliem et al., 2004) and/or TI (Kliem & Török, 2006). From Figure 15 and the movie (Animation5.mpg), we can see that before the flare there was continuous magnetic flux emergence (P2, P3, and P4) and subsequent magnetic cancellation along the fragmented PIL. We extracted a large region within the white dashed box of Figure 15(d) and calculated the total positive () and negative () magnetic fluxes within the box. In Figure 17, the temporal evolutions of the fluxes during 11:0016:30 UT are plotted, with the evolution of divided into five phases (IV) separated by the dotted lines. The first four phases before the onset of flare at 15:32 UT are characterized by quasi-periodic and small-amplitude magnetic flux emergence and cancellation, implying that the large-scale magnetic field was undergoing rearrangement before the flare. The intensity contours of the 304 Å images in Figure 3(b) and (d) are overlaid on the magnetograms in Figure 15(b) and (c), respectively. It is clear that the initial brightenings IB1 and IB2 are very close to the small positive polarities P4 and P3. There is no significant magnetic flux emergence around IB3. In the emerging-flux-induced-eruption model (Chen & Shibata, 2000), when reconnection-favorable magnetic bipole emerges from beneath the photosphere into the filament channel, it reconnects with the preexisting magnetic field lines that compress the inverse-polarity MFR. The small-scale magnetic reconnection and flux cancellation serve as the precursor for the upcoming filament eruption and flare. During the flare when magnetic reconnection occurred between 15:32 UT and 16:10 UT, both the positive and negative magnetic field experienced impulsive and irreversible changes.
Despite that the flux emergences are plausible to interpret the triggering mechanism, there is another possibility. In the tether-cutting model (Moore et al., 2001), a pair of -shape sheared arcades that comprise a sigmoid reconnect when the two elbows come into contact, forming a short loop and a long MFR. Whether the MFR experiences a failed or ejective eruption depends on the strength of compression from the large-scale background field. The initial brightenings (IB1, IB2, and IB3) around the sigmoidal filament might be the precursor brightenings as a result of internal tether-cutting reconnection due to the continuous shearing motion along the PIL. After onset, the whole flux system erupted and produced the M-class flare. Considering that the magnetic configuration could not be modelled during the flare, we are not sure whether a coherent MFR was formed after the initiation (Chen et al., 2014). Compared to the flux emergences, the internal tether-cutting seems more believable to interpret how the filament eruption was triggered for the following reasons. Firstly, the filament was supported by sheared arcade. Secondly, there were continuous shearing motions along the PIL, and the directions were favorable for the tether-cutting reconnection. Finally, the initial brightenings (IB1, IB2, and IB3) around the filament in Figure 3 fairly match the internal tether-cutting reconnection with the presence of multiple bright patches of flare emission in the chromosphere at the feet of reconnected field lines, while there was no flux emergence around IB3. NLFFF modelling shows that the twist number (1) of the sheared arcades supporting the filament is less than the threshold value (1.5), implying that the filament eruption may not be triggered by ideal KI. The photospheric magnetic field of the AR features a bipole (P1 and N1) and a couple of mini-polarities (e.g., P2, P3, P4, and N2). Therefore, the filament eruption could not be explained by the breakout model that requires quadrupolar magnetic field, although null-point magnetic reconnection took place above the filament during the eruption.
After the onset of eruption, the filament split into two parts as described in Section 3. How the filament split is still unclear. In the previous literatures, magnetic reconnection is involved in the split in most cases (Gilbert et al., 2001; Gibson & Fan, 2006a; Liu et al., 2008). In this study, the split occurred during the impulsive phase of the flare at the eastern leg that was closer to the flare site than the western one, implying that the split was associated with the release of magnetic energy. The subsequent rotation or unwinding motion implies the release of magnetic helicity stored in the filament before the flare, presumably due to the shearing motion in the photosphere. Nevertheless, it is still elusive whether the filament existed as a whole or was composed of two interwinding parts before splitting. The way of splitting seems difficult to be explained by any of the previous models and requires in-depth investigations.
Though the runaway part escaped out of the corona, the major part failed. It returned to the solar surface after reaching the apex. Such kind of failed eruptions have been frequently observed and explained by the strapping effect of the overlying arcade (Ji et al., 2003; Guo et al., 2010a; Song et al., 2014; Joshi et al., 2014) or asymmetry of the background magnetic fields with respect to the location of the filament (Liu et al., 2009). In order to figure out the cause of failed eruption of the major part, we turn to the large-scale magnetic configurations displayed in the bottom panels of Figure 2. It is revealed that the overlying magnetic arcades above AR 11283 are asymmetric to a great extent, i.e., the magnetic field to the west of AR is much stronger than that to the east, which is similar to the case of Liu et al. (2009). According to the analysis of Liu et al. (2009), the confinements of the large-scale arcade acted on the filament are strong enough to prevent it from escaping. We also performed magnetic potential-field extrapolation using the same boundary and derived the distributions of above the PIL. It is found that the maximum height of the major part considerably exceeds the critical height (80) of TI where the decay index () of the background potential field reaches 1.5. The major part would have escaped from the corona successfully after entering the instability domain if TI had worked. Therefore, the asymmetry with respect to the filament location, rather than TI of the overlying arcades, seems reasonable and convincing to interpret why the major part of the filament underwent failed eruption. In this study, both successful and failed eruptions occurred in a partially eruptive event, which provides more constraints to the theoretical models of solar eruptions.
4.3 How is the coronal loop oscillation triggered?
Since the first discovery of coronal loop oscillations during flares (Aschwanden et al., 1999; Nakariakov et al., 1999), such kind of oscillations are found to be ubiquitous and be useful for the diagnostics of coronal magnetic field (Guo et al., 2015). Owing to the complex interconnections of the magnetic field lines, blast wave and/or EUV wave induced by filament eruption may disturb the adjacent coronal loops in the same AR or remote loops in another AR, resulting in transverse kink-mode oscillations. Nisticò et al. (2013) observed decaying and decayless transverse oscillations of a coronal loop on 2012 May 30. The loops experience small-amplitude decayless oscillations, which is driven by an external non-resonant harmonic driver before and after the flare (Murawski et al., 2014). The flare, as an impulsive driver, triggers large-amplitude decaying loop oscillations. In our study, the decayless loop oscillation with moderate amplitude (1.6 Mm) occurred during the flare and lasted for only two cycles, which makes it quite difficult to precisely measure the decay timescale if it is decaying indeed. The loop may cool down and become invisible in 171 Å while oscillating. Considering that the distance between the flare and OL is 50 Mm and the time delay between the flare onset and loop oscillation is 6 minutes, the speed of propagation of the disturbances from the flare to OL is estimated to be 140 km s-1, which is close to the local sound speed of the plasmas with temperature of 0.8 MK. Hence, we suppose that the coronal loop oscillation was triggered by the external disturbances as a result of the rising and expanding motions of the filament.
4.4 Significance for space weather prediction
Flares and CMEs play a very important role in the generation of space weather. Accurate prediction of space weather is of great significance. Successful eruptions have substantially been observed and deeply investigated. Partial filament eruptions that produce flares and CMEs, however, are rarely detected and poorly explored. For the type of partial eruptions in this study, i.e., one part undergoes failed eruption and the other part escapes out of the corona, it would be misleading and confusing to assess and predict the space weather effects based on the information only from the solar surface, since the escaping part may carry or produce solar energetic particles that have potential geoeffectiveness. Complete observations are necessary for accurate predictions.
5 Summary
Using the multiwavelength observations from both spaceborne and ground-based telescopes, we studied in detail a partial filament eruption event in AR 11283 on 2011 September 8. The main results are summarized as follows:
-
1.
A magnetic null point was found above the preexisting positive polarity surrounded by negative polarities in the AR. A spine passed through the null and intersected with the photosphere to the left. Weakly twisted sheared arcade supporting the filament was located under the null point whose height increased slightly by 0.4 Mm after the eruption.
-
2.
The filament rose and expanded, which was probably triggered by the internal tether-cutting reconnection or by continuous magnetic flux emergence and cancellation along the highly complex and fragmented PIL, the former of which seems more convincing. During its eruption, it triggered the null-point magnetic reconnection and the M6.7 flare with a single HXR source at different energy bands. The flare produced a quasi-circular ribbon and a V-shape ribbon where the outer spine intersects with the photosphere.
-
3.
During the expansion, the filament split into two parts at the eastern leg that is closer to the flare site. The major part of the filament rose at the speeds of 90150 km s-1 before reaching the maximum apparent height of 115 Mm. Afterwards, it returned to the solar surface staggeringly at the speeds of 2080 km s-1. The rising and falling motions of the filament were clearly observed in the UV, EUV, and H wavelengths. The failed eruption of the major part was most probably caused by the asymmetry of the overlying magnetic arcades with respect to the filament location.
-
4.
The runaway part, however, separated from and rotated around the major part for 1 turn before escaping outward from the corona at the speeds of 125255 km s-1, probably along the large-scale open magnetic field lines as evidenced by the PFSS modelling and the type \@slowromancapiii@ radio burst. The ejected part of the filament led to a faint CME. The angular width and apparent speed of the CME in the FOV of C2 are 37∘ and 214 km s-1. The propagation directions of the escaping filament observed by SDO/AIA and STA/EUVI are consistent with those of the CME observed by LASCO/C2 and STA/COR1, respectively.
-
5.
The partial filament eruption also triggered transverse oscillation of the neighbouring coronal loops in the same AR. The amplitude and period of the kink-mode oscillation were 1.6 Mm and 225 s. We also performed diagnostics of the plasma density and temperature of the oscillating loops.
References
- Amari et al. (2014) Amari, T., Canou, A., & Aly, J.-J. 2014, Nature, 514, 465
- Antiochos et al. (1999) Antiochos, S. K., DeVore, C. R., & Klimchuk, J. A. 1999, ApJ, 510, 485
- Aschwanden et al. (1999) Aschwanden, M. J., Fletcher, L., Schrijver, C. J., & Alexander, D. 1999, ApJ, 520, 880
- Aschwanden (2011) Aschwanden, M. J. 2011, Living Reviews in Solar Physics, 8, 5
- Bi et al. (2014) Bi, Y., Jiang, Y., Yang, J., et al. 2014, ApJ, 790, 100
- Bougeret et al. (1995) Bougeret, J.-L., Kaiser, M. L., Kellogg, P. J., et al. 1995, Space Sci. Rev., 71, 231
- Bougeret et al. (2008) Bougeret, J. L., Goetz, K., Kaiser, M. L., et al. 2008, Space Sci. Rev., 136, 487
- Brueckner et al. (1995) Brueckner, G. E., Howard, R. A., Koomen, M. J., et al. 1995, Sol. Phys., 162, 357
- Chen (2011) Chen, P. F. 2011, Living Reviews in Solar Physics, 8, 1
- Chen & Shibata (2000) Chen, P. F., & Shibata, K. 2000, ApJ, 545, 524
- Chen et al. (2008) Chen, P. F., Innes, D. E., & Solanki, S. K. 2008, A&A, 484, 487
- Chen et al. (2014) Chen, H., Zhang, J., Cheng, X., et al. 2014, ApJ, 797, LL15
- Cheng et al. (2012) Cheng, X., Zhang, J., Saar, S. H., & Ding, M. D. 2012, ApJ, 761, 62
- Cheng et al. (2014a) Cheng, X., Ding, M. D., Zhang, J., et al. 2014a, ApJ, 789, L35
- Cheng et al. (2014b) Cheng, X., Ding, M. D., Zhang, J., et al. 2014b, ApJ, 789, 93
- Dai et al. (2013) Dai, Y., Ding, M. D., & Guo, Y. 2013, ApJ, 773, L21
- Fan (2005) Fan, Y. 2005, ApJ, 630, 543
- Feng et al. (2013) Feng, L., Wiegelmann, T., Su, Y., et al. 2013, ApJ, 765, 37
- Gibson & Fan (2006a) Gibson, S. E., & Fan, Y. 2006a, ApJ, 637, L65
- Gibson & Fan (2006b) Gibson, S. E., & Fan, Y. 2006b, Journal of Geophysical Research (Space Physics), 111, 12103
- Gilbert et al. (2000) Gilbert, H. R., Holzer, T. E., Burkepile, J. T., & Hundhausen, A. J. 2000, ApJ, 537, 503
- Gilbert et al. (2001) Gilbert, H. R., Holzer, T. E., & Burkepile, J. T. 2001, ApJ, 549, 1221
- Gilbert et al. (2007) Gilbert, H. R., Alexander, D., & Liu, R. 2007, Sol. Phys., 245, 287
- Guo et al. (2010a) Guo, Y., Ding, M. D., Schmieder, B., et al. 2010a, ApJ, 725, L38
- Guo et al. (2010b) Guo, Y., Schmieder, B., Démoulin, P., et al. 2010b, ApJ, 714, 343
- Guo et al. (2013) Guo, Y., Démoulin, P., Schmieder, B., et al. 2013, A&A, 555, A19
- Guo et al. (2015) Guo, Y., Erdélyi, R., Srivastava, A. K., et al. 2015, ApJ, 799, 151
- Hood & Priest (1981) Hood, A. W., & Priest, E. R. 1981, Geophysical and Astrophysical Fluid Dynamics, 17, 297
- Howard et al. (2008) Howard, R. A., Moses, J. D., Vourlidas, A., et al. 2008, Space Sci. Rev., 136, 67
- Ji et al. (2003) Ji, H., Wang, H., Schmahl, E. J., Moon, Y.-J., & Jiang, Y. 2003, ApJ, 595, L135
- Jiang et al. (2013) Jiang, C., Feng, X., Wu, S. T., & Hu, Q. 2013, ApJ, 771, L30
- Jiang et al. (2014) Jiang, C., Wu, S. T., Feng, X., & Hu, Q. 2014, ApJ, 780, 55
- Joshi et al. (2013) Joshi, N. C., Srivastava, A. K., Filippov, B., et al. 2013, ApJ, 771, 65
- Joshi et al. (2014) Joshi, N. C., Srivastava, A. K., Filippov, B., et al. 2014, ApJ, 787, 11
- Kaiser (2005) Kaiser, M. L. 2005, Advances in Space Research, 36, 1483
- Keppens & Xia (2014) Keppens, R., & Xia, C. 2014, ApJ, 789, 22
- Kliem et al. (2004) Kliem, B., Titov, V. S., Török, T. 2004, A&A, 413, L23
- Kliem & Török (2006) Kliem, B., Török, T. 2006, Physical Review Letters, 96, 255002
- Kumar et al. (2010) Kumar, P., Srivastava, A. K., Filippov, B., & Uddin, W. 2010, Sol. Phys., 266, 39
- Kumar et al. (2011) Kumar, P., Srivastava, A. K., Filippov, B., Erdélyi, R., & Uddin, W. 2011, Sol. Phys., 272, 301
- Kumar et al. (2012) Kumar, P., Cho, K.-S., Bong, S.-C., Park, S.-H., & Kim, Y. H. 2012, ApJ, 746, 67
- Lemen et al. (2012) Lemen, J. R., Title, A. M., Akin, D. J., et al. 2012, Sol. Phys., 275, 17
- Li & Zhang (2012) Li, T., & Zhang, J. 2012, ApJ, 760, L10
- Li et al. (2014) Li, Y., Ding, M. D., Guo, Y., & Dai, Y. 2014, ApJ, 793, 85
- Lin et al. (2002) Lin, R. P., Dennis, B. R., Hurford, G. J., et al. 2002, Sol. Phys., 210, 3
- Lin & Forbes (2000) Lin, J., & Forbes, T. G. 2000, J. Geophys. Res., 105, 2375
- Liu et al. (2007) Liu, R., Alexander, D., & Gilbert, H. R. 2007, ApJ, 661, 1260
- Liu (2008) Liu, Y. 2008, ApJ, 679, L151
- Liu et al. (2008) Liu, R., Gilbert, H. R., Alexander, D., & Su, Y. 2008, ApJ, 680, 1508
- Liu et al. (2009) Liu, Y., Su, J., Xu, Z., et al. 2009, ApJ, 696, L70
- Liu et al. (2012) Liu, R., Kliem, B., Török, T., et al. 2012, ApJ, 756, 59
- Liu et al. (2014) Liu, C., Deng, N., Lee, J., et al. 2014, ApJ, 795, 128
- Mackay et al. (2010) Mackay, D. H., Karpen, J. T., Ballester, J. L., Schmieder, B., & Aulanier, G. 2010, Space Sci. Rev., 151, 333
- Mandrini et al. (2014) Mandrini, C. H., Schmieder, B., Démoulin, P., Guo, Y., & Cristiani, G. D. 2014, Sol. Phys., 289, 2041
- Moore et al. (2001) Moore, R. L., Sterling, A. C., Hudson, H. S., & Lemen, J. R. 2001, ApJ, 552, 833
- Murawski et al. (2014) Murawski, K., Solov’ev, A., Kraskiewicz, J., & Srivastava, A. K. 2014, arXiv:1411.7465
- Nakariakov et al. (1999) Nakariakov, V. M., Ofman, L., Deluca, E. E., Roberts, B., & Davila, J. M. 1999, Science, 285, 862
- Nakariakov & Ofman (2001) Nakariakov, V. M., & Ofman, L. 2001, A&A, 372, L53
- Ning & Cao (2010) Ning, Z., & Cao, W. 2010, Sol. Phys., 264, 329
- Nisticò et al. (2013) Nisticò, G., Nakariakov, V. M., & Verwichte, E. 2013, A&A, 552, AA57
- Ruan et al. (2014) Ruan, G., Chen, Y., Wang, S., et al. 2014, ApJ, 784, 165
- Schatten et al. (1969) Schatten, K. H., Wilcox, J. M., & Ness, N. F. 1969, Sol. Phys., 6, 442
- Scherrer et al. (2012) Scherrer, P. H., Schou, J., Bush, R. I., et al. 2012, Sol. Phys., 275, 207
- Schrijver & De Rosa (2003) Schrijver, C. J., & De Rosa, M. L. 2003, Sol. Phys., 212, 165
- Schuck (2005) Schuck, P. W. 2005, ApJ, 632, L53
- Shen et al. (2012) Shen, Y., Liu, Y., & Su, J. 2012, ApJ, 750, 12
- Shen et al. (2014) Shen, Y., Liu, Y. D., Chen, P. F., & Ichimoto, K. 2014, ApJ, 795, 130
- Song et al. (2014) Song, H. Q., Zhang, J., Cheng, X., et al. 2014, ApJ, 784, 48
- Srivastava et al. (2010) Srivastava, A. K., Zaqarashvili, T. V., Kumar, P., & Khodachenko, M. L. 2010, ApJ, 715, 292
- Su & van Ballegooijen (2012) Su, Y., & van Ballegooijen, A. 2012, ApJ, 757, 168
- Sun et al. (2012a) Sun, X., Hoeksema, J. T., Liu, Y., et al. 2012a, ApJ, 748, 77
- Sun et al. (2012b) Sun, X., Hoeksema, J. T., Liu, Y., Chen, Q., & Hayashi, K. 2012b, ApJ, 757, 149
- Tang et al. (2013) Tang, J. F., Wu, D. J., & Tan, C. M. 2013, ApJ, 779, 83
- Terradas et al. (2015) Terradas, J., Soler, R., Luna, M., Oliver, R., & Ballester, J. L. 2015, ApJ, 799, 94
- Török et al. (2004) Török, T., Kliem, B., & Titov, V. S. 2004, A&A, 413, L27
- Török & Kliem (2005) Török, T., & Kliem, B. 2005, ApJ, 630, L97
- Török et al. (2010) Török, T., Berger, M. A., & Kliem, B. 2010, A&A, 516, A49
- Tripathi et al. (2006) Tripathi, D., Solanki, S. K., Schwenn, R., et al. 2006, A&A, 449, 369
- Tripathi et al. (2007) Tripathi, D., Solanki, S. K., Mason, H. E., & Webb, D. F. 2007, A&A, 472, 633
- Tripathi et al. (2009) Tripathi, D., Gibson, S. E., Qiu, J., et al. 2009, A&A, 498, 295
- Tripathi et al. (2013) Tripathi, D., Reeves, K. K., Gibson, S. E., Srivastava, A., & Joshi, N. C. 2013, ApJ, 778, 142
- Wheatland et al. (2000) Wheatland, M. S., Sturrock, P. A., & Roumeliotis, G. 2000, ApJ, 540, 1150
- White & Verwichte (2012) White, R. S., & Verwichte, E. 2012, A&A, 537, AA49
- Wiegelmann (2004) Wiegelmann, T. 2004, Sol. Phys., 219, 87
- Xia et al. (2012) Xia, C., Chen, P. F., & Keppens, R. 2012, ApJ, 748, L26
- Xia et al. (2011) Xia, C., Chen, P. F., Keppens, R., & van Marle, A. J. 2011, ApJ, 737, 27
- Xia et al. (2014a) Xia, C., Keppens, R., Antolin, P., & Porth, O. 2014a, ApJ, 792, L38
- Xia et al. (2014b) Xia, C., Keppens, R., & Guo, Y. 2014b, ApJ, 780, 130
- Zhang et al. (2012a) Zhang, J., Cheng, X., & Ding, M.-D. 2012a, Nature Communications, 3, 747
- Zhang et al. (2012b) Zhang, Q. M., Chen, P. F., Xia, C., & Keppens, R. 2012b, A&A, 542, A52
- Zhang et al. (2012c) Zhang, Q. M., Chen, P. F., Guo, Y., Fang, C., & Ding, M. D. 2012c, ApJ, 746, 19
- Zhang et al. (2013) Zhang, Q. M., Chen, P. F., Xia, C., Keppens, R., & Ji, H. S. 2013, A&A, 554, A124
- Zhou et al. (2014) Zhou, Y.-H., Chen, P.-F., Zhang, Q.-M., & Fang, C. 2014, Research in Astronomy and Astrophysics, 14, 581
(Animations of this figure are available in the online journal.)
(Animations of this figure are available in the online journal.)
(Animations of this figure are available in the online journal.)
(Animations of this figure are available in the online journal.)
(Animations of this figure are available in the online journal.)
(Animations of this figure are available in the online journal.)
| Instrument | Time | Cadence | Pixel Size | |
|---|---|---|---|---|
| (Å) | (UT) | (sec) | (arcsec) | |
| BBSO | 6563 | 15:3017:00 | 60 | 1.0 |
| AIA | 941700 | 15:3016:30 | 12 | 0.6 |
| HMI | 6173 | 11:0017:00 | 45, 720 | 0.5 |
| EUVI | 195 | 15:3016:30 | 300 | 1.6 |
| EUVI | 304 | 15:3016:30 | 600 | 1.6 |
| COR1 | WL | 15:3016:30 | 300 | 15.0 |
| S/WAVES | 2.516025 kHz | 15:3016:30 | 60 | |
| WAVES | 2013825 kHz | 15:3016:30 | 60 | |
| LASCO/C2 | WL | 15:3018:00 | 720 | 11.4 |
| GOES | 0.54.0 | 15:3016:30 | 3 | |
| GOES | 1.08.0 | 15:3016:30 | 3 | |
| RHESSI | 3100 keV | 15:3016:10 | 4, 10 | 4 |