Phase transition oscillations induced by a strongly focused laser beam
Abstract
We report here the observation of a surprising phenomenon consisting in a oscillating phase transition which appears in a binary mixture, PMMA/3-octanone, when this is enlightened by a strongly focused infrared laser beam. PMMA/3-octanone has a UCST (Upper Critical Solution Temperature) which presents a critical point at temperature and volume fraction [Crauste et al., ArXiv1310.6720, 2012]. This oscillatory phenomenon appears because of thermophoretic and electrostriction effects and non-linear diffusion. We analyze these oscillations and we propose a simple model which includes the minimal ingredients to produce the oscillatory behavior.
pacs:
64.75.Cd,05.70.Ln, 64.60.an,05.45.-aPhase transitions in binary mixtures are still a widely studied subject, specifically near the critical point where several interesting and not completely understood phenomena may appear, among them we recall the critical Casimir forces GambassiN ,Dean , confinement effects Bramwell , Joubaud and out-of-equilibrium dynamics after a quench. The perturbation of the binary mixtures by mean of external fields is also an important and recent field of investigation ReviewPhaseElectric . For example, a laser can induce interesting phenomena in demixing binary mixtures because the radiation pressure can deform the interface between the two phases and it can be used to measure the interface tension Delville1 . Depending on the nature of the binary mixtures, laser illumination can also lead to a mixing or demixing transition. In ref.RadiationPressureMolecularAssembly , focused infrared laser light heats the medium initially in the homogeneous phase and causes a separation in the LCST (Low Critical Solution Temperature) system. The radiation pressure gradients in a laser beam also contribute in the aggregation of polymers, thus producing a phase transition. The local heating may induce thermophoretic forces which attract towards the laser beam one of the binary-mixture components ThermoBinary . Other forces like electrostriction can also be involved Electrostriction .
In this letter, we report a new phenomenon, which consists in an oscillating phase transition induced by a constant illumination from an infrared laser beam in the heterogeneous region of an UCST (Upper Critical Solution Temperature) binary mixture. Oscillation phenomena in phase transition have already been reported in slow cooling UCST Vollmer2002Manip ,CatesOscillation but as far as we know, never induced by a stationary laser illumination. After describing our experimental set-up, we will present the results. Then we will use a very simplified model which contains the main necessary physical ingredients to induce this oscillation phenomenon.
The medium is a binary mixture of Poly-Methyl-Meth-Acrylate (PMMA) (Fluka, analytical standard for GPC) with a molecular weight and a polydispersity and 3-octanone (sup. 98%). Both are purchased from Sigma-Aldrich. This binary mixture presents a upper critical solution temperature (UCST)Xia1996 measured in reference ArticlePMMA around and at the critical PMMA volume fraction . The phase diagram in volume fraction-temperature presents a high temperature homogeneous region and a low temperature two phases region with a polymer rich and a polymer poor phase. We prepare solutions at different volume fractions and mix them at 325 K during one night. They are placed in glass cells inserted in a Leica Microscope. Then, the samples are left several hours at room temperature to let the medium have a proper demixion. A laser beam ( = 1064 nm) is focused on each sample Ruben . A white light source is also used to illuminate the sample, whose images are recorded by a fast Mikrotron MC1310 cameraSupplMat .
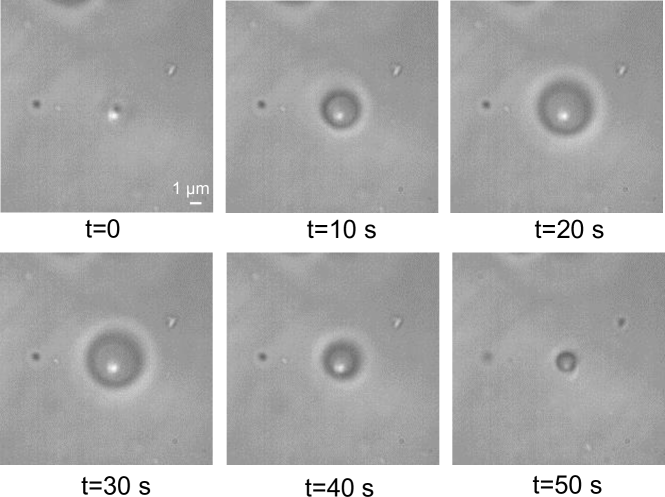
At room temperature, the mixture at PMMA volume fraction is in the two phases region. So we can see droplets of one phase in the other one. After a long time, these droplets coalesce. Nevertheless, the medium is thin enough to do not observe a complete segregation of the two phases due to gravity. At , theses droplets are steady. When the laser is switched on, a droplet of one phase appears at the focal point of the laser (see Fig.1). This droplet size increases until a maximum radius is reached and then it decreases. When the droplet disappears, another one appears close to the vanishing one and another cycle of growth and decrease begins. This phenomenon could persist for several oscillations (between 1 and 20). When it stops, we observe some dense PMMA aggregates on the bottom of the cell. Sometimes, the phenomenon stops because we place the laser too close to an existing droplet, and the created one coalesces with an existing one.
The oscillatory phenomenon could also appear in a sample with of PMMA, that is to say, a non-critical mixture. Moreover, in this solution, the number of droplets is less important and droplets are more mobile due to a smaller viscosity of the sample. These mobile droplets can easily be trapped by the focused laser beam as particles in an optical tweezers. Thus the optical index of the droplets is bigger than the optical index of the bulk. As the two optical indices are and , we conclude that the droplets are the phase rich in PMMA.
Important remark: this phenomenon appears when the laser is originally focused in the poor phase at less than of a rich phase. It is probably because one needs a transfer of PMMA materials to create the rich droplet. If the laser is originally on a rich phase, we sometimes observe a growth of the whole rich phase after a transient state where complex phenomena appear (creating interfaces, collapsing).
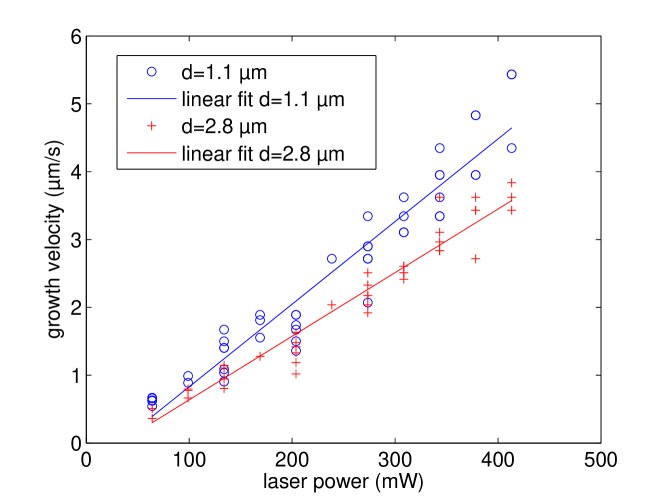
To characterize this phenomenon, we begin by measuring the growth velocity of droplets as a function of the laser power in a sample. The oscillating droplets are acquired at 20 fps with the camera. We measure the time needed by a growing droplet to reach an imposed diameter . The mean growth velocity is given by . We plot in Fig.2 as function of the laser power for two chosen diameters and , for several droplets in different positions of the cell. Below \SI70mW, there are no droplets. Above \SI420mW, the scattering of the laser beam by the sample is too big to do a correct measurement. In the measurement region, the mean velocity is well approximated by a linear function of the laser intensity, whose slope is a decreasing function of , specifically in the figure at and at .
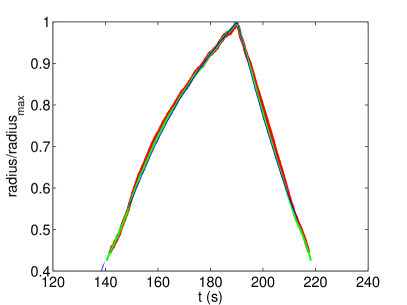
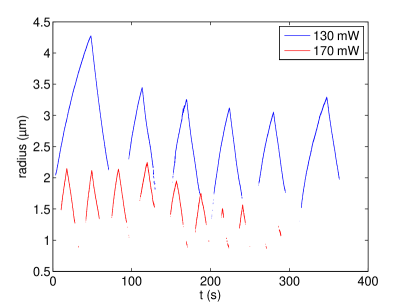
To characterize the oscillations, we implement a program with ImageJ to get the edge of the droplet in each image. We then determine the area and the radius of the droplet. As the position of this edge is sensitive to the chosen value of the threshold, we plot Fig.3-a) the value of the radius as a function of time for several thresholds. We check that if we rescale the curves by the maximum radius, all curves collapse. The absolute incertitude on is about \SI0.5μm which is the diffraction limit. This method is not relevant for too small droplets because we do not get the right edge for two reasons. The first is that diffraction effects dominate. The second is that the contrast inside the droplet changes during the growth. Thus a fixed threshold cannot describe the edge of the droplet during all times. Therefore we plot in Fig.3-b) only the dynamics for the radius above .
On one oscillation, we can see that the change of regime (from increase to decrease) is quite sudden. We succeeded in doing at the same spot several oscillations at two different laser intensity. Results are plotted in figure 3-b). An increase in laser intensity results in an increase of the oscillation frequency and a decrease of the maximum amplitude of the droplet. We tried unsuccessfully to measure quantitatively this effect, because, as we can see in figure 3-b), the variation of the droplet maximum radius at fixed intensity perturbs the effect. Furthermore other parameters, like local changes of concentration, dusts and aging may disturb our measurement. Nevertheless, from our analysis at short times, we know that the larger is the laser power the faster is the droplet growth.
What is the origin of this laser induced transition ? A droplet of PMMA rich phase is initiated in the PMMA poor phase and then oscillates. Where does this PMMA accumulation come from? It can not be a simple effect of heating because this binary mixture has a UCST, so an increase in temperature should provoke an homogenization of the solution. But a local heating creates gradients of temperature and then thermophoresis. We can estimate the increase of temperature due to the laser by measuring the absorption coefficient of the mixture in a cell at . To avoid light scattering, this absorption measurement is performed by keeping the cell at a temperature larger than , when the sample is well mixed. This gives us an estimation of the extinction coefficient of the mixture and so an estimation of the temperature increase, which is about at the focal point given by the formula in reference LaserInduceHeating . This increase should be enough to observe a thermophoretic effect. As the sign of the thermophoretic coefficient (Soret coefficient) of this mixture is positive Soret the PMMA is attracted to low temperature regions. So, this does not explain the first growth of the droplet but it must be an important issue in the oscillations.
The presence of the focused laser beam produces a second effect : the trapping of PMMA. We estimate the stability of this trap, taking into account that the radius of gyration of the polymer is about ArticlePMMA . At this size, we are in the Rayleigh approximation for light. We calculate the ratio between the scattering force and the gradient force on the particle FormuleDipolaire . This ratio should be less than one to get a stable trap. We got . The trap is thus stable. But to trap correctly, the trapping force also needs to be bigger than the thermal forces acting on the PMMA bead. To check that, we have to estimate the Boltzmann factor where is the potential of the gradient force ref. Ashkin86 . In our case, inserting the experimental values in the equation for of ref.Ashkin86 we obtain , which is much smaller than . So even if the trap is stable, the gradient force is not sufficient to trap the polymer.
The laser can finally induce electrostrictive forces through its electric field gradient Electrostriction . As , this force results in an attraction of the polymer close to the focused laser beam through the osmotic compression of the solute.
To summarize, the rich phase created by the laser is due to an excess of polymer brought by the laser probably by electrostrictive forces. As at this excess concentration, the polymer mixture is not thermodynamically stable, the mixture separates spontaneously and the new phase growths gradually with an increasing amount of PMMA. But this effect is balanced by thermophoretic effect which brings the polymer toward the low temperature region. However this simple explanation does not give us the reason of why the phase should decrease at a certain point. That needs a more precise model, which includes as activation mechanisms a combination of the above mentioned thermophoretic effects and electrostriction and their dependences in concentration of PMMA.
The oscillation phenomenon in phase transition was already observed in reference Vollmer2002Manip ; CatesOscillation in an UCST transition during a slow cooling of the mixture. A simple but powerful model was developed in ref.CatesOscillation ; UltraSlowCooling based on the Landau phase transition theory. They were able to explain their oscillatory behavior with the following equation :
| (1) |
where . is the equilibrium volume fraction of PMMA as a function of temperature. So for each temperature, in the equilibrium rich phase and in the equilibrium poor phase. In this equation, there is the non linear diffusive term , the interface term and a source term proportional to via a pumping coefficient that in the original model was .
In order to simulate the laser induced oscillations, described in the previous sections, we solved numerically eq.1 with a time independent local source of amplitude in a region of size around and elsewhere. The numerical simulation has been performed SupplMat with initial conditions everywhere, with and in the domain with . In these conditions, we observe that for the local concentration oscillates in a region around the forcing point. These oscillations can be seen in Fig.4-a)-b) where we plot the value of the local concentration at and at for two different values of .
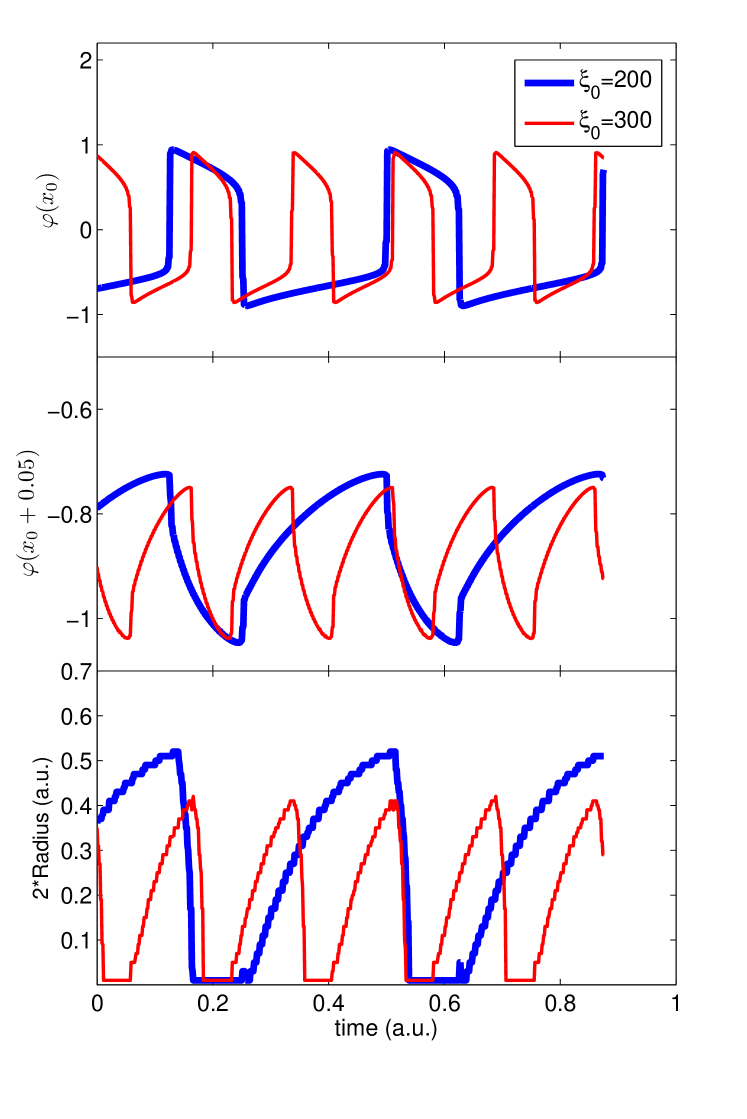
Looking at Figs.4-a)-b) we see that the bigger is the quicker and smaller oscillations are, which is in good agreement with experimental results (figure 3-b). We also observe an oscillatory creation of a rich phase in the poor one at the forcing point 4-a-b). Following the experimental procedure we can also estimate in the numerical simulation the radius of the domain in which is larger than a defined threshold value, fixed for example at . The results of this estimation are plotted in Fig.4-c) where we see that the numerical model produces a time evolution of the radius, which is very similar to that of the experiment. These results show that with this simplified approach, we get the most important ingredients to produce an oscillatory phenomenon, that is to say : (1) a non linear diffusion term; (2) a source term whose value changes sign when one changes phase.
As we have already discussed, the physical origin of this source term comes from thermophoresis and electrostriction because both effects contribute to antagonist changes of the local PMMA density. The determination of the relative importance of these two contributions will require other experimental setups to precisely measure the Soret and electrostriction coefficients. Furthermore the source term in eq.1 is oversimplified with respect to a full model based on the Landau theory in which we consider a local dependence on temperature and electric field of the coefficients. The derivation of this rather complex model will be the subject of another report. The one presented here has the advantage of being simple and of describing the main effects.
As a conclusion, we have presented a local oscillating phase transition induced by a focused laser beam. To the best of our knowledge, this phenomenon has never been observed before. We show that a simple model, based on the Landau theory for phase transition and a local forcing contains enough ingredients to provoke a non-linear oscillatory behavior. We propose physical mechanisms which may provoke the oscillation cycle. The thermophoresis plays a very important role because the Soret coefficient is positive and PMMA is attracted towards low temperature region. In any case it cannot be excluded that other mechanisms (such as electrostricton) may also play a certain role. The connection of our simple and minimal model with a more physical one will be the subject of a theoretical paper where the weight of the various mechanisms will be evaluated more precisely. To improve this study one could also choose another model for the phase transition using Flory-Huggins theory ScalingConcepts . It is the solution chosen by Anders in ThermoBinary , which could be closest to the experiments because the model is very well suited to describe polymer-solvent interaction.
Acknowledgments
This paper has been supported by the ERC project OUTEFLUCOP. We aknowledge fruitful discussions with Jean-Pierre Delville.
Present address: School of Physics and Astronomy, University of Edinburgh, Edinburgh, EH9 3FD, United Kingdom
References
- (1) C. Crauste, C. Devailly, A.Steinberger, S. Ciliberto, arXiv, 1310.6720 (2013).
- (2) C. Hertlein, L. Helden, A. Gambassi, S. Dietrich, C. Bechinger, Nature, 451, 7175 (2008).
- (3) DS. Dean, and A. Gopinathan, Jour. Stat. Mech, 2009, L08001 (2009).
- (4) ST. Bramwell, PCW. Holdsworth, JF. Pinton, Nature, 396, 6711 (1998).
- (5) S. Joubaud, A. Petrosyan, S.Ciliberto, NB. Garnier, Phys. Rev. Lett., 100, 18 (2008).
- (6) Y. Tsori, Rev. Mod. Phys., 81 (2009).
- (7) R. Wunenburger, A. Casner, JP. Delville, Phys. Rev. E, 73, 036314 (2006)
- (8) J. Hofkens, J. Hotta, K. Sasaki, H. Masuhara, K. Iwai Langmuir, 13, 3 (1997)
- (9) D. Anders, K. Weinberg Mech. Mat., 47 33 (2012).
- (10) J.P. Delville, C.Lalaude S. Buil, and A. Ducasse PRE, 59 5 (1999).
- (11) D. Vollmer, J. Vollmer and A.J. Wagner, Phys. Chem. Chem. Phys., 4 1380 (2002).
- (12) M. E. Cates, J. Vollmer, A. Wagner, D. Vollmer, Philosophical Transaction, 361 1805 (2003).
- (13) K.Q. Xia and X.Q. An and W.G. Shen. J. Chem. Phys., 105 (1996) 6018–6025.
- (14) J. R. Gomez-Solano, A. Petrosyan, S. Ciliberto, R. Chetrite, and K. Gawedzki., Phys. Rev. Lett., 103 040601 (2009).
- (15) See the supplemental material of this article at URL ??? for complementary information.
- (16) E.Peterman, F. Gittes, C. Schmidt, Biophysical Journal, 84 1308 (2003).
- (17) By using another experimental set-up, we have determined the sign of the Soret effect of PMMA/3-octanone mixture because its value is unknown in literature.
- (18) K. C. Neuman, S. M. Block, Rev. Sc. Inst., 75 2787 (2004).
- (19) A. Ashkin and J.M. Dziedzic, J.E. Bjorkholm and S. Chu Optics Letters, 11 288 (1986).
- (20) J. Vollmer, G. K. Auernhammer, D. Vollmer, Phys. Rev. Lett., 98 115701 (2007).
- (21) P.G. de Gennes, Scaling Concepts in Polymer Physics (1979).
Supplementary material for ”Phase transition oscillations induced by a strongly focused laser beam”
Appendix A Detailled sample preparation and
experimental set-up
We prepare the sample, under a laminar flow hood, at defined volume fractions by weighting the polymer before adding a volume of 3-octanone calculated from the density of the polymer given by the supplier. The solution is then mixed at 325 K during one night to ensure a good dissolution.
The cell containing the sample is composed by a 1 mm thick glass plate and by a cover slip separated by a thick polycarbonate sheet and glued with NOA 81 under UV light. The top glass plate has two apertures connected with two filling metallic tubes. To fill the cell, we heat all the materials (syringe, needle, cell) and the medium to avoid demixing during the filling. Then, we close the two openings with a small amount of wax. Two metallic tubes avoid wax to be directly in contact with the mixture. We leave the cell several hours at room temperature to let the medium demixing properly. We obtained a cell contaning two phases with typical size of the regions being around to . The filled cell is inserted in a microscope. We use an immersion oil-objective (Leica x63, N.A. 1.4) to focus the laser beam into the sample. The laser is a Quantum Forte 700 mW at wavelength 1064 nm supplied by a power source LD3000 to control the power intensity of the beam. The sample is also illuminated by a white light source. This light is collected by the x63 objective and the sample is observed with a fast camera Mikrotron MC1310. The whole optics of the set-up is given in reference ?? of the article. The laser power is calibrated by measuring the power of the laser beam just before the objective. Thus, it is not exactly the value of the intensity in the cell. The attenuation of the microscope objective is about 70% at \SI1064nm.
Appendix B Integration of the model equation
The numerical integration is performed by finite difference in space, by dividing the interval in points. The integration in time is performed by a fourth order Runge-Kutta method. We checked that the results are independent of by changing it from to . The initial conditions is in all of the points of the interval. Two types of boundary conditions have been used: a) ; b) . We mostly used the a) type because they correspond to have a good reservoir at the extremes, but the results do not change too much using the type b). The forcing term is for and 0 elsewhere. Notice that there are three length scales in this problem. The integration domain which is set to 1, the forcing size and . The oscillation do no appear if . The results presented in Fig. 4 have been obtained with and boundary conditions a). More details on the numerical integration of eq. 1 of the article and on its physical background will be the object of a theoretical paper.