Electronic and vibrational properties of in the
charge-density wave phase
from first principles
Abstract
We study the charge-density wave phase in by using first principle calculations. We show that, regardless of the local functional used and as long as the cell parameters are in agreement with the experiment, density-functional calculations are able to reproduce not only the structural instability of , but also the effective distortion observed in the experiments. We study the electronic structure evolution of the system under the charge-density wave deformation. In particular, we show that the energy bands for the distorted superstructure, unfolded into the original Brillouin zone, are in reasonable agreement with angle-resolved photoemission spectroscopy (ARPES) data taken at low temperature. On the contrary, the energy bands for the undistorted structure are not in good agreement with ARPES at high temperature. Motivated by these results, we investigate the effect of the correlation on the electrons of the localized Ti- orbitals by using the LDA+ method. We show that within this approximation the electronic bands for both the undistorted and distorted structure are in very good agreement with ARPES. On the other hand, the eliminates the phonon instability of the system. Some possible explanations for this counter intuitive result are proposed. Particularly, the possibility of taking into account the dependence of the parameter from the atomic positions is suggested.
pacs:
xxxI Introduction
The group IV transition metal diselenide 1T- (space group ) is a layered compound which has received considerable attention because of its interesting physical properties. In particular, below a critical temperature K it undergoes a commensurate charge density wave (CDW) transition, with the formation of a superlattice structure (space group ) accompanied by the softening of a zone boundary phonon and changes in the transport properties PhysRevB.14.4321 ; PhysRevLett.86.3799 ; motizuki1986structural . In spite of many experimental and theoretical studies, the driving force of this structural phase transition remains controversial. Several mechanisms have been proposed for the origin of the instability in and they can be roughly classified into two main groups depending on the driving role played either by the electrons or by the lattice. In fact, a charge density wave occurs always simultaneously with a periodic lattice distortions, so with both a modification of the electron and phonon spectra, but it is unclear if what is observed is primarily an instability of the electronic system or of the lattice Nat.Commun.3.069.2012 ; 0953-8984-23-21-213001 . To the first case belongs the excitonic insulator model PhysRevLett.99.146403 ; PSSB:PSSB2220860102 ; Wilson1977551 , where the CDW is essentially view as a many-body effect originated by the poorly screened hole-electron Coulomb interaction giving rise to a condensate of excitons and a consequent distortion. In the second family we find Peierls and Jahn-Teller band-type mechanisms 0022-3719-10-11-009 ; PhysRevB.65.235101 , where the instability essentially comes from the electron-phonon coupling leading the a lattice distortion which lowers the total energy of the system. The CDW phase competes with superconductivity since is not superconducting at low temperature, but CDW is suppressed and superconductivity stabilized either by Cu intercalation Nat.Phys.2.544.2006 or pressure PhysRevLett.103.236401 . For this reason, a deep and definitive understanding of the CDW occurrence would be interesting both for conceptual reasons and technological applications.
In this paper we present the specific role of the electron-phonon coupling in the appearance of the CDW ordering. As already shown in Ref. 13, thorough density functional theory (DFT) calculations it is possible to observe a structural instability at the and points of the Brillouin zone (BZ) consistent with a and real space superstructure. Here we want to provide a deeper analysis of this instability in order to find the exact distortion predicted and compare it with the experimental findings.
The paper is organized as follows: in Sec. II we summarize the method and the parameters used. Then, in Sec. III, we present the ab-initio structural analysis of the instability and CDW phase. Afterwards, in Sec. IV we analyze the electronic structure of the distorted phase. Particularly, we unfold the bands of the distorted phase into the undistorted BZ in order to compare the theoretical results with the data from an ARPES experiment. In Sec. V.2 we show the results of the LDA+ calculation. Finally, conclusions are presented in Sec. VI.
II Computational details
All calculations were performed within the framework of DFT using the Quantum ESPRESSO package QE-2009 which uses a plane-wave basis set to describe the valence-electron wave function and charge density. For the exchange-correlation functional we used both the Perdew-Zunger local density approximation (LDA) PhysRevB.23.5048 and the Predew-Burke-Ernzerhof conjugate gradient approximation (GGA) PhysRevLett.77.3865 . In the second case, as adjacent layers in are coupled by Van der Waals forces, we also considered a correction to the functional JCC:JCC20495 which is aimed at describing more accurately this kind of interaction (). In these cases the phonons have been calculated using density functional perturbation theory (DFPT) in the linear response RevModPhys.73.515 .
We used a cutoff of and () for the wave functions and the charge density, respectively; the BZ integration has been performed with a Monkhorst-Pack grid PhysRevB.13.5188 of and a Hermite-Gaussian smearing of . The self-consistent solution of the Kohn-Sham equations was obtained when the total energy changed by less than . We studied the system with internal theoretical coordinates (i.e. zero theoretical forces) and with both experimental and theoretical cell (i.e. zero theoretical pressure). The theoretical parameters have been obtained by relaxing the structure starting from the experimental parameters Riekel1976389 until the forces on the atoms were less than ( is the Bohr radius) and the pressure less than Kbar. The values of the geometrical parameters obtained for different local functionals are reported in Tab. 6. In particular, as it can be seen, the distance between the layers is underestimated in LDA and overestimated in GGA whereas, as expected, the best agreement between theory and experiment is obtained by using the functional.
| a | c | (Å) | (Å) | |
|---|---|---|---|---|
| Exp | 3.540 | 6.007 | 1.532 | 2.044 |
| 3.540 | 6.007 | 1.499 | 2.044 | |
| 3.540 | 6.007 | 1.534 | 2.044 | |
| 3.540 | 6.007 | 1.532 | 2.044 | |
| 3.434 | 5.792 | 1.535 | 1.982 | |
| 3.536 | 6.719 | 1.548 | 2.041 | |
| 3.510 | 6.165 | 1.553 | 2.026 |
In order to take into account the strong correlation effects due to the localized orbitals of Ti, we also considered the LDA+ method in the simplified form described in Ref.21; 22. Since we consider one strong-correlated orbital and no spin, this adds a single additional parameter .
We essentially performed two kind of analysis. On one hand we calculated the variation of the phonon frequencies in and with the value of for the experimental cell and theoretical internal coordinates obtained by relaxing the atomic positions for each value of . In this case the phonon frequencies have been obtained by using the finite difference method in Ref. 23 for a cell with a displacement of the atoms. A mesh grid of for the super-cell Brillouin zone and a Hermite-Gaussian smearing of have been used for the related self-consistent calculations of the forces.
On the other hand we calculated, by linear response, a first-principle estimate of for the case in the undistorted fase, through the difference between the screened and bare second derivative of the total energy with respect to the occupation of the Ti- orbital PhysRevB.71.035105 . For an input value , used to define the starting system, the linear-response calculation returns a different output value but, in order to be consistent and replace the LDA interaction term with the corresponding Hubbard correction, the ideal case in which should be considered. In fact, even if it is a common practice to simply compute the ab-initio value of in one step with , this consideration can be relevant, especially if the LDA and LDA+ systems are qualitative different PhysRevLett.97.103001 . In our case, in particular, the effect of is to open a gap between the bands with the result of obtaining, for , a metal-insulator transition (see Sec. V.2). For this reason we determined with a self-consistent procedure starting from the unperturbed system () and using, step by step, the obtained as for the subsequent calculation. For each step we obtained the result first by performing the linear response calculation on a cell and then extrapolating the outcome to a cell (see Ref.21 for details). With this procedure we converged in a few steps to the value . Since we decided to work with a fixed configuration, for all the steps we always kept fixed the internal coordinates equal to the ones obtained by relaxing the atomic positions with ; moreover, in order to achieve a precision of for the converged value of , we set the energy convergence threshold for self-consistency equal to .
III Structural analysis of the CDW
In the BZ of the three points – , , – and the three points – , , – are equivalent thanks to the three-fold rotation symmetry of the system (see Fig. 2). The vectors and from to and , respectively, have reduced components (cfr. Fig. 2):
| (1) | ||||||
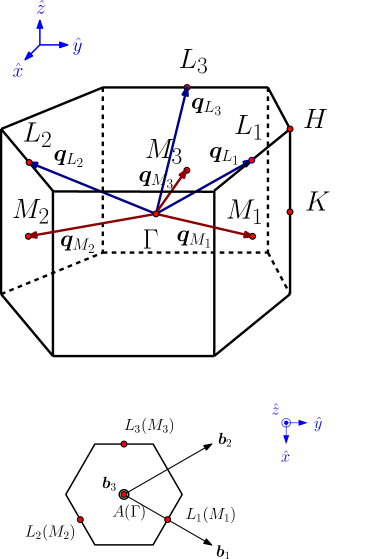
In and the small group is and the decomposition in irreducible representations is:
| (2) |
By using the Density Functional Perturbation Theory (DFPT) we computed the phonon frequencies at and . We found that in all the cases the lowest phonon mode has symmetry with frequency always imaginary except in the case. The values for the phonon frequencies in the case are shown in table Tab.2 and the frequencies of the lowest mode for all the cases are reported in table Tab.3. When a phonon frequency is imaginary we conventionally indicate it with the negative value .
| (meV) | (meV) | |
|---|---|---|
| -10.00 | -9.33 | |
| 12.18 | 12.69 | |
| 14.27 | 14.62 | |
| 17.37 | 17.25 | |
| 17.95 | 17.57 | |
| 20.33 | 20.44 | |
| 23.67 | 23.48 | |
| 24.78 | 24.93 | |
| 37.00 | 37.84 |
| (meV) | (meV) | |
|---|---|---|
| -10.38 | -9.17 | |
| -9.83 | -8.28 | |
| -9.61 | -8.03 | |
| +4.32 | +7.13 | |
| -13.14 | -13.18 | |
| -10.01 | -9.34 |
III.1 Ab-initio analysis of the structural instability
The imaginary phonon frequencies in and correspond to a structural instability consistent with a or a real-space superstructure. In order to study the distortions which lower the energy we consider the corresponding supercell of the undistorted crystal (which has 24 atoms) and the 72 dimensional space whose general element is the displacement of the -th atom of the supercell along the cartesian coordinate .
For the superstructure the eight points , , and of BZ all refold to the point. Thus, the space is equal to the orthogonal sum of the corresponding nine dimensional subspaces , , , :
| (3) |
| (4) |
whose vectors describe distortions with a definite modulation character with respect to the original unit cell of the undistorted phase. In particular and are made of plane-wave lattice distortions with wave vector and , respectively, that is distortions having the atomic displacement of the -th atom in the -th unit cell given by:
| (5) |
where is the -th lattice vector and gives the amplitude of the displacement for the -th atom in the unit cell of the origin.
If is the energy of the system per supercell as a function of the distortion, in the harmonic approximation it is:
| (6) | ||||
| (7) |
and by grouping the two indeces we obtain a real-symmetric matrix which has couples of real eigenvalues and eigenvectors , so that for the distortion the system has the variation of energy:
| (8) |
where is the euclidean norm of . A negative eigenvalue corresponds to a displacement which lowers the energy of the system.
By using the DFPT we calculated and subsequently we diagonalized it. Because of the symmetry, we obtained the same spectrum for the three spaces and the three spaces with the corresponding displacements related by threefold rotations. Consistently with the phonon analysis we found, for each of these space, two eigenspaces with symmetry , one of them with negative eigenvalue. Since we are interested in the instabilities of the system we focus on this kind of distortions.
III.2 The distortions
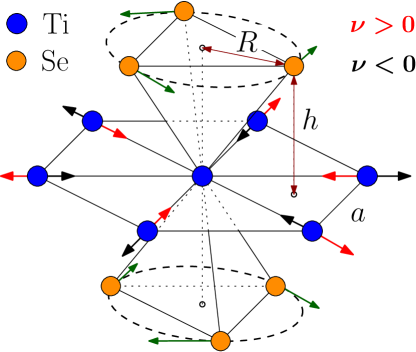
The displacements , for a point or , are transversal to the direction of propagation , planar (i.e. with zero component outside the -plane) and opposite for selenium atoms and on two adjacent wave-fronts. We indicate with the ratio between the displacements of the titanium atoms on a wave-front and the selenium atoms on an adjacent wave-front:
| (9) |
Thus, the sign of indicates if the displacement of two adjacent Ti and Se front waves are in phase () or out of phase () (see Fig. 3).
These modes form a two dimensional vector space made of displacements along a fixed line, where the only two free parameters left are the values of the shifts. We indicate with the shift of the Ti atoms on a displacement wave-front along a given direction and with the displacement of the Se atoms on an adjacent wave-front along the opposite direction (see Fig. 3). It is .
By using the two parameters , the space can be represented as in Fig. 4.
By symmetry, two displacements with opposite values for both and are equivalent whereas by changing the relative phase between the shifts of the Se and the Ti atoms we obtain two different configurations. In fact, a significant parameter is the ratio which identifies a one dimensional subspace of . Therefore, a general is uniquely identified either by and or, for example, by and ().
Each of the two orthogonal one-dimensional eigenspaces of symmetry found by diagonalizing is characterized by a specific value of the ratio, one positive and the other negative. In fact, it can be shown that two generic one-dimensional subspaces and , corresponding to different values of the ratio and , are orthogonal if and only if . We found that, in all the studied cases and in both the points and , the with the smallest eigenvalue corresponds always to the positive ratio , that is to the out of phase distortion. The values found for the smallest and the corresponding in the point () and (), for all the cases, are reported in Tab. 4. From now on we analyze only the cases where the system displays instability, so we do not consider anymore.
| -1.07 | 2.89 | -1.37 | 2.93 | |
| -0.89 | 2.60 | -1.26 | 2.53 | |
| -0.84 | 2.64 | -1.20 | 2.56 | |
| +0.69 | 2.34 | +0.25 | 2.42 | |
| -2.26 | 2.46 | -2.25 | 2.43 | |
| -1.14 | 2.51 | -1.31 | 2.46 | |
| – | – | – |
The value () defines (up to a sign) three orthogonal unit vectors () corresponding to degenerate displacements of type which generate a three dimensional space (). By considering displacement vectors in this space with an increasing moduls but fixed direction, we can study the energy variation of the system along a pattern. We observe that the energy, after an initial parabolic decrease, starts departing from the harmonic regime, reaches a minimum and then increases (cf. Fig. 5). The minimum along this energy path corresponds to the configuration which gives the most stable structure obtainable with that kind of distortion. In general, different patterns in () return different results as for finite displacements the symmetries of the lattice are not preserved.
III.3 The single-point and triple-point patterns
The displacement pattern of type characterized by a unit vector () is also called a single- pattern (single- pattern). In Fig. 5 we show, for the several studied cases, the energy path for the single- patterns in and . As we can see the distortion of type returns always a structure more stable than the distortion of type , except in the case where the two energy patterns approximatively coincide, meaning that the interaction between layers plays a not negligible role in the minimization of the total energy unless their distance is large enough. Moreover, as long as the cell dimensions are comparable, we find similar results irrespective of the local functional used. Instead in the case, where the volume of the unit cell is larger (see Tab. 6), the energy gain due to the distortion is higher. These considerations leads to the conclusion that the suppression of the instability in the case is ascribable to a pure volume effect, since the LDA theoretical unit cell is smaller than the experimental one (see Tab. 6).
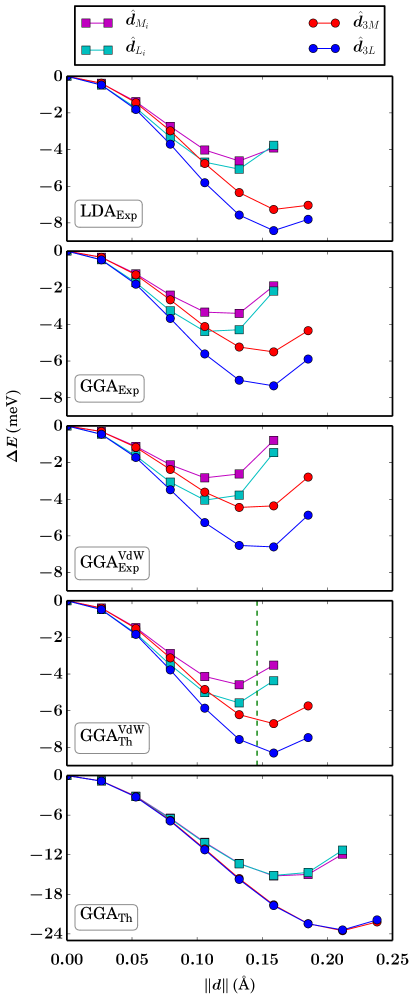
The pattern characterized by the unit vectors and obtained by combining the three directions and
| (10) |
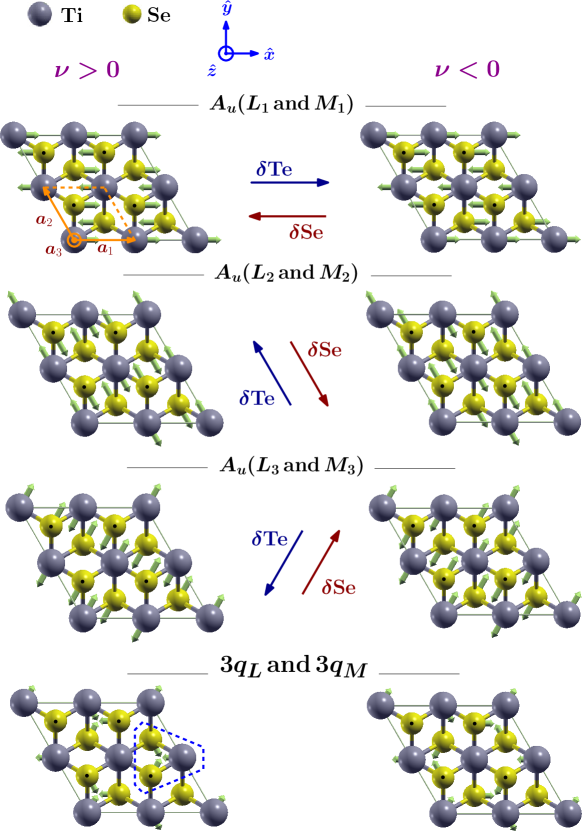
are called a triple- () pattern and a triple- () pattern, respectively. In fact, by definition, a general triple- distortion of type () is obtained by superimposing, with equal weights, three distortions for the points () having the same values of and .
In a layer, the shifts of the atoms in a 3 distortion can be described by considering the octahedral structure of the system doi:10.1021/ja00050a044 (see Fig. 1). We distinguish two kinds of Ti and Se atoms: in one the Ti() atoms do not move and are in the middle of an octahedron Ti()Se()6 where the three Se() atoms above Ti() and the three Se() atoms below Ti() rotate with opposite direction. Thus, there are couples of Se()’s which become closer and, depending on weather the component three modes have or , they attract or repulse a Ti() atom (in the first case, as a consequence, we observe a Ti()-Se( bond shortening and the formation of three-atoms clusters in the system). In the distortion we also have Se() atoms which are not involved in any rotation (they are originally in octahedra centered around Ti() atoms) but stay in their position.
For an adjacent layer, depending on whether we are considering a or a distortion, the displacement of the atoms is the same or the opposite one (i.e. in the case if in one layer the Se()’s on the upper plane and lower plane show a clockwise and a counterclockwise rotation the opposite happens in an adjacent layers, respectively). Two distortions with and , in a layer and view from above, are shown in Fig. 3.
III.4 The CDW distortion
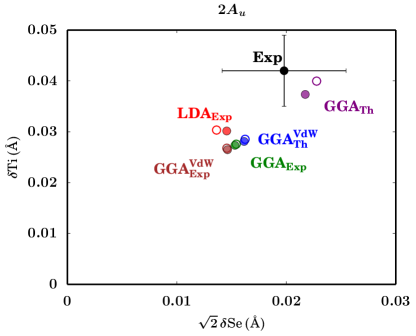
In their seminal paper Di Salvo and coworkers stated that, according to neutron-diffraction measurements and symmetry considerations, the lattice distortion experimentally observed with the CDW is a mode with , with data taken at 77 K which best fitted with the values PhysRevB.14.4321 :
| (11) | ||||
for the displacements of the atoms in the single component modes. These values correspond, for the complete pattern, to the displacements:
| (12) | |||
for the Ti and Se atoms which actually move (in a mode not all the atoms move). The experimental values for the displacements in a single component mode are also shown on the diagram in Fig. 4 and correspond to the experimental estimate for the ratio:
| (13) |
Motivated by these experimental results we calculated the energy pattern of the mode in for the several studied cases. Moreover, in order to study the role played by the interaction between layers, we also calculated the energy pattern of the distortion in . The results are shown in Fig.5. As we can see a triple- pattern returns always a structure more stable than the corresponding single- displacement and it is always the distortion wich gives the lowest energy (except in the case where the modes and are almost degenerate). Moreover, as for the single- patterns, when the cell dimensions are comparable we find similar results, irrespective of the local functional used.
| (meV) | |||
|---|---|---|---|
| EXP | – | ||
| -8.4 | 0.030 | 0.010 | |
| -7.4 | 0.027 | 0.011 | |
| -6.8 | 0.026 | 0.010 | |
| -23.4 | 0.037 | 0.015 | |
| -8.3 | 0.028 | 0.011 |
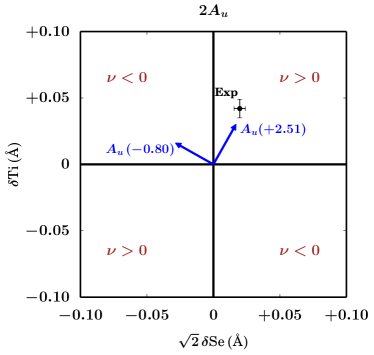
In Tab. 5 we report, for the minimum point of the energy pattern, the values of the energy variation (per supercell) and the shift of the atoms (for the component single- modes) with respect to the undistorted crystal. The values of the displacements for the several cases, compared with the experimental result, are also shown in Fig. 6 (which corresponds to a portion of the diagram in Fig. 4).
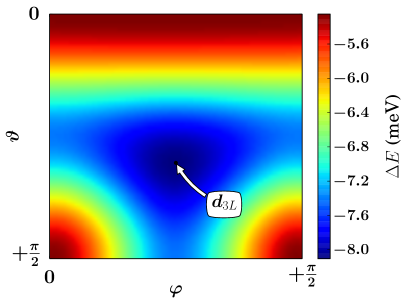
The fact that a pattern gives a structure more stable than the single pattern is in agreement with the experimental findings but, in order to demonstrate that the ab-initio calculations are able to predict the experimental results, it is necessary to go further and demonstrate that the pattern gives the most stable structure among all the possible distortions in . Since we expected analogous results in all the cases analyzed we just considered the one. In order to accomplish the task, we should have considered a uniform sample of the unit sphere in and computed the energy path for an increasing modulus of the distortion along each of these directions. Instead, in order to reduce the workload, we just computed the energy of the system for distortions having a fixed modulus , where is a length approximately in half position between the minimum along the and the patterns (cf. Fig. 5). In this way we only needed to scan the energy of the system for a uniform grid on the two dimensional sphere in with radius . We used the basis to parametrize the space and the fact that given a general vector all the other vectors obtained from it by changing the sign of its components give equivalent distortions. Therefore, we considered only one octant of the sphere of radius to obtain a general scan of the surface:
| (14) |
An heatmap plot of the results obtained is showed in Fig. 7: our calculations confirm that on this sphere the pattern (which has components ) returns, among all the possible patterns in , the most stable structure. We conclude that, in the frame of the electron-phonon interaction, by using first-principle calculations we are able to recover the CDW structural instability experimentally observed for .

III.5 Optimization of crystal structure in the
CDW phase
In order to find the equilibrium configuration for the distorted system we subsequently relaxed the structure starting from the configuration corresponding to minimum of the energy along the path.
| (meV) | ||||||
|---|---|---|---|---|---|---|
| EXP | – | – | – | – | ||
| -9.4 | 0.030 | 0.010 | -0.0003 | 0.0011 | -0.0001 | |
| -8.7 | 0.028 | 0.011 | -0.0003 | 0.0016 | 0.0004 | |
| -7.9 | 0.027 | 0.010 | -0.0002 | 0.0014 | 0.0004 | |
| -27.6 | 0.040 | 0.016 | -0.0018 | 0.0031 | -0.0038 | |
| -9.5 | 0.029 | 0.011 | -0.0004 | 0.0010 | -0.0006 |
We relaxed the whole structure (cell and internal positions) or only the internal positions depending on whether we were considering the theoretical or the (fixed) experimental cell. This led to a further small gain in energy with respect to the undistorted phase (see Tab. 6).
As it can be seen from Tab. 7, the effect of the relaxation on the lattice parameters is quite small, with a relative variation of the order of . For the internal displacements we define the vectors in , and , characterizing the atomic shifts from the undistorted phase to the minimum along the path in and the equilibrium position reached after the relaxation, respectively (in the theoretical cell cases is the relative displacement with respect to the cell). A quantitative measure of the extent of the additional atomic displacements due to the relaxation is obtained by comparing the modulus and the direction of these vectors. The results are shown in Tab. 7 and, as we can see, the two vectors are very similar (only slightly different in the case), meaning that the relaxation does not give an additional huge displacement of the atoms.
| 1.0008 | 0.9992 | – | – | |
| 1.0016 | 0.9981 | – | – | |
| 1.0022 | 0.9985 | – | – | |
| 1.0392 | 0.9918 | 0.0006 | 0.0013 | |
| 1.0046 | 0.9990 | 0.0006 | 0.0006 |
The displacement of the atoms due to the optimization is obviously restricted by the symmetry of the distorted phase. The total displacements is mainly made of a distortion but it also has a small component which changes the value of shown in Fig. 1 (the value of this parameter being not fixed by the symmetry, anymore) and modifies the distances and between the not equivalent Se() and Se() atoms and the Ti plane. As a consequence, in the distorted structure the upper (and lower) Se atoms of a layer are not on the same plane anymore (cf. also Ref. 26). The values found for the atomic displacements are reported in Tab. 6 and, in particular, the updated values of and for the component of the displacement are also shown in Fig. 6.
In conclusion, the energy gain and the component of the atomic displacements obtained in all the studied cases are similar for similar unit cell and the atomic shifts are not far from the experimental measures. In particular, the ab-initio calculations based on the electron-phonon interaction predict the correct displacement pattern for the low energy distortion with the values of the atom displacements slightly underestimated (especially for the Ti). Only for the case, which however uses cell parameters quite different from the experimental ones, we have found different results with, in particular, a larger atomic displacement and a larger energy decrease for the low temperature phase with respect to the other cases.
III.6 Chiral Charge-Density Waves
Quite recently, on the basis of tunneling microscopy PhysRevLett.105.176401 and x-ray scattering PhysRevLett.110.196404 measurements, it has been reported the existence of a second phase transition for which follows the conventional CDW transition and occurs at temperature around K below the . As we have seen, the conventional CDW transition is due to the superposition with equal weights of three modes describing a charge transfer process from Ti-3 to Se-4 orbitals and a related commensurate lattice distortion. The new type of transition is still given by the sum of these three charge transfer waves but with different relative phases, producing an helical distribution of charge along the axis of the cell. As a consequence, there are two possible, energetically degenerate, distributions of charge characterizing two chiral phases related by a mirror transformation. These are the so called Chiral Charge-Density Waves (CCDW) and a driving mechanism for chiral symmetry breaking it has also been proposed. 0295-5075-96-6-67011 One of the most important features of CCDW transition is the reduction of the crystal symmetry from a threefold to a twofold rotation symmetry.
In our simulations we did not see any evidence for a phase different from the conventional CDW: the lowest total energy for the system was obtained by considering the superimposition of the three modes with equal weights. Nonetheless, we find worthwhile to stress that, by using a very simple argument, it is still possible to explain the existence of different chiral domains on the surface of a sample (but not the change of symmetry). As shown in Fig. 1, the CDW transition is characterized, in a cell, by a clockwise or counterclockwise rotation of the Se atoms in the upper layer (and the opposite for the Se in the bottom layer). Thus, for a cell, there are two possible degenerate but different CDW structures that cannot be superimposed solely with rotational transformations and this could naturally led to the formation, on the surface of a sample, of two different chiral domains. We think that this aspect should be properly taken into account when the results of an experiment about the CCDW is interpreted. For the same reason, we believe that a simple surface experiment, like a scanning tunnel microscopy measure, could be misleading and that only a measure of the symmetry change of the crystal can prove the existence of a second phase transition different from the conventional CDW.
IV Electronic structure in the
CDW phase
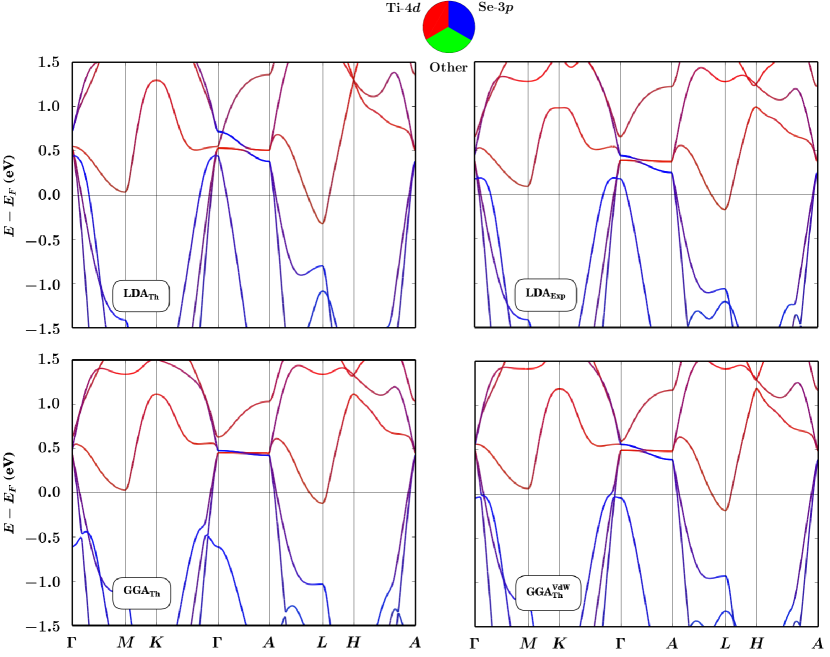
IV.1 Undistorted energy bands
In this section we discuss the evolution of the DFT band structure under the lowest energy distortion found in . In Fig. 8 we can see the undistorted bands of around the Fermi level () for an high-symmetry path (cf. Ref.30). The atomic/orbital character of the bands is also shown (cf. Ref.26). In all the cases we find similar results: around the Fermi level there are only Ti- and Se- derived bands with a narrow Ti- band which is almost entirely unoccupied except around the point where it crosses the Fermi level and forms a hole pocket; moreover, two Se- and Ti- strongly hybridized bands cross the Fermi level. A qualitative difference is instead found for a narrow Se- band whose position mostly depends on the cell dimensions (in particular on the distance between the Se and the Ti atom planes) but not on the local functional used. In fact, as we increase the value of we observe a lowering of the band maximum in (in addition to an increase of the structural instability, as we have seen in the previous section). Nevertheless, as we will see, this band does not change during the distortion.
IV.2 Energy bands and DOS in the CDW phase
We are interested in the evolution of the band structure induced by the distortion. From now on we consider the cases and . With the subscript ‘sc’, set below the labels of the special points in the BZ, we refer to the corresponding points of the super-cell Brillouin zone (SBZ) which has the same shape of the BZ but half size.
In Fig. 9 we show the bands, around the Fermi level, for an high symmetry line of the SBZ for the undistorted and distorted phase, the last one corresponding to the minimum of the energy along the distortion path in . On formation of the superstructure we observe a neat change near the Fermi level with similar characteristics in the two cases. In particular, around we find avoided crossings at the Fermi level and, just below it, the appearance of a (reversed) Mexican-hat structure due to the repulsion of bands having Ti-3 character (see Fig. 9). The Se-4 bands crossing the Fermi level around the wave vector , instead, do not suffer any modification during the distortion, as anticipated.
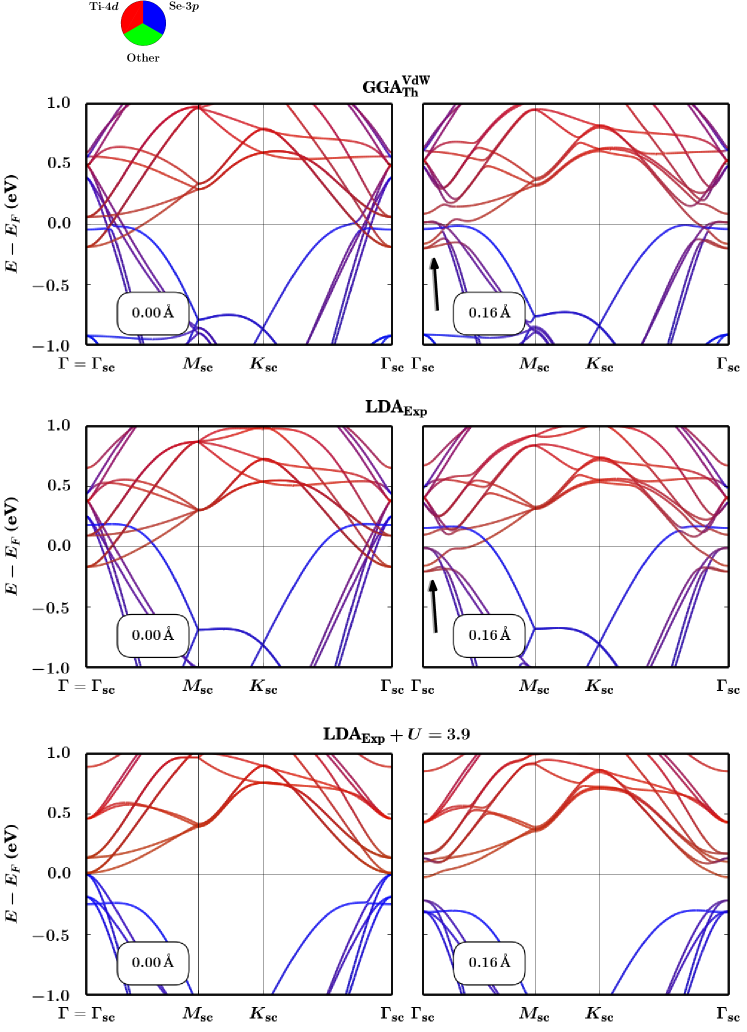
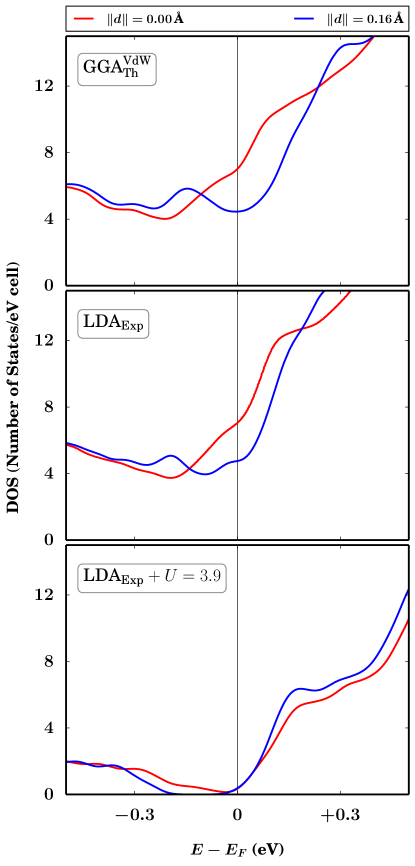
As expected, the change of the electronic dispersion around the Fermi leads to a change of the Density of States (DOS) as it is shown in Fig. 10. On forming the superlattice structure the DOS decreases by around 40% at and a peak, essentially due to the Ti-4 orbitals, develops at eV below . These effects have been qualitatively observed in some previous theoretical works (see Ref.31, for example, for a tight-binding study) and are, at some level, compatible with the change of the resistivity experimentally observed in the CDW transition PhysRevB.14.4321 .
IV.3 Energy bands folding and unfolding
The superlattice distortion doubles the original lattice periodicity of the system. In fact, each eigenfunction of the distorted system has the pseudo-momentum in the SBZ, which is one-eighth of the original BZ. Nevertheless, the function is made of eight contributions which are functions pseudo-periodic on the original lattice and whose pseudo-momenta are obtained by unfolding to the original BZ:
| (15) |
The spectral weights :
| (16) |
can be used to evaluate the contributions to coming from different points of the original BZ (see appendix A).
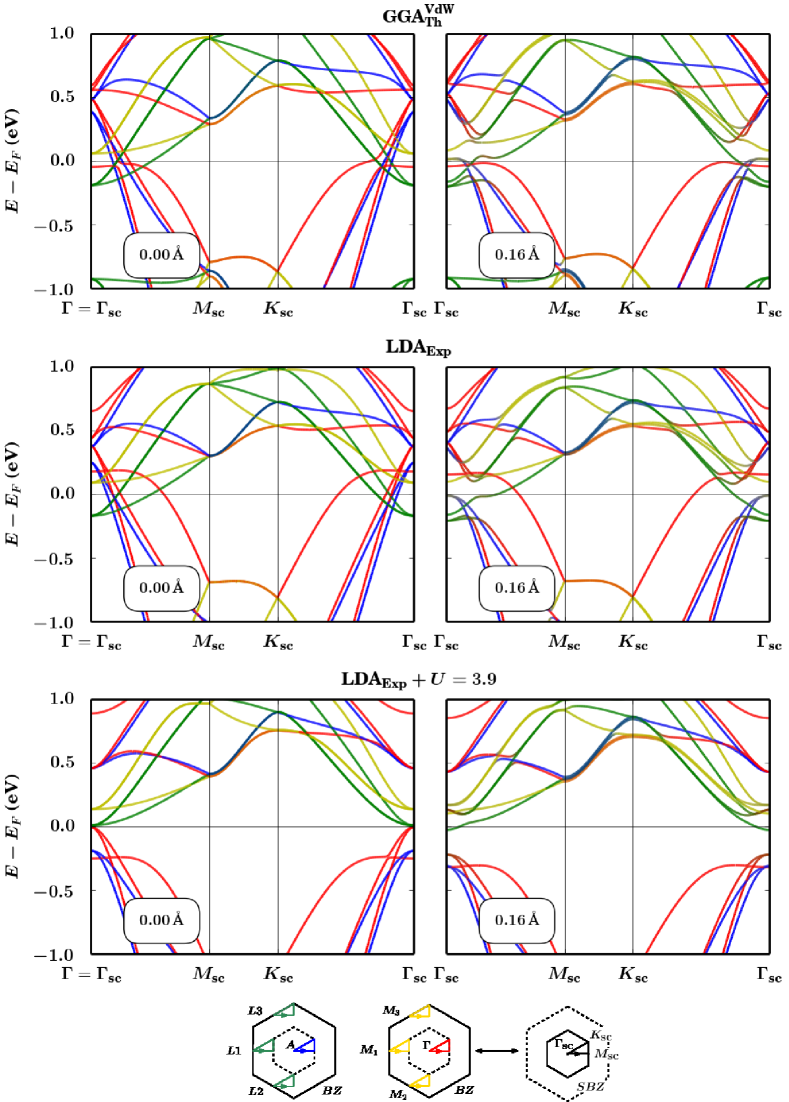
From geometrical considerations we see that in our case the SBZ can be unfolded into eight regions of the BZ centered around the points , respectively, and we can use this property to label the corresponding unfolding weights. Moreover, due to the threefold symmetry of the system, for a point it is convenient to sum the contributions coming from the three equivalent points, and the same for the contributions coming from the three points: in this way we have four contributions of type depending on the BZ portion they came from. In Fig. 11 the weights of these four contributions on the bands are shown by means of a color code. In this way we easily recognize, for example, that the characteristic band configuration under in has a pure character.
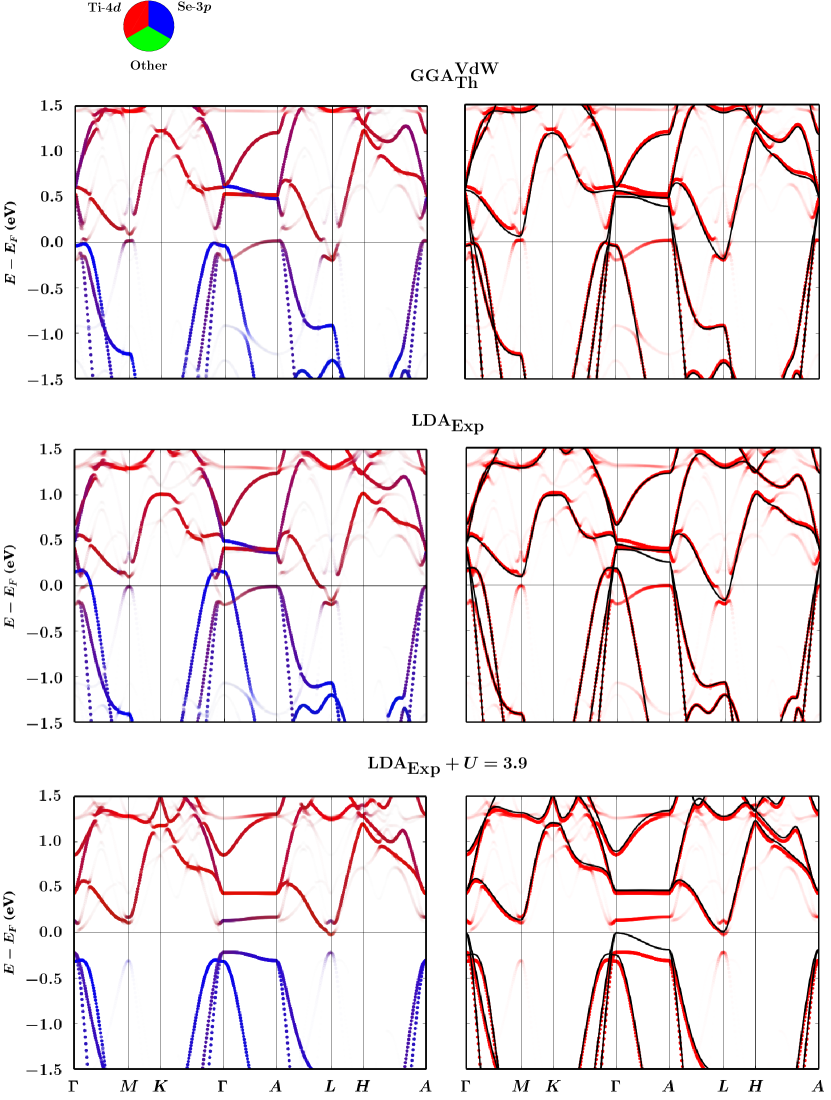
A complementary method to describe the distortion in the frame of the original translation symmetry (and best suited to make a direct comparison with ARPES experiments) is to unfold the superlattice band structure from SBZ to the original BZ PhysRevLett.104.236403 ; PhysRevLett.104.216401 . This consists in plotting for the points of a line in the BZ the energy bands of the distorted system with an intensity equal to the spectral weights (for we have full transparency, i.e. no band, and for full opacity). In this way the displacement of the atoms is observed as a distortion, smearing and fade of the original bands, plus the appearance of new ghost bands. In Fig. 12 the unfolded bands with the orbital character are shown. In order to ease the comparison with the undistorted phase we also superimpose the unfolded bands on the original band structure. From these figures we can clearly see what is principal effect of the distortion: the Ti-4 bands which were crossing the Fermi level now open a gap whereas the Se-3 bands essentially remain unaffected. Moreover we see the appearance of a ghost band in which gives the characteristic structure we have already discussed.
V Comparison with ARPES
V.1 and
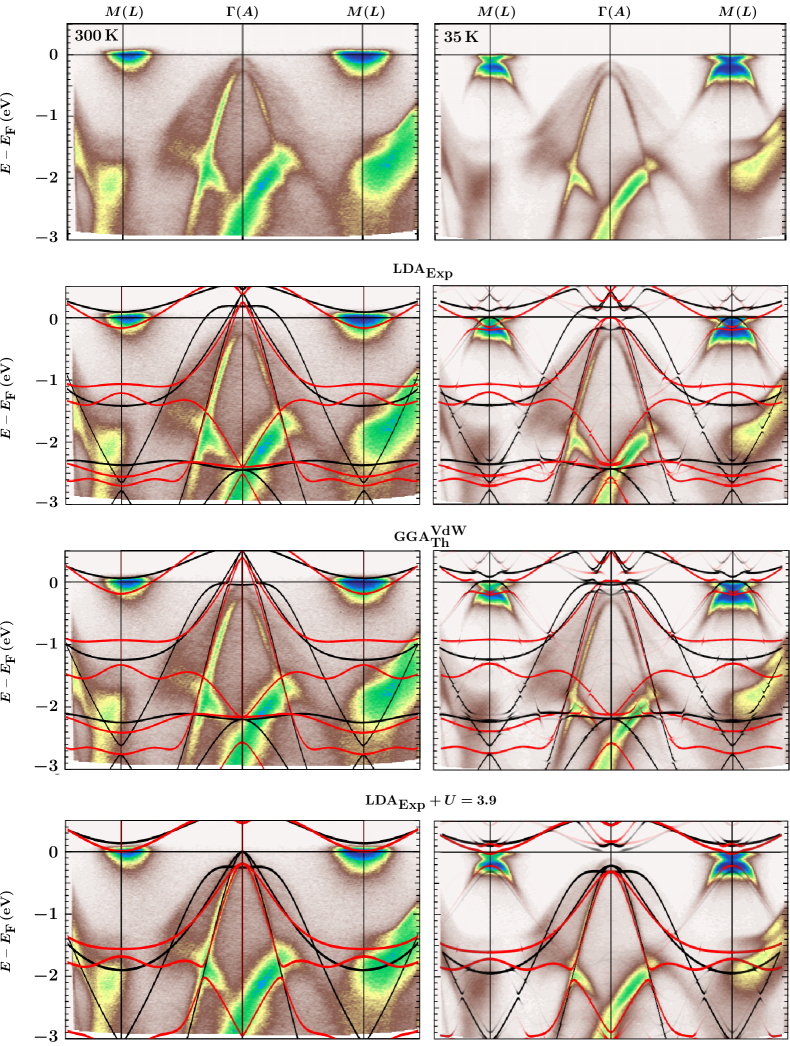
In the previous sections we analyzed the kind of distortion which lowers the total energy of the system and the consequent changes in the electronic structure as they are found by ab-initio DFT calculations. In this section we compare the results of the calculated band structure and the ARPES data taken from Ref. 34. In Fig. 13 we show the DFT bands for the undistorted and distorted phases superimposed on the ARPES data taken at high ( K) and low ( K) temperature, respectively. Due to the indetermination of in the ARPES, and the substantial dispersion in the electronic structure, we consider the DFT bands along the two directions and in BZ. In the high temperature case we simply plot the bands along these two lines for the undistorted system and in the low temperature case we plot the bands of the distorted structure unfolded to BZ along these two directions. In this second case, in order to ease the comparison with the underlying figure, we slightly enhanced the intensity of the unfolded bands by scaling the whole transparency by a factor :
| (17) |
As we can see, the effect of the distortion on the theoretical bands can be considered in reasonable agreement with the experimental data for the low temperature phase (in particular it is remarkable that the Mexican-hat found in seems to reproduce an experimentally observed feature). Nevertheless, there are features in the bands which seem to be not compatible with the ARPES findings. This is even more evident for the high temperature phase since in this case the ARPES data are not in good agreement with the bands of the undistorted structure. In the second case, a possible reason for the mismatch could be the effect of phonon quantum fluctuations on the electronic structure, which are obviously stronger when we consider higher temperatures and which are not taken into account in our “zero temperature” calculations. More generally, a possible explanation for the not perfect agreement between ARPES and the calculated bands in both the phases could be the effect of the correlation due to the localized orbitals of Ti (correlation which is not taken into account in a pure DFT calculation). We explored this possibility by using the DFT+ method (in particular the LDA+ method) and in the next section we show the results of this analysis.
V.2 +
As explained in Sec. II, we considered the Hubbard-like correction to the electronic structure of . We used the experimental cell, the internal theoretical coordinates obtained with LDA and, on the top of this, the correction for the Ti- orbitals. The most evident effect of introducing is to open a gap between the bands with the result of obtaining, for , a metal-insulator transition (see Fig. 14).
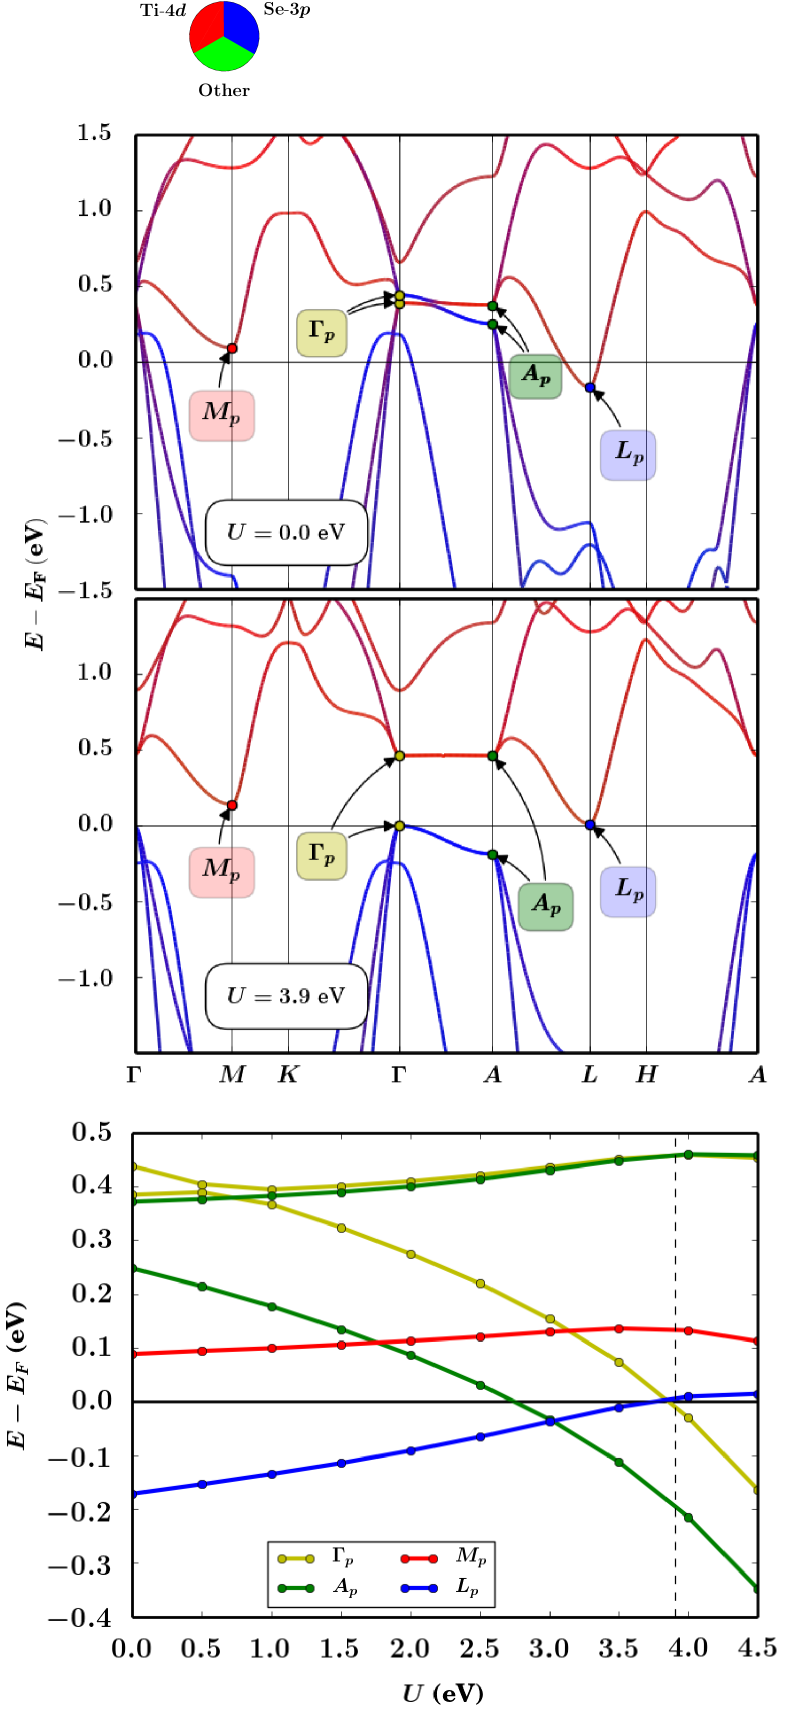
Motivated by this result, we found appropriate to estimate ab-initio the proper value of by using a self-consistent procedure. In a few steps we obtained the converged value for which the system is in an insulating phase with a small gap of approximatively (see Fig. 14). This result is in line with a recent observation PhysRevLett.101.237602 , although another optical experiment PhysRevLett.99.027404 ) has found a semi-metallic state in both the high-temperature and low-temperature phases. Nevertheless, the + result seems to be closer to the experimental observations than the large negative gap obtained with pure DFT calculations.
We used the same value of also for the distorted structure found in the case. We observe that the distortion has, on the electronic bands, the same qualitative effect already observed without , the shift of the Ti- bands now increasing the initial small band gap up to a value of approximatively eV (see Fig. 9, 10, 11, 12). In the lowest panel of Fig. 13 we compare the calculated bands with ARPES data: now the theoretical results for both the distorted and undistorted structure are in very good agreement with experimental data taken at high and low temperature, respectively.
According to these results, the correction provided by seems to solve even the last dubious results regarding the comparison between the DFT electronic structure and the experiment, in particular by giving a perfect match between the theoretical bands and the ARPES data. Unfortunately, a serious drawback of this approach is that the presence of eliminates the instability.
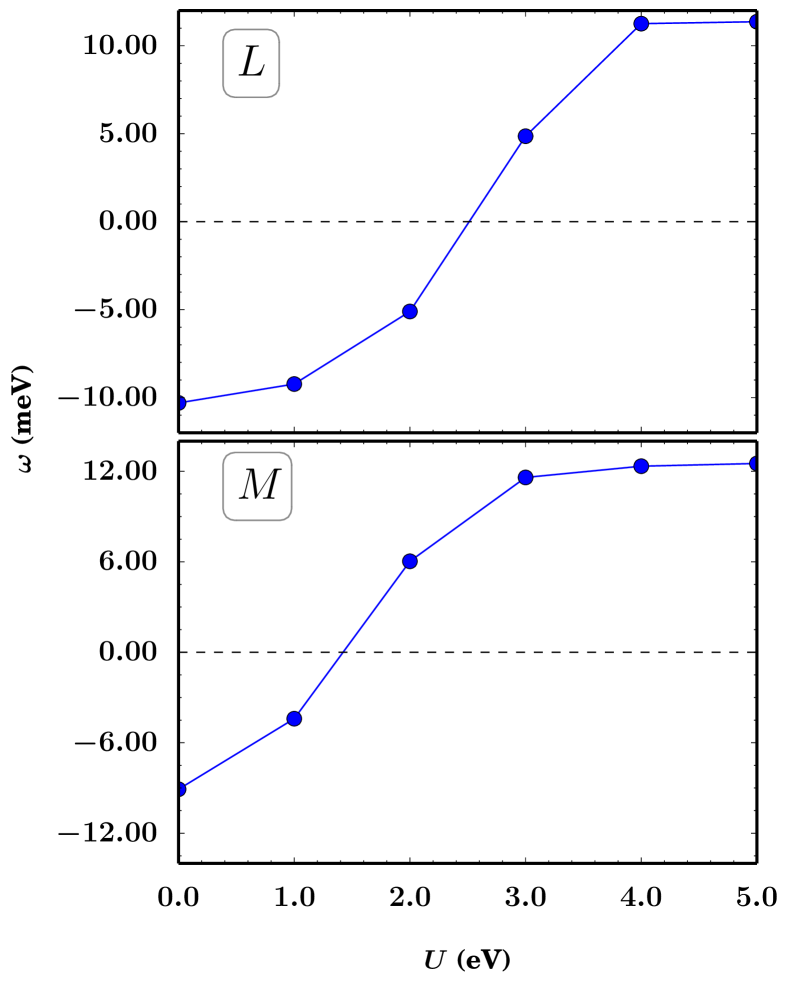
In Fig 15 we show the lowest phonon frequency () in () as a function of calculated by using the finite-difference method. When a phonon frequency is imaginary we conventionally indicate it with the negative value . We considered the LDA system with experimental cell and internal coordinates now obtained by relaxing the atomic positions for each value of . It can be observed that the frequencies, which are negative (i.e. imaginary) for , increase as we increase and begin to have a positive value around for and for . A phonons converged calculation with this method was revealed to be extremely costly, especially for values of close to the metal-insulator transition, so we also explicitly verified that the total energy of the system increases as we move the atoms along the expected distortion pattern. We performed similar tests also for the other cases and we reached a similar conclusion: the DFT+ system is not unstable anymore for the value of which seems to return the best agreement between the undistorted bands and the high temperature ARPES data (notice that this value is functional-dependent, being not a physical measurable quantity).
At this point an intriguing question arises: on one hand it seems that we are able to correct the energy band structure by using , but on the other hand the same correction spoils the prediction of the instability driven by the electron-phonon coupling, a prediction whose reliability, in turn, strongly depends on the correctness of the energy evaluation.
A first possible explanation for this apparent paradox could be in the simplistic approach used to describe the structural instability with . In general, the energy of a DFT+ system (with cell fixed) is given by a function of the atomic positions and the values for the orbitals. Moreover, for a certain atomic configuration we have a proper value for the Hubbard terms. So the total energy of the system as a function of the atomic positions, , is given by:
| (18) |
and when we consider the forces and the force constant matrix (through the first and second derivative of with respect to the positions , respectively) we should take into account the full dependency on the atomic positions. On the contrary, a commonly accepted procedure is to neglect the dependence of the Hubbard terms on and to move the atoms by keeping fixed the values of found for the undistorted system. This is the approach we considered in our study but its correctness seems to be questionable in this case since even a small variation of (so small that it does not affect the energy bands position) leads to a total energy variation which is huge if compared with the energy decrease obtained with the distortion. For example, during the self-consistent calculation of , we found that for the system has a variation of the total energy .
Therefore, in general, we expect that in order to make a proper structural analysis of in the DFT+ scheme it is necessary to take into account the full position dependence (and consider that in the distorted phase we have two not equivalent Ti sites with, in principle, two different values of ). But it also means that, for example, a careful study of the convergence of with the size of the supercell used to perform the perturbative calculation should be done. Nonetheless, it seems that, in general, the precision required for the value of (at least eV) is unrealistic and probably rules out the use of a DFT+ method in this form.
A second consideration relies on the variation shown by the frequencies and with . In fact, we observe a monotonic increase of these two quantities until the points and in Fig. 14 go below the point and the point , respectively; after that the value of the frequencies essentially remain constant. So it seems that removes the instability because of the change in the relative positions of the bands. Thus, it could be impossible to maintain the lattice instability and, at the same time, reproduce the high temperature ARPES experiment. This would confirm the difficulty of predicting the high temperature energy dispersion with a DFT(+) band calculation.
VI Conclusions
In this work we have presented a first-principle study of the charge-density wave in by using first-principle DFT calculations. We have considered several local functionals and both experimental and theoretical cell parameters.
We have shown that the results are robust with respect to the local functional used, whereas they depend essentially on the distance between the layers, a larger distance corresponding to an higher instability. In fact, no instability is observed in the LDA case with zero theoretical pressure, in this case the distance between the layers being smaller than the experimental one. On the contrary, as long as the cell parameters are in agreement with the experiments, or even larger, the calculations reproduce not only the structural instability but also the triple- distortion observed in neutron diffraction experiments. We have also explicitly analyzed the role of the interaction between layers by considering distortions of type and . We have concluded that, in both the points of the BZ, is the triple- distortion which always gives the most energetically favorable configuration, elucidating the importance of the in-plane displacements in order to lower the total energy. Nevertheless, as long as the layers are close enough to have a significant interaction, the distortions are always more favorable than the ones, meaning that the intra-layer interaction plays a not negligible role in the CDW transition.
We have also analyzed the changes in the electronic structure of the system with the CDW formation. In the experiment, the phase transition is accompanied by changes in the transport properties. We have found modifications in the calculated bands near the Fermi level, with a resulting depletion in the DOS, which are compatible with the changes measured in the resistivity. The bands for the superstructure have also been unfolded into the undistorted BZ in order to analyze their evolution with the phase transition and compare them with the findings of an ARPES experiment. We have shown that the unfolded bands of the distorted structure are in reasonable agreement with the low-temperature ARPES data. Nevertheless, the bands for the undistorted phase are in not good agreement with ARPES.
In order to correct the mismatch between ARPES data and band calculations we have explored the role of the correlation of the Ti- electrons by performing an LDA+ calculation. We have estimated ab-initio, self-consistently, the value of the parameter for the localized Ti- orbital in the undistorted structure. For this value of , the Hubbard-like correction opens a small indirect gap in the electronic bands of the undistorted phase, whereas a pure DFT calculations provides a semi-metallic configuration with a large negative gap. This result is compatible with some recent experiments. More importantly, the LDA+ bands are in very good agreement with the results of an high-temperature ARPES experiment. By using the same value of for the distorted structure, we have shown that the CDW increases the size of the band gap. The unfolded bands of the distorted phase are also in good agreement with the low-temperature ARPES data.
The drawback of the LDA+ approach is that the correction removes the instability, the phonon frequency in and becoming real as we increase the value of . A possible explanation for this effect has been identified in the neglected, but in principle existing, dependence of the value of from the atomic positions. On the other hand, the loss of the instability could be the correct result of the electronic bands displacement caused by the local-chemistry correction given by in . This would be compatible with the suppression of the CDW observed in the ternary crystals for PhysRevB.14.4321 . In fact, at variance with , has no CDW instability, but the electronic structures of these two systems are very similar, the relative position of the valence and conduction band being the main relevant difference: while is a small-gap semiconductor/semi-metal, is a semiconductor with a bigger gap.
In conclusion, we have shown that the CDW phase in can be fully predicted by considering only the electron-phonon coupling and neglecting any electron many-body effect. An incongruence remains between the DFT bands and the experiments, especially for the high-temperature phase. The simple correction provided by the Hubbard-like term corrects this aspect, but it doest not provide a fully coherent picture as it spoils the phonon instability. This represents an open issue which deserves to be examined in future studies.
Acknowledgements.
The authors acknowledge financial support of the Graphene Flagship and of the French National ANR funds within the Investissements d’Avenir program under reference ANR-13-IS10-0003-01. Computer facilities were provided by PRACE, CINES, CCRT, IDRIS and by the project Equip@Meso (reference ANR-10-EQPX-29-01). The authors are grateful to K. Rossnagel, for having supplied to them the image data of ARPES experiment as well as detailed explanations of the measures realized, and to M. Cococcioni for useful discussions about the DFT+ method. R. Bianco thanks L. Paulatto for the support given in the use of Quantum ESPRESSO package.Appendix A Folding and Unfolding, definition of the spectral weights
We label with and the direct and reciprocal lattice vectors of the unit cell, respectively. Moreover, we define and as the direct and reciprocal lattice vectors of the supercell, respectively. We find eight vectors (defined up to a vector of ) whose differences are not vectors of :
| (19) | ||||
In the coordinates relative to it is, for example:
| (20) | ||||||
By using these vectors we can unfold a general to eight :
| (21) |
and write:
| (22) |
where is the projector on the space of the Bloch functions having pseudo-momentum with respect to , that is is a function such that:
| (23) |
The square modulus of is, by definition, the unfolded weight of the superlattice band in :
| (24) |
In order to plot the unfolded energy spectrum along an high-symmetry line of BZ, for each of this line we considered the superstructure eigenvectors and eigenvalues , where is the SBZ point where fold into:
| (25) |
Notice that, properly speaking, and are not simple vectors: they represent classes of vectors defined up to the sum with an element in and , respectively; so even if the representatives and are equal they refer to different set of vectors. Then we plotted the bands with intensity:
| (26) |
corresponding to full transparency (no band) and to full opacity.
References
- (1) F. J. Di Salvo, D. E. Moncton, and J. V. Waszczak, Phys. Rev. B 14, 4321 (Nov 1976), http://link.aps.org/doi/10.1103/PhysRevB.14.4321
- (2) M. Holt, P. Zschack, H. Hong, M. Y. Chou, and T.-C. Chiang, Phys. Rev. Lett. 86, 3799 (Apr 2001), http://link.aps.org/doi/10.1103/PhysRevLett.86.3799
- (3) K. Motizuki, Structural Phase Transitions in Layered Transition Metal Compounds, Physics and Chemistry of Materials with A (Springer, 1986) ISBN 9789027721716, http://books.google.fr/books?id=jH9u5Qc-m1oC
- (4) S. Hellmann, T. Rohwer, M. Kalläne, K. Hanff, C. Sohrt, A. Stange, A. Carr, M. Murnane, H. Kapteyn, L. Kipp, M. Bauer, and K. Rossnagel 3 (2012)
- (5) K. Rossnagel, Journal of Physics: Condensed Matter 23, 213001 (2011), http://stacks.iop.org/0953-8984/23/i=21/a=213001
- (6) H. Cercellier, C. Monney, F. Clerc, C. Battaglia, L. Despont, M. G. Garnier, H. Beck, P. Aebi, L. Patthey, H. Berger, and L. Forró, Phys. Rev. Lett. 99, 146403 (Oct 2007), http://link.aps.org/doi/10.1103/PhysRevLett.99.146403
- (7) J. A. Wilson, physica status solidi (b) 86, 11 (1978), ISSN 1521-3951, http://dx.doi.org/10.1002/pssb.2220860102
- (8) J. A. Wilson, Solid State Communications 22, 551 (1977), ISSN 0038-1098, http://www.sciencedirect.com/science/article/pii/0038109877901338
- (9) H. P. Hughes, Journal of Physics C: Solid State Physics 10, L319 (1977), http://stacks.iop.org/0022-3719/10/i=11/a=009
- (10) K. Rossnagel, L. Kipp, and M. Skibowski, Phys. Rev. B 65, 235101 (May 2002), http://link.aps.org/doi/10.1103/PhysRevB.65.235101
- (11) E. Morosan, Zandbergen, B. S. Dennis, J. W. G. Bos, Y. Onose, T. Klimczuk, A. Ramirez, N. P. Ong, and R. J. Cava 2 (2006)
- (12) A. F. Kusmartseva, B. Sipos, H. Berger, L. Forró, and E. Tutiš, Phys. Rev. Lett. 103, 236401 (Nov 2009), http://link.aps.org/doi/10.1103/PhysRevLett.103.236401
- (13) M. Calandra and F. Mauri, Phys. Rev. Lett. 112, 049702 (Jan 2014), http://link.aps.org/doi/10.1103/PhysRevLett.112.049702
- (14) P. Giannozzi, S. Baroni, N. Bonini, M. Calandra, R. Car, C. Cavazzoni, D. Ceresoli, G. L. Chiarotti, M. Cococcioni, I. Dabo, A. Dal Corso, S. de Gironcoli, S. Fabris, G. Fratesi, R. Gebauer, U. Gerstmann, C. Gougoussis, A. Kokalj, M. Lazzeri, L. Martin-Samos, N. Marzari, F. Mauri, R. Mazzarello, S. Paolini, A. Pasquarello, L. Paulatto, C. Sbraccia, S. Scandolo, G. Sclauzero, A. P. Seitsonen, A. Smogunov, P. Umari, and R. M. Wentzcovitch, Journal of Physics: Condensed Matter 21, 395502 (19pp) (2009), http://www.quantum-espresso.org
- (15) J. P. Perdew and A. Zunger, Phys. Rev. B 23, 5048 (May 1981), http://link.aps.org/doi/10.1103/PhysRevB.23.5048
- (16) J. P. Perdew, K. Burke, and M. Ernzerhof, Phys. Rev. Lett. 77, 3865 (Oct 1996), http://link.aps.org/doi/10.1103/PhysRevLett.77.3865
- (17) S. Grimme, Journal of Computational Chemistry 27, 1787 (2006), ISSN 1096-987X, http://dx.doi.org/10.1002/jcc.20495
- (18) S. Baroni, S. de Gironcoli, A. Dal Corso, and P. Giannozzi, Rev. Mod. Phys. 73, 515 (Jul 2001), http://link.aps.org/doi/10.1103/RevModPhys.73.515
- (19) H. J. Monkhorst and J. D. Pack, Phys. Rev. B 13, 5188 (Jun 1976), http://link.aps.org/doi/10.1103/PhysRevB.13.5188
- (20) C. Riekel, Journal of Solid State Chemistry 17, 389 (1976), ISSN 0022-4596, http://www.sciencedirect.com/science/article/pii/S0022459676800084
- (21) M. Cococcioni and S. de Gironcoli, Phys. Rev. B 71, 035105 (Jan 2005), http://link.aps.org/doi/10.1103/PhysRevB.71.035105
- (22) B. Himmetoglu, A. Floris, S. de Gironcoli, and M. Cococcioni, International Journal of Quantum Chemistry 114, 14 (2014), ISSN 1097-461X, http://dx.doi.org/10.1002/qua.24521
- (23) D. Alfè, Computer Physics Communications 180, 2622 (2009), ISSN 0010-4655, http://www.sciencedirect.com/science/article/pii/S0010465509001064
- (24) H. J. Kulik, M. Cococcioni, D. A. Scherlis, and N. Marzari, Phys. Rev. Lett. 97, 103001 (Sep 2006), http://link.aps.org/doi/10.1103/PhysRevLett.97.103001
- (25) M. H. Whangbo and E. Canadell, Journal of the American Chemical Society 114, 9587 (1992), http://pubs.acs.org/doi/pdf/10.1021/ja00050a044, http://pubs.acs.org/doi/abs/10.1021/ja00050a044
- (26) R. A. Jishi and H. M. Alyahyaei, Phys. Rev. B 78, 144516 (Oct 2008), http://link.aps.org/doi/10.1103/PhysRevB.78.144516
- (27) J. Ishioka, Y. H. Liu, K. Shimatake, T. Kurosawa, K. Ichimura, Y. Toda, M. Oda, and S. Tanda, Phys. Rev. Lett. 105, 176401 (Oct 2010), http://link.aps.org/doi/10.1103/PhysRevLett.105.176401
- (28) J.-P. Castellan, S. Rosenkranz, R. Osborn, Q. Li, K. E. Gray, X. Luo, U. Welp, G. Karapetrov, J. P. C. Ruff, and J. van Wezel, Phys. Rev. Lett. 110, 196404 (May 2013), http://link.aps.org/doi/10.1103/PhysRevLett.110.196404
- (29) J. van Wezel, EPL (Europhysics Letters) 96, 67011 (2011), http://stacks.iop.org/0295-5075/96/i=6/a=67011
- (30) A. Zunger and A. J. Freeman, Phys. Rev. B 17, 1839 (Feb 1978), http://link.aps.org/doi/10.1103/PhysRevB.17.1839
- (31) N. Suzuki, A. Yamamoto, and K. Motizuki, Journal of the Physical Society of Japan 54, 4668 (1985), http://dx.doi.org/10.1143/JPSJ.54.4668, http://dx.doi.org/10.1143/JPSJ.54.4668
- (32) V. Popescu and A. Zunger, Phys. Rev. Lett. 104, 236403 (Jun 2010), http://link.aps.org/doi/10.1103/PhysRevLett.104.236403
- (33) W. Ku, T. Berlijn, and C.-C. Lee, Phys. Rev. Lett. 104, 216401 (May 2010), http://link.aps.org/doi/10.1103/PhysRevLett.104.216401
- (34) T. Rohwer, S. Hellmann, M. Wiesenmayer, C. Sohrt, A. Stange, B. Slomski, A. Carr, Y. Liu, L. M. Avila, M. Kalläne, S. Mathias, L. Kipp, K. Rossnagel, and M. Bauer, Nature 471, 490 (Sep 2011))
- (35) J. C. E. Rasch, T. Stemmler, B. Müller, L. Dudy, and R. Manzke, Phys. Rev. Lett. 101, 237602 (Dec 2008), http://link.aps.org/doi/10.1103/PhysRevLett.101.237602
- (36) G. Li, W. Z. Hu, D. Qian, D. Hsieh, M. Z. Hasan, E. Morosan, R. J. Cava, and N. L. Wang, Phys. Rev. Lett. 99, 027404 (Jul 2007), http://link.aps.org/doi/10.1103/PhysRevLett.99.027404
Supplementary material:
Electronic and vibrational properties of in the
charge-density wave phase
from first principles
Geometrical parameters in the charge-density wave phase
In this Supplementary Material we report the geometrical parameters for the distorted phase obtained in the studied cases. The crystal axes of the hexagonal supercell are in cartesian coordinates (Angstrom units). The atomic positions are given in crystal coordinates. For each case, we report both the set of parameters obtained first by minimizing the energy along the distortion path and then relaxing the structure .
| a | c | |||
|---|---|---|---|---|
| 7.080 | 12.014 | 7.080 | 12.014 | |
| 7.080 | 12.014 | 7.080 | 12.014 | |
| 7.080 | 12.014 | 7.080 | 12.014 | |
| 7.072 | 13.438 | 7.076 | 13.456 | |
| 7.019 | 12.331 | 7.023 | 12.339 |
| Ti | -0.0000000 | -0.0085192 | 0.0000000 | -0.0000000 | -0.0085705 | 0.0000000 |
|---|---|---|---|---|---|---|
| Se | 0.1695741 | 0.3362407 | 0.1247672 | 0.1694345 | 0.3362317 | 0.1249038 |
| Se | 0.3333333 | 0.1666666 | -0.1247672 | 0.3333333 | 0.1666666 | -0.1247564 |
| Ti | 0.0000000 | 0.0085192 | 0.5000000 | 0.0000000 | 0.0085705 | 0.5000000 |
| Se | 0.1637590 | 0.3304256 | 0.6247672 | 0.1637681 | 0.3305653 | 0.6249038 |
| Se | 0.3333333 | 0.1666666 | 0.3752328 | 0.3333333 | 0.1666666 | 0.3752436 |
| Ti | -0.0000001 | 0.4999998 | 0.0000000 | -0.0000001 | 0.4999998 | 0.0000000 |
| Se | 0.1637592 | 0.8333335 | 0.1247672 | 0.1637683 | 0.8332029 | 0.1249038 |
| Se | 0.3333335 | 0.6637594 | -0.1247672 | 0.3332028 | 0.6637684 | -0.1249038 |
| Ti | -0.0000001 | 0.4999998 | 0.5000000 | -0.0000001 | 0.4999998 | 0.5000000 |
| Se | 0.1695743 | 0.8333335 | 0.6247672 | 0.1694347 | 0.8332029 | 0.6249038 |
| Se | 0.3333335 | 0.6695745 | 0.3752328 | 0.3332028 | 0.6694348 | 0.3750962 |
| Ti | 0.5085192 | 0.0085192 | 0.0000000 | 0.5085703 | 0.0085704 | -0.0000000 |
| Se | 0.6666666 | 0.3304256 | 0.1247672 | 0.6667972 | 0.3305653 | 0.1249038 |
| Se | 0.8304258 | 0.1666666 | -0.1247672 | 0.8305654 | 0.1667973 | -0.1249038 |
| Ti | 0.4914808 | -0.0085192 | 0.5000000 | 0.4914297 | -0.0085704 | 0.5000000 |
| Se | 0.6666666 | 0.3362407 | 0.6247672 | 0.6667972 | 0.3362317 | 0.6249038 |
| Se | 0.8362408 | 0.1666666 | 0.3752328 | 0.8362318 | 0.1667973 | 0.3750962 |
| Ti | 0.4914806 | 0.4999998 | 0.0000000 | 0.4914296 | 0.4999998 | 0.0000000 |
| Se | 0.6666668 | 0.8333335 | 0.1247672 | 0.6666667 | 0.8333335 | 0.1247564 |
| Se | 0.8362410 | 0.6695745 | -0.1247672 | 0.8362320 | 0.6694348 | -0.1249038 |
| Ti | 0.5085191 | 0.4999998 | 0.5000000 | 0.5085702 | 0.4999997 | 0.5000000 |
| Se | 0.6666668 | 0.8333335 | 0.6247672 | 0.6666667 | 0.8333335 | 0.6247564 |
| Se | 0.8304259 | 0.6637594 | 0.3752328 | 0.8305656 | 0.6637684 | 0.3750962 |
| Ti | -0.0077212 | -0.0077212 | 0.0000000 | -0.0077862 | -0.0077862 | 0.0000000 |
|---|---|---|---|---|---|---|
| Se | 0.1666666 | 0.3363905 | 0.1276883 | 0.1667914 | 0.3363670 | 0.1278971 |
| Se | 0.3363906 | 0.1666666 | -0.1276883 | 0.3363671 | 0.1667914 | -0.1278971 |
| Ti | 0.0077212 | 0.0077212 | 0.5000000 | 0.0077862 | 0.0077862 | 0.5000000 |
| Se | 0.1666666 | 0.3302759 | 0.6276883 | 0.1667914 | 0.3304242 | 0.6278971 |
| Se | 0.3302760 | 0.1666666 | 0.3723117 | 0.3304244 | 0.1667914 | 0.3721029 |
| Ti | 0.0077211 | 0.4999998 | 0.0000000 | 0.0077861 | 0.4999998 | 0.0000000 |
| Se | 0.1666668 | 0.8333335 | 0.1276883 | 0.1666668 | 0.8333335 | 0.1277357 |
| Se | 0.3302762 | 0.6636096 | -0.1276883 | 0.3304245 | 0.6636332 | -0.1278971 |
| Ti | -0.0077213 | 0.4999998 | 0.5000000 | -0.0077863 | 0.4999998 | 0.5000000 |
| Se | 0.1666668 | 0.8333335 | 0.6276883 | 0.1666668 | 0.8333335 | 0.6277357 |
| Se | 0.3363908 | 0.6697242 | 0.3723117 | 0.3363672 | 0.6695759 | 0.3721029 |
| Ti | 0.5000000 | 0.0077212 | 0.0000000 | 0.5000000 | 0.0077862 | -0.0000000 |
| Se | 0.6636093 | 0.3302759 | 0.1276883 | 0.6636328 | 0.3304242 | 0.1278971 |
| Se | 0.8333333 | 0.1666666 | -0.1276883 | 0.8333333 | 0.1666666 | -0.1277357 |
| Ti | 0.5000000 | -0.0077212 | 0.5000000 | 0.5000000 | -0.0077862 | 0.5000000 |
| Se | 0.6697239 | 0.3363905 | 0.6276883 | 0.6695756 | 0.3363670 | 0.6278971 |
| Se | 0.8333333 | 0.1666666 | 0.3723117 | 0.8333333 | 0.1666666 | 0.3722643 |
| Ti | 0.4999999 | 0.4999998 | 0.0000000 | 0.4999999 | 0.4999998 | 0.0000000 |
| Se | 0.6697240 | 0.8333335 | 0.1276883 | 0.6695757 | 0.8332087 | 0.1278971 |
| Se | 0.8333335 | 0.6697242 | -0.1276883 | 0.8332086 | 0.6695759 | -0.1278971 |
| Ti | 0.4999999 | 0.4999998 | 0.5000000 | 0.4999999 | 0.4999998 | 0.5000000 |
| Se | 0.6636095 | 0.8333335 | 0.6276883 | 0.6636329 | 0.8332087 | 0.6278971 |
| Se | 0.8333335 | 0.6636096 | 0.3723117 | 0.8332087 | 0.6636331 | 0.3721029 |
| Ti | -0.0074786 | -0.0074786 | 0.0000000 | -0.0075626 | -0.0075626 | 0.0000000 |
|---|---|---|---|---|---|---|
| Se | 0.1666666 | 0.3362550 | 0.1275200 | 0.1667657 | 0.3362053 | 0.1276938 |
| Se | 0.3362551 | 0.1666666 | -0.1275200 | 0.3362055 | 0.1667657 | -0.1276938 |
| Ti | 0.0074786 | 0.0074786 | 0.5000000 | 0.0075626 | 0.0075626 | 0.5000000 |
| Se | 0.1666666 | 0.3304114 | 0.6275200 | 0.1667657 | 0.3305602 | 0.6276938 |
| Se | 0.3304115 | 0.1666666 | 0.3724800 | 0.3305604 | 0.1667657 | 0.3723062 |
| Ti | 0.0074785 | 0.4999998 | 0.0000000 | 0.0075625 | 0.4999998 | 0.0000000 |
| Se | 0.1666668 | 0.8333335 | 0.1275200 | 0.1666668 | 0.8333335 | 0.1275652 |
| Se | 0.3304116 | 0.6637451 | -0.1275200 | 0.3305605 | 0.6637948 | -0.1276937 |
| Ti | -0.0074787 | 0.4999998 | 0.5000000 | -0.0075627 | 0.4999998 | 0.5000000 |
| Se | 0.1666668 | 0.8333335 | 0.6275200 | 0.1666668 | 0.8333335 | 0.6275652 |
| Se | 0.3362553 | 0.6695888 | 0.3724800 | 0.3362056 | 0.6694399 | 0.3723063 |
| Ti | 0.5000000 | 0.0074786 | 0.0000000 | 0.5000000 | 0.0075626 | -0.0000000 |
| Se | 0.6637448 | 0.3304114 | 0.1275200 | 0.6637945 | 0.3305602 | 0.1276937 |
| Se | 0.8333333 | 0.1666666 | -0.1275200 | 0.8333333 | 0.1666666 | -0.1275652 |
| Ti | 0.5000000 | -0.0074786 | 0.5000000 | 0.5000000 | -0.0075626 | 0.5000000 |
| Se | 0.6695884 | 0.3362550 | 0.6275200 | 0.6694396 | 0.3362053 | 0.6276937 |
| Se | 0.8333333 | 0.1666666 | 0.3724800 | 0.8333333 | 0.1666666 | 0.3724348 |
| Ti | 0.4999999 | 0.4999998 | 0.0000000 | 0.4999999 | 0.4999998 | 0.0000000 |
| Se | 0.6695886 | 0.8333335 | 0.1275200 | 0.6694397 | 0.8332344 | 0.1276938 |
| Se | 0.8333335 | 0.6695888 | -0.1275200 | 0.8332343 | 0.6694399 | -0.1276938 |
| Ti | 0.4999999 | 0.4999998 | 0.5000000 | 0.4999999 | 0.4999998 | 0.5000000 |
| Se | 0.6637449 | 0.8333335 | 0.6275200 | 0.6637946 | 0.8332344 | 0.6276938 |
| Se | 0.8333335 | 0.6637451 | 0.3724800 | 0.8332343 | 0.6637948 | 0.3723062 |
| Ti | -0.0105614 | -0.0105614 | 0.0000000 | -0.0113010 | -0.0113010 | -0.0000000 |
|---|---|---|---|---|---|---|
| Se | 0.1666666 | 0.3376787 | 0.1152080 | 0.1672981 | 0.3376220 | 0.1155628 |
| Se | 0.3376788 | 0.1666666 | -0.1152080 | 0.3376221 | 0.1672982 | -0.1155628 |
| Ti | 0.0105614 | 0.0105614 | 0.5000001 | 0.0113010 | 0.0113010 | 0.5000001 |
| Se | 0.1666666 | 0.3289877 | 0.6152078 | 0.1672982 | 0.3296759 | 0.6155626 |
| Se | 0.3289877 | 0.1666666 | 0.3847921 | 0.3296759 | 0.1672982 | 0.3844373 |
| Ti | 0.0105614 | 0.4999998 | 0.0000000 | 0.0113009 | 0.4999999 | -0.0000000 |
| Se | 0.1666666 | 0.8333331 | 0.1152080 | 0.1666665 | 0.8333331 | 0.1147726 |
| Se | 0.3289877 | 0.6623209 | -0.1152080 | 0.3296759 | 0.6623776 | -0.1155628 |
| Ti | -0.0105615 | 0.4999998 | 0.5000001 | -0.0113010 | 0.4999997 | 0.5000001 |
| Se | 0.1666666 | 0.8333331 | 0.6152078 | 0.1666665 | 0.8333331 | 0.6147724 |
| Se | 0.3376787 | 0.6710120 | 0.3847921 | 0.3376221 | 0.6703237 | 0.3844373 |
| Ti | 0.4999999 | 0.0105614 | 0.0000000 | 0.5000000 | 0.0113009 | 0.0000000 |
| Se | 0.6623210 | 0.3289877 | 0.1152080 | 0.6623777 | 0.3296759 | 0.1155628 |
| Se | 0.8333332 | 0.1666666 | -0.1152080 | 0.8333333 | 0.1666665 | -0.1147726 |
| Ti | 0.4999999 | -0.0105614 | 0.5000001 | 0.4999998 | -0.0113009 | 0.5000001 |
| Se | 0.6710121 | 0.3376787 | 0.6152078 | 0.6703238 | 0.3376221 | 0.6155626 |
| Se | 0.8333332 | 0.1666666 | 0.3847921 | 0.8333333 | 0.1666665 | 0.3852275 |
| Ti | 0.4999999 | 0.4999998 | 0.0000000 | 0.4999998 | 0.4999998 | -0.0000000 |
| Se | 0.6710120 | 0.8333331 | 0.1152080 | 0.6703239 | 0.8327015 | 0.1155628 |
| Se | 0.8333331 | 0.6710120 | -0.1152080 | 0.8327016 | 0.6703238 | -0.1155628 |
| Ti | 0.4999999 | 0.4999998 | 0.5000001 | 0.4999999 | 0.4999999 | 0.5000001 |
| Se | 0.6623210 | 0.8333331 | 0.6152078 | 0.6623777 | 0.8327015 | 0.6155626 |
| Se | 0.8333332 | 0.6623209 | 0.3847921 | 0.8327016 | 0.6623776 | 0.3844373 |
| Ti | -0.0080061 | -0.0080061 | 0.0000000 | -0.0081278 | -0.0081278 | 0.0000000 |
|---|---|---|---|---|---|---|
| Se | 0.1666667 | 0.3365859 | 0.1259154 | 0.1668046 | 0.3365521 | 0.1260378 |
| Se | 0.3365859 | 0.1666665 | -0.1259154 | 0.3365520 | 0.1668043 | -0.1260378 |
| Ti | 0.0080061 | 0.0080061 | 0.4999999 | 0.0081277 | 0.0081277 | 0.4999999 |
| Se | 0.1666668 | 0.3300811 | 0.6259155 | 0.1668046 | 0.3302527 | 0.6260379 |
| Se | 0.3300810 | 0.1666665 | 0.3740845 | 0.3302527 | 0.1668043 | 0.3739622 |
| Ti | 0.0080059 | 0.5000000 | 0.0000000 | 0.0081277 | 0.5000000 | -0.0000000 |
| Se | 0.1666665 | 0.8333335 | 0.1259154 | 0.1666666 | 0.8333334 | 0.1258447 |
| Se | 0.3300808 | 0.6634140 | -0.1259154 | 0.3302523 | 0.6634478 | -0.1260378 |
| Ti | -0.0080063 | 0.5000000 | 0.4999999 | -0.0081281 | 0.4999999 | 0.4999999 |
| Se | 0.1666665 | 0.8333335 | 0.6259155 | 0.1666666 | 0.8333335 | 0.6258448 |
| Se | 0.3365856 | 0.6699188 | 0.3740845 | 0.3365518 | 0.6697473 | 0.3739622 |
| Ti | 0.4999999 | 0.0080061 | 0.0000000 | 0.4999999 | 0.0081280 | 0.0000000 |
| Se | 0.6634142 | 0.3300811 | 0.1259154 | 0.6634480 | 0.3302526 | 0.1260378 |
| Se | 0.8333333 | 0.1666665 | -0.1259154 | 0.8333333 | 0.1666665 | -0.1258447 |
| Ti | 0.4999999 | -0.0080061 | 0.4999999 | 0.4999998 | -0.0081279 | 0.4999999 |
| Se | 0.6699191 | 0.3365859 | 0.6259155 | 0.6697475 | 0.3365521 | 0.6260379 |
| Se | 0.8333333 | 0.1666665 | 0.3740845 | 0.8333333 | 0.1666666 | 0.3741553 |
| Ti | 0.5000002 | 0.5000000 | 0.0000000 | 0.5000002 | 0.5000000 | 0.0000000 |
| Se | 0.6699194 | 0.8333335 | 0.1259154 | 0.6697477 | 0.8331956 | 0.1260378 |
| Se | 0.8333331 | 0.6699188 | -0.1259154 | 0.8331952 | 0.6697472 | -0.1260378 |
| Ti | 0.5000002 | 0.5000000 | 0.4999999 | 0.5000000 | 0.4999998 | 0.4999999 |
| Se | 0.6634145 | 0.8333335 | 0.6259155 | 0.6634484 | 0.8331957 | 0.6260379 |
| Se | 0.8333331 | 0.6634140 | 0.3740845 | 0.8331953 | 0.6634479 | 0.3739622 |