Avalanches, Plasticity, and Ordering in Colloidal Crystals Under Compression
Danielle McDermott,1,2 Cynthia J. Olson Reichhardt,∗1 and Charles Reichhardt1
Received Xth XXXXXXXXXX 20XX, Accepted Xth XXXXXXXXX 20XX
First published on the web Xth XXXXXXXXXX 200X
DOI: 10.1039/b000000x
Using numerical simulations we examine colloids with a long-range Coulomb interaction confined in a two-dimensional trough potential undergoing dynamical compression. As the depth of the confining well is increased, the colloids move via elastic distortions interspersed with intermittent bursts or avalanches of plastic motion. In these avalanches, the colloids rearrange to minimize their colloid-colloid repulsive interaction energy by adopting an average lattice constant that is isotropic despite the anisotropic nature of the compression. The avalanches take the form of shear banding events that decrease or increase the structural order of the system. At larger compressions, the avalanches are associated with a reduction of the number of rows of colloids that fit within the confining potential, and between avalanches the colloids can exhibit partially crystalline or even smectic ordering. The colloid velocity distributions during the avalanches have a non-Gaussian form with power law tails and exponents that are consistent with those found for the velocity distributions of gliding dislocations. We observe similar behavior when we subsequently decompress the system, and find a partially hysteretic response reflecting the irreversibility of the plastic events.
1 Introduction
††footnotetext: 1 Theoretical Division, Los Alamos National Laboratory, Los Alamos, New Mexico 87545, USA. Fax: 1 505 606 0917; Tel: 1 505 665 1134; E-mail: cjrx@lanl.gov††footnotetext: 2 Department of Physics, Wabash College, Crawfordsville, Indiana 46556, USA.Collectively interacting colloidal particles are often used as model systems to investigate various features of equilibrium and non-equilibrium phenomena 1. Due to their size scale, colloids provide the advantage that microscopic information on the individual particle level can be directly accessed, something which is normally difficult or impossible in smaller scale systems such as nanoparticles, molecules, or atoms 2, 3. Additionally, there are various methods such as optical techniques 4, 5 for controlling colloidal ordering and manipulating individual colloids. Examples of phenomena that have been studied with colloids include two-dimensional melting transitions 6, 7, solid-to-solid phase transitions 8, glassy dynamics 3, commensurate and incommensurate phases 9, 10, 11, 12, depinning behaviors 13, 14, 15, 16, self-assembly 17, 18, and dynamic sorting 19, 20, 21. It is also possible to use colloids to study plastic deformation under shear in crystalline 22 or amorphous 23 colloidal assemblies. In crystalline materials, plastic deformations occur via the motion of dislocations which often occur in bursts of activity or avalanches 24, 25, 26, 27, 28. Certain studies that may be difficult to undertake in other systems become feasible to perform with colloidal systems, such as observations of changes in the particle configurations and dynamics during compression. Due to the relative softness of charge-stabilized colloidal assemblies, compressional studies can be performed in this system over a wide range of parameters and packing densities. In recent experiments, Varshney et al. 29 demonstrated that it is possible to create a quasi-two-dimensional colloidal raft system confined between two barriers, and to then compress or decompress the raft in order to dynamically change the packing density. In these experiments the colloid-colloid interaction was more complex than a simple repulsion, so that transitions from a loose-packed amorphous solid to a much denser but still amorphous solid were observed; however, during the compression, various plastic rearrangements occurred that produced hysteresis across the compression and decompression cycle 29.
Several studies have addressed order-disorder transitions of repulsive colloids confined between two parallel walls, where the transitions are associated with changes in the number of rows of colloids that fit between the walls. Crystalline states arise for integer numbers of rows, while disordered states occur when partial rows, or a non-integer number of rows, are present 30, 31. It should be possible to create a two-dimensional (2D) system of repulsively interacting colloids that tend to form a triangular lattice, confine the system by barriers or an anisotropic trapping potential that can be dynamically changed to compress the colloidal assembly in one direction, and observe how the configuration changes under compression as the colloids rearrange in order to minimize the repulsive colloid-colloid interactions. For example, in numerical studies of confined charged particles in anisotropic traps, the particle configuration changes as a function of the trap width 32, 33, 34. In experiments on ion trapping systems where the ions are confined in a quasi-one-dimensional potential with a tunable strength, structural changes in the ion configuration were observed as the assembly was compressed and decompressed, such as a transition from a single row of ions to a zig-zag or kink state 35, 36. It should also be possible to create dynamical confining potentials or barriers for dusty plasma crystals 37.
In this work we numerically study a 2D system of colloids with long-range Coulomb repulsive interactions placed in a quasi-one-dimensional confining potential such that as the depth of the potential is increased, the colloidal assembly is compressed in one direction. Since the colloids can minimize their interaction energy by adopting a triangular ordering with equal lattice spacing in all directions, the colloids adjust their positions to make the local lattice structure as isotropic as possible during compression. Colloidal motion occurs both through slow elastic distortions and via abrupt avalanches in which plastic rearrangements occur. During the avalanche events, the average distance between nearest neighbor colloids increases. Dislocations can be created or annihilated at the sample surface during the plastic events, causing the colloids to move along shear bands. For high compressions, we find that avalanches are associated with reductions of the number of rows of colloids that fit in the confining potential. Between the row reduction events, the colloids can adopt partial crystalline or smectic order. We also find that the colloid velocity distribution during the avalanche events is non-Gaussian with a power-law tail, and that the exponents are consistent with those observed for velocity distributions in 2D dislocation systems 32, 38, 39. Under decompression, we observe a similar set of dynamics and find some hysteresis between the compression and decompression cycles; however, there are no large-scale hysteretic effects since the particle-particle interactions are purely repulsive.
2 Simulation and System
We consider a two-dimensional assembly of colloidal particles interacting repulsively via a long-range Coulomb potential. We employ periodic boundary conditions in both the and -directions for a system of size . The sample contains colloids and a single trough potential which produces a force . As is increased, the particles are forced closer together in the -direction. The dynamics of a single colloid are obtained by integrating the following overdamped equation of motion:
| (1) |
Here is the damping constant, is the position of particle , , and the particle-particle interaction potential is , where , is the dimensionless interaction strength, is the effective charge of the colloid, and is the solvent dielectric constant. We treat the long-range image interactions using a real-space Lekner summation method 40. Lengths are measured in units of , time in units of , and forces in units of . We increase in small increments of over the range to 10 in the first part of the work, and in increments of from to 100 in the second part of the work. During each increment we measure the average transient force response on each particle in the two directions and , along with the changes in the particle-particle interaction energy , the total energy of the system , local ordering , where is the coordination number of particle obtained from a Voronoi tesselation, and , where is the spacing between particle and its nearest neighbor as identified from a Voronoi tesselation.
3 Compression
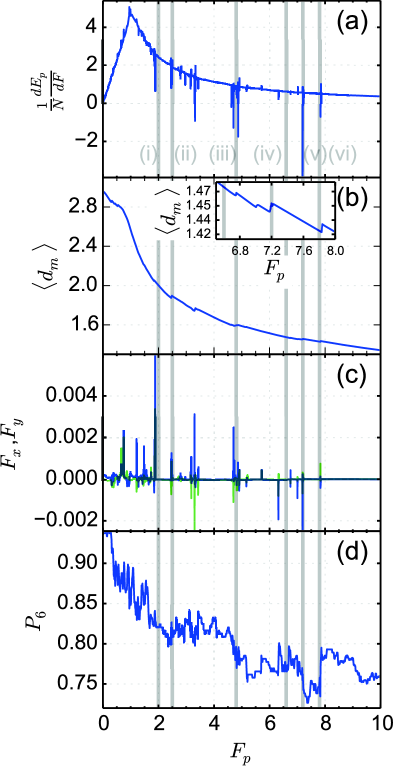
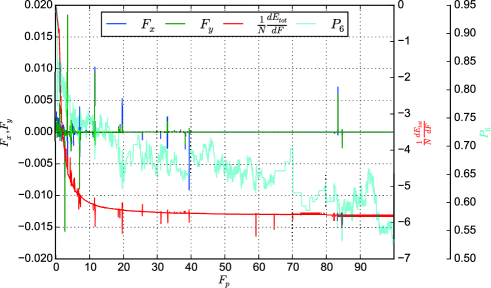
In Fig. 1(a) we plot the change in the energy of the particle configuration versus . Figure 1(b) shows the corresponding , the average spacing between nearest-neighbor particles, Fig. 1(c) shows the cumulative transient forces and , and Fig. 1(d) shows the fraction of six-fold coordinated particles . In Fig. 2 we plot the particle positions and trajectories over intervals of which correspond to the gray shaded bands in Fig. 1. We find two distinct types of behaviors. Elastic distortions occur in the smoothly changing portions of and , in the same regions where and are close to zero. Sudden plastic events or avalanches are associated with peaks in , jumps in , and spikes in and . The particle configuration energy increases with increasing as the repulsively interacting colloids are forced together, which accounts for the overall positive value of . The cusp in near appears when becomes large enough that the particles can no longer spread to cover the entire sample but instead segregate into the bottom of the potential, with a particle-free region appearing at the potential maximum that becomes wider with increasing .
The spikes in generally have negative values, indicating that they are associated with drops in the configuration energy. The plastic events are also associated with an increase in the average spacing between nearest-neighbor particles, as indicated in Fig. 1(a,b) where negative spikes in correlate with positive jumps in . The inset in Fig. 1(b) shows a blowup of the plastic events near to better highlight the discrete nature of the jumps in . Since the colloid-colloid interactions are repulsive, the configurational energy increases under compression as the particles elastically approach each other along the compressed direction, while during the plastic avalanches, the closest spacing between particles increases so that the configurational energy is reduced. In Fig. 1(c) the peaks in coincide with peaks in , indicating that the particle motion is occurring almost equally in both the and directions during an avalanche. Fig. 1(d) shows that initially at where the system forms a slightly distorted ordered triangular lattice. As increases, there are numerous very small peaks in caused by the Voronoi construction having difficulties with the sample edges; however, there are several real larger scale jumps in that are correlated with the avalanche events. The increases and decreases in occur when dislocations, which have fivefold or sevenfold rather than sixfold coordination, are created or annihilated during an avalanche.
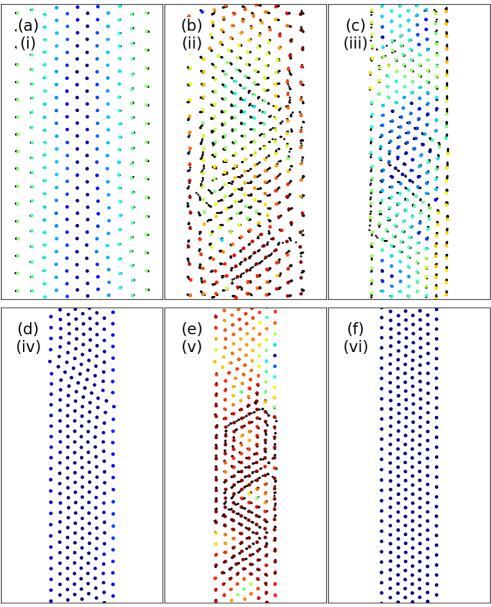
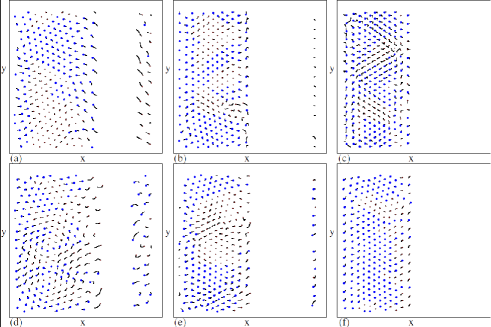
In the avalanche illustrations of Fig. 2, red particles move significantly during the compression increment while blue particles experience little to no motion. Figure 2(a) shows the state near for an interval in which there are no spikes or jumps in the quantities plotted in Fig. 1, indicating that the particles are undergoing elastic motion. Here the particles are arranged in twelve vertical rows. The avalanche near is shown in Fig. 2(b) where the particles transition from twelve to eleven vertical rows. Here, motion occurs in localized bands, indicative of a shear banding effect. These bands generally form zig-zag patterns, and there are also regions undergoing local rotation. Figure 2(c) illustrates another avalanche interval near , where similar shear banding motion appears. In this case, there is considerable motion of the particles on the outer edges of the sample and the particles transition from ten to nine vertical rows. Figure 2(d) shows another elastic region near where there is little motion. Near , a large plastic event occurs as illustrated by the bands of motion in Fig. 2(e) as the system transitions from nine to eight rows. For , the system behaves elastically, as shown in Fig. 2(f) for where little motion occurs. Further compression of the system beyond is described in Section 4.
3.1 Velocity Distributions
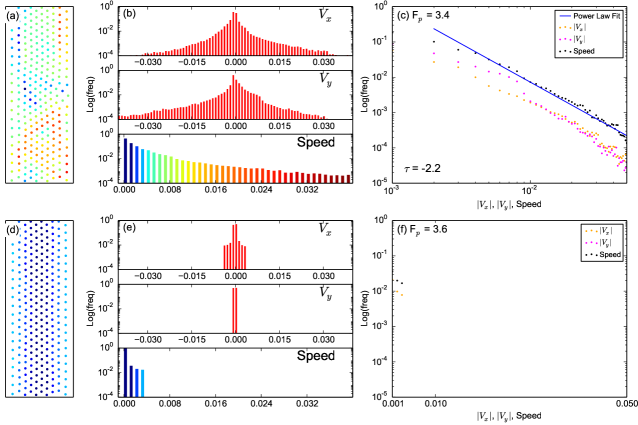
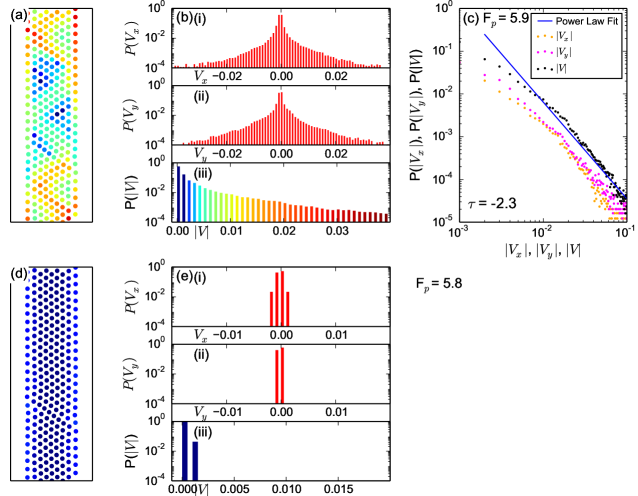
We next examine histograms of the particle velocities at different values of . Figure 3(a) shows the particle positions for , where the color denotes the average speed of each particle, highlighting the heterogeneous displacements of particles in bands. In Fig. 3(b) we plot , , and for the same force interval. The distributions are obtained by averaging the velocities of each particle over ten subintervals of . The plastic motion that occurs during the avalanche event produces non-Gaussian velocity distributions, as shown more clearly in Fig. 3(c) where we plot , , and on a log-log scale. The solid line is a power law fit of , where . In Fig. 3(d,e,f) we show the same quantities for which corresponds to an interval in which the response is elastic, as indicated in Fig. 3(d). The width of the velocity distributions in Fig. 3(e) is significantly smaller than for the plastic flow event illustrated in Fig. 3(b). Due to the sharpness of the distributions, the plot of on a log-log scale in Fig. 3(f) cannot be fit to a power law. In Fig. 3(g,h,i) we show the same quantities for , corresponding to an interval containing an avalanche as highlighted in Fig. 1. Here the motion follows a banding pattern. The velocity distributions have strongly non-Gaussian features, as shown in Fig. 3(g,h). A fit of in Fig. 3(i) gives . For there are few plastic rearrangements and the velocity distributions are very similar to those shown in Fig. 3(e,f) for the case. In general, we find that during the avalanches, the velocity distributions of the particles have a non-Gaussian form with a power law tail that can be fit with , while in the elastic regimes, the width of the velocity distributions is strongly reduced.
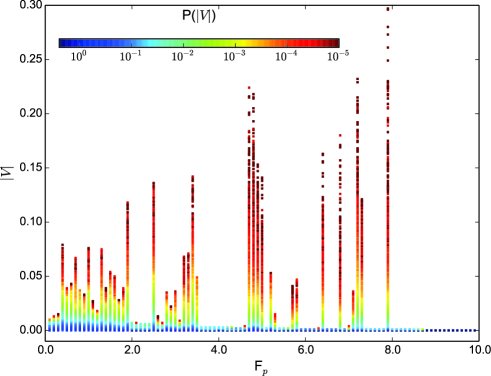
Previous studies of sheared crystalline materials showed that avalanches are associated with the motion of dislocations 24, 25, 26, 27, 28, 32, 38, 39, and that various quantities such as the dislocation velocities are power-law distributed in the avalanche regime. We consider the particle velocities instead of the dislocation velocities in our system; however, due to the partial crystalline order of our sample, avalanches are generally associated with the motion of dislocations. In the dislocation dynamics studies, the high velocity tails of the velocity distributions can be fit with power law exponents of 32 and 38. Recent computational and theoretical work showed that in 2D, a single dislocation has a power-law distributed velocity with , while when collective effects are important, larger exponents of appear 39. In our case, as dislocations move through the system, individual particles temporarily translate along with the dislocations, so that over sufficiently short time windows the overall form of the velocity distributions of the particles and the dislocations should be similar. It is difficult to extract the exact exponents for our system due to the finite width of the sample and the fact that some avalanches are associated with only one moving dislocation while others contain multiple moving and interacting dislocations. The width of the distribution is also dependent on the packing fraction. As the particle density increases, the maximum possible particle velocity also increases. This is shown in Fig. 4 where we plot a color height map of versus for intervals of , highlighting the maximum extent of the high-velocity tails of the distributions. As increases, the particle packing density increases and the maximum achievable particle velocity also increases significantly.
4 Row Reduction Transitions
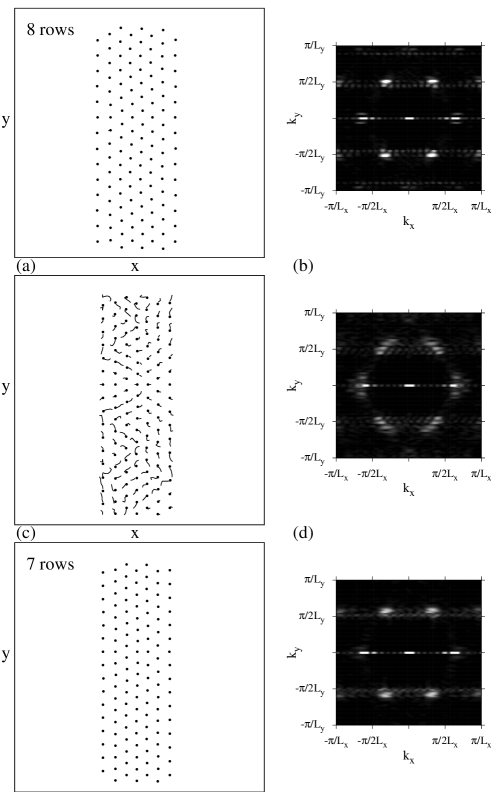
In Fig. 5 we plot simultaneously , , the derivative of the total energy , and versus as the sample is compressed all the way to . The density of avalanche-induced peaks is much smaller for than for , while the avalanche jumps at higher values clearly coincide with sharp changes in . In general, plastic avalanche events that occur for are associated with a partial or complete reduction of the number of rows of particles that fit across the potential well. In Fig. 6(a) we show the particle positions in a portion of the sample at , with the corresponding structure factor plotted in Fig. 6(b). Here, eight rows of particles fit across the potential well and the system has significant triangular ordering as indicated by the six-fold peaks in . Figure 6(e,f) shows the real space particle positions and at , where there are only seven rows of particles that still have mostly triangular ordering. Figure 5 shows that between and a plastic avalanche event occurs, as indicated by the spikes in , , and . We illustrate the correlated bands of particle motion that occur during the event in Fig. 6(c). Figure 6(d) shows that during the avalanche, the sixfold peaks in are heavily smeared, indicating the disordering of the structure as dislocations move through the system. We observe similar signatures for avalanches at higher . In some cases, the number of rows is not reduced uniformly through the entire system in a single avalanche; instead, a portion of the system collapses to the smaller number of rows in one avalanche event, followed by a second avalanche event at a slightly higher value of that completes the row reduction process.

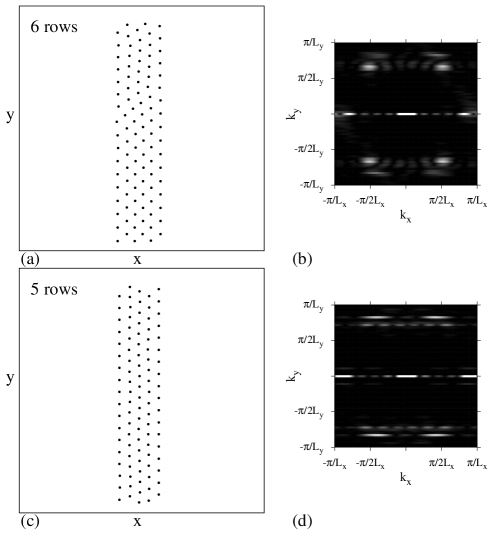
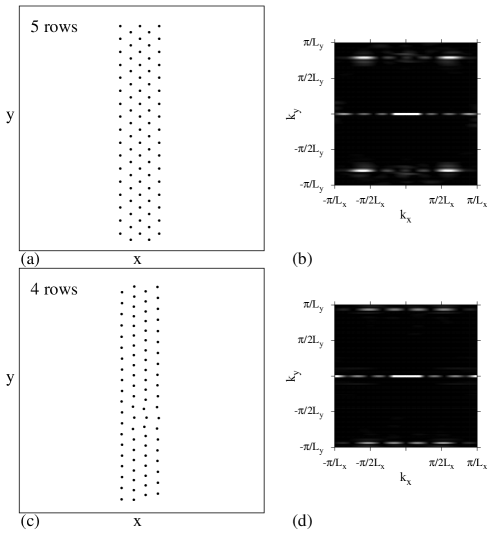
In Fig. 7(a,b) we show the real space and plots for a sample at where there are six rows of particles. Here there are patches in the system where the triangular ordering has been distorted into a rhomboidal ordering, as seen by the nonuniform spacing between the peaks in . Figure 5 shows that an avalanche occurs near . After the avalanche, at , the real space plot in Fig. 7(c) has only five rows of particles, indicating that the avalanche was associated with a row reduction. The structure in Fig. 7(c) has a smectic characteristic as indicated by the one-dimensional smearing of the peaks along the direction in the plot in Fig. 7(d). For , the system retains five rows of particles; however, there are still avalanche events associated with the system shifting between different partially crystalline structures that still contain five rows. For example, Fig. 8(a) shows a rhomboidal ordering of the five rows of particles at , and Fig. 8(b) shows the corresponding . In the range , several avalanche events occur that are associated with a transition from five to four rows of particles. In Fig. 8(c,d) we show the particle positions and at , where there are four rows of particles in a smectic arrangement.
5 Decompression and Hysteresis
To explore hysteretic effects, once the system is fully compressed to we gradually decompress the sample by decrementing back to zero, using the same sweep rate for as during the original compression. We find that, just as during compression, under decompression the system undergoes combinations of slow elastic distortions interspersed with sudden avalanche rearrangement events. In Fig. 9(a,b) we plot and versus for the compression and decompression cycles in a sample where the maximum compression value is . Figure 9(a) shows that the curves for compression and decompression overlap completely above , while in Fig. 9(b) there are no avalanche events in this same force interval, indicating that the system is behaving reversibly. Avalanche events are completely suppressed during the decompression until has decreased to , where the first large peak in appears in Fig. 9(b) accompanied by a large dip in in Fig. 9(a). During this event, a number of dislocations enter the system and the average spacing between the colloids increases. In general we observe fewer plastic events during the decompression cycle than during compression; however, the plastic events that do occur during decompression tend to be larger. Two large plastic decompression events appear at and , marked by spikes in and substantial drops in . We find no systematic trend in the hysteresis such as or always being higher for one direction of the compression cycle. Instead, the plastic avalanches occur at different values of for each driving direction, indicating the irreversibility associated with the plasticity in this system. The lack of systematic hysteresis is different from the behavior observed for compression-decompression cycles in colloidal raft experiments 29. In those experiments, the particle-particle interactions had both repulsive and attractive components, so that during the initial compression the particles could be captured by the attractive portion of the interparticle potential. In contrast, in our system all of the particle-particle interactions are smoothly repulsive.
Figure 9(c) shows , an element of the stress tensor:
| (2) |
plotted versus for both compression and decompression. Here is the interparticle force between particles and and is their relative separation. There is no significant difference between the compression and decompression values of over the range , but we find significant hysteresis for . For , the signal is noisy under both compression and decompression. At very low , the particles are spread out across the entire sample, with no gap. At , a particle-free gap opens at the location of the potential maximum, and the particles form rows that are rotated by a finite angle from the direction, as shown in Fig. 11(a,f). This diagonal ordering reduces the energy of the system by minimizing the compression of the lattice, but when this small energy advantage is lost and the particles transition as illustrated in Fig. 11 into a vertical row structure of the type shown in Fig. 11(c) that is aligned with the direction of the confining potential. For , remains hysteretic but is no longer noisy; instead, the curve is smooth with distinct jumps, indicating the hysteresis in the value of at which the number of rows in the sample is reduced during compression or increased during expansion. The row transitions are marked by labeled arrows in Fig. 9(c), where we observe an average offset of between the reduction in the number of rows from to upon compression and the increase in the number of rows from to upon decompression, with the transition during compression falling at a higher value of . For example, the 11-10 transition during compression occurs at while the 10-11 transition during decompression occurs at .
During decompression, the particle velocity distributions in the elastic regimes and during avalanches have the same features described above for compression. Figure 10(a,b,c) shows the particle configuration, velocity distributions, and log-scale plot of , , and during the decompression cycle over the range . The velocity distributions are clearly non-Gaussian, and the power-law fit of in Fig. 10(c) has an exponent of . Figure 10(d,e,f) shows the same quantities over the range where elastic motion occurs. Here the velocity distributions are much sharper.
6 Summary
We have numerically investigated a monodisperse assembly of repulsively interacting Yukawa colloids undergoing dynamical compression in a trough potential. During the compression the motion is predominately elastic as the particles gradually move closer together. This elastic motion is interspersed with occasional sudden plastic rearrangements or avalanches in which the colloids shift position in order to increase the average spacing between neighboring particles. The avalanches take the form of local shear banding events in which dislocations can be created or annihilated. During the plastic events, the colloidal velocity distributions are non-Gaussian with power law tails that have exponents ranging from to This is consistent with the velocity distributions found for moving dislocations during avalanche events. For larger compressions, the avalanches are generally associated with row reduction events where the number of rows of colloids that fit inside the trough is partially or completely reduced by one. After these avalanche events, the colloids can exhibit partial crystalline or smectic type structures. During decompression, we observe similar avalanche behaviors; however, the avalanche events do not occur at the same values of substrate strength, indicating the occurrence of irreversible behavior. This system could be experimentally realized by confining colloids or other charged particles such as dusty plasmas in anisotropic traps where the barriers or the trap width can be changed dynamically.
7 Acknowledgements
This work was carried out under the auspices of the NNSA of the U.S. DoE at LANL under Contract No. DE-AC52-06NA25396.
References
- 1 C.A. Murray and D.G. Grier, Am. Sci., 1995, 83, 238.
- 2 J. Crocker and D.G. Grier, J. Colloid Interface Sci., 1996, 179, 298.
- 3 E.R. Weeks, J.C. Crocker, A.C. Levitt, A. Schofield, and D.A. Weitz, Science, 2000, 287, 627.
- 4 D.G. Grier, Nature, 2003, 424, 810.
- 5 R.P.A. Dullens and C. Bechinger, Phys. Rev. Lett., 2011, 107, 138301.
- 6 K. Zahn, R. Lenke, and G. Maret, Phys. Rev. Lett., 1999, 82, 2721.
- 7 S. Deutschländer, A. M. Puertas, G. Maret, and P. Keim, Phys. Rev. Lett., 2014, 113, 127801.
- 8 J.A. Weiss, D.W. Oxtoby, D.G. Grier, and C.A. Murray, J. Chem. Phys., 1995, 103, 1180.
- 9 C. Bechinger, M. Brunner, and P. Leiderer, Phys. Rev. Lett., 2001, 86, 930.
- 10 C. Reichhardt and C.J. Olson, Phys. Rev. Lett., 2002, 88, 248301.
- 11 M. Brunner and C. Bechinger, Phys. Rev. Lett., 2002, 88, 248302.
- 12 P. Tierno, Soft Matter, 2012, 8, 11443.
- 13 T. Bohlein, J. Mikhael, and C. Bechinger, Nature Mater., 2011, 11, 126.
- 14 J. Hasnain, S. Jungblut, and C. Dellago, Soft Matter, 2013, 9, 5867.
- 15 A. Vanossi, N. Manini, and E. Tosatti, Proc. Natl. Acad. Sci. (USA), 2012, 109, 16429.
- 16 D. McDermott, J. Amelang, C.J. Olson Reichhardt, and C. Reichhardt, Phys. Rev. E, 2013, 88, 062301.
- 17 Q. Chen, S.C. Bae, and S. Granick, Nature, 2011, 469, 381.
- 18 S.C. Glotzer and M.J. Solomon, Nature Mater., 2007, 6, 557.
- 19 P.T. Korda, M.B. Taylor, and D.G. Grier, Phys. Rev. Lett., 2002, 89, 128301.
- 20 M.A. Tahir, L. Gao, L.N. Virgin, and B.B. Yellen, Phys. Rev. E, 2011, 84, 011403.
- 21 M. Balvin, E. Sohn, T. Iracki, G. Drazer, and J. Frechette, Phys. Rev. Lett., 2009, 103, 078301.
- 22 P. Schall, I. Cohen, D.A. Weitz, and F. Spaepen, Science, 2004, 305, 1944.
- 23 P. Schall, D.A. Weitz, and F. Spaepen, Science, 2007, 1895, 21.
- 24 M.C. Miguel, A. Vespignani, S. Zapperi, J. Weiss, and J.R. Grasso, Nature (London), 2001, 410, 667.
- 25 M. Zaiser, Adv. Phys., 2006, 55, 185.
- 26 F.F. Csikor, C. Motz, D. Weygand, M. Zaiser, and S. Zapperi, Science, 2007, 318, 251.
- 27 P. Moretti, B. Cerruti, and M.-C. Miguel, PLOS One, 2011, 6, e20418.
- 28 E.K.H. Salje and K.A. Dahmen, Ann. Rev. Condens. Matter Phys., 2014, 5, 233.
- 29 A. Varshney, A. Sane, S. Ghosh, and S. Bhattacharya, Phys. Rev. E, 2012, 86, 031402.
- 30 R. Haghgooie and P. Doyle, Phys. Rev. E, 2005, 72, 011405.
- 31 K.-A. Liu and L. I, Phys. Rev. E, 2010, 82, 041504.
- 32 O. Rancova, E. Anisimovas, and T. Varanavicius, Phys. Rev. E, 2011, 83, 036409.
- 33 L.G. D’yachkov, M.I. Myasnikov, O.F. Petrov, T.W. Hyde, J. Kong, and L. Matthews, Phys. Plasmas, 2014, 21, 093702.
- 34 W. Ferreira, J. Carvalho, P. Oliveira, G. Farias, and F. Peeters, Phys. Rev. B, 2008, 77, 014112.
- 35 K. Pyka et al., Nature Commun., 2013, 4, 2291.
- 36 S. Ulm et al., Nature Commun., 2013, 4, 2290.
- 37 G. Morfill and A. Ivlev, Rev. Mod. Phys., 2009, 81, 1353.
- 38 P. Ispanovity, I. Groma, G. Györgyi, F. Csikor, and D. Weygand, Phys. Rev. Lett., 2010, 105, 085503.
- 39 F. Jafarpour, L. Angheluta, and N. Goldenfeld, Phys. Rev. E, 2013, 88, 042123.
- 40 J. Lekner, Physica A 176, 485 (1991); N. Grønbech-Jensen, G. Hummer, and K.M. Beardmore, Mol. Phys. 92, 941 (1997).