Antiferromagnetic order and spin dynamics in iron-based superconductors
Abstract
High-transition temperature (high-) superconductivity in the iron pnictides/chalcogenides emerges from the suppression of the static antiferromagnetic order in their parent compounds, similar to copper oxides superconductors. This raises a fundamental question concerning the role of magnetism in the superconductivity of these materials. Neutron scattering, a powerful probe to study the magnetic order and spin dynamics, plays an essential role in determining the relationship between magnetism and superconductivity in high- superconductors. The rapid development of modern neutron time-of-flight spectrometers allows a direct determination of the spin dynamical properties of iron-based superconductors throughout the entire Brillouin zone. In this review, we present an overview of the neutron scattering results on iron-based superconductors, focusing on the evolution of spin excitation spectra as a function of electron/hole-doping and isoelectronic substitution. We compare spin dynamical properties of iron-based superconductors with those of copper oxide and heavy fermion superconductors, and discuss the common features of spin excitations in these three families of unconventional superconductors and their relationship with superconductivity.
pacs:
74.70.Xa, 75.25.-j, 78.70.NxI Introduction
The interplay between magnetism and superconductivity has a long history. For example, it is well known that superconductivity in conventional Bardeen-Cooper-Schrieffer (BCS) superconductors Bardeen et al. (1957) such as the element lanthanum can be suppressed by as little as 1% gadolinium substitution as the magnetic impurity Mathias et al. (1958). Within the BCS framework, magnetic impurities can act as pairing breaking agents rapidly suppressing superconductivity Balatsky et al. (2006). In the case of unconventional superconductors such as heavy fermions Steglich et al. (1979); Stewart (2001); Gegenwart et al. (2008), copper oxides Bednorz and Müller (1986); Lee et al. (2006), and iron pnictides/chalcogenides Kamihara et al. (2006, 2008); Hsu et al. (2008); Canfield and Bud’ko (2010); Paglione and Greene (2010); Johnston (2010); Stewart (2011); Wen et al. (2011), the observation that superconductivity always appears near the static antiferromagnetic (AF) order Uemura (2009) suggests that magnetism may be a common thread for understanding the microscopic origin of unconventional superconductors and high-transition temperature (high-) superconductivity Scalapino (2012). Based on this premise, much work has focused on studying the interplay between magnetism and superconductivity, particularly the high- copper oxide superconductors (cuprates) since its discovery in 1986 Kastner et al. (1998); Kivelson et al. (2003); Armitage et al. (2010); Fujita et al. (2012); Tranquada et al. (2014). Although understanding the magnetism and its relationship with superconductivity in cuprates is still an area of active research Fujita et al. (2012); Tranquada et al. (2014), the discovery of AF order in the parent compounds of iron-based superconductors in 2008 de la Cruz et al. (2008); Huang et al. (2008a); Zhao et al. (2008b) provided a new opportunity to study the interplay between magnetism and superconductivity. There are already several review articles summarizing the general progress in the field of iron-based superconductors Canfield and Bud’ko (2010); Paglione and Greene (2010); Johnston (2010); Stewart (2011); Wen et al. (2011); Mazin (2010); Hirschfeld et al. (2011); Chubukov (2012); Wang and Lee (2011); Dagotto (2013). The interplay between magnetism and superconductivity studied by neutron scattering has been briefly discussed as well Lumsden and Christianson (2010); Dai et al. (2012).
The purpose of this review article is to present a comprehensive account of the AF order, spin excitations, and their relationship with superconductivity in iron pnictides and chalcogenides. Since magnetism is generally believed to play an important role in the electron pairing mechanism of high- superconductivity Scalapino (2012), it is important to summarize the progress in the field over the past several years and compare the outcome with previous work on high- copper oxides and heavy fermion superconductors. Neutrons–with their wavelengths comparable to the atomic spacing and their spins directly probing the unpaired electrons in solids–have played a unique role in determining the magnetic properties of high- superconductors. Soon after the discovery of iron pnictide superconductor LaFeAsO1-xFx with K Kamihara et al. (2008), neutron and X-ray scattering experiments have discovered that its parent compound LaFeAsO exhibits a tetragonal-to-orthorhombic structural distortion followed by a collinear AF order de la Cruz et al. (2008); Nomura et al. (2008). Since the presence of a collinear AF structure in LaFeAsO was predicted earlier in the band structure calculations as due to a spin-density-wave order arising from nesting of the hole and electron Fermi surfaces Dong et al. (2008), its confirmation by neutron scattering and the semi-metallic nature of these materials Kamihara et al. (2008) provided strong evidence for the itinerant origin of the magnetism in the iron based superconductors Mazin (2010); Hirschfeld et al. (2011). This is fundamentally different from the parent compounds of copper oxide superconductors, which are Mott insulators because the Coulomb repulsive energy cost of having two electrons (or holes) on the same site is much larger than the electron hopping energy Lee et al. (2006). For a Mott insulator, the static AF order arises from a saving in energy of via virtual hopping and is due to electron correlation effects. Since the Mott insulating state of copper oxides is believed to play an essential role in the pseudogap physics and mechanism of high- superconductivity Lee et al. (2006), it is interesting to ask whether iron-based superconductors are also close to a Mott insulator and determine the effect of electron correlations and local moments to their electronic properties and spin dynamics Si and Abrahams (2008); Fang et al. (2008); Xu et al. (2008); Haule et al. (2008); Qazilbash et al. (2009).
From the experimental point of view, a systematic determination of the magnetic structures and the doping evolution of spin excitations in different classes of iron-based superconductors and their associated materials will form the basis to establish whether magnetism is responsible for high- superconductivity. For copper oxides, superconductivity can be induced by charge carrier doping (electrons or holes) into the CuO2, resulting complicated phase diagrams with many incipient states competing with superconductivity Kastner et al. (1998); Kivelson et al. (2003); Armitage et al. (2010); Fujita et al. (2012); Tranquada et al. (2014). The undoped copper oxides such as La2CuO4 Vaknin et al. (1987) and YBa2Cu3O6+x Tranquada et al. (1988) are simple antiferromagnets with the neighboring spins oppositely aligned. When holes are doped into the parent compounds, the static AF order is gradually suppressed, but spin excitations (or short-range spin fluctuations) survive across the entire superconducting dome and couple with superconductivity via a collective magnetic excitation termed neutron spin resonance Fujita et al. (2012); Tranquada et al. (2014); Eschrig (2006). However, inelastic neutron scattering experiments designed to study the doping evolution of spin excitations were only carried out on the La2-xSrxCuO4 family of cuprates across the entire phase diagram from the undoped parent compounds to heavily overdoped non-superconducting samples Wakimoto et al. (2007); Lipscombe et al. (2007). There are no comprehensive measurements throughout the entire phase diagram on other cuprates due to material limitations (for example, YBa2Cu3O6+x cannot be hole overdoped to completely suppress superconductivity) or the difficulty in growing large single crystals suitable for inelastic neutron scattering experiments.
In the case of iron-based superconductors, there are two major classes of materials, the iron pnictides and iron chalcogenides Johnston (2010); Stewart (2011). Compared with the hole-doped La2-xSrxCuO4 copper oxide superconductors, where superconductivity can only be induced via substituting the trivalent La by the divalent element Ba or Sr, superconductivity in iron pnictide such as BaFe2As2 Rotter et al. (2008b) can be induced by ionic substitution at any element site. These include Ba by K/Na to form hole-doped Ba1-xKxFe2As2 Rotter et al. (2008a); Pramanik et al. (2011), Fe by Co or Ni to have electron-doped BaFeAs2 (Co, Ni) Sefat et al. (2008); Li et al. (2009a), and As by P in the isovalent (or isoelectronic) doped compounds BaFe2As2-xPx Jiang et al. (2009). While K or Na doping to BaFe2As2 induces the same numbers of holes to the FeAs layer, the effect of Ni-doping is expected to introduce twice the number of electrons into the FeAs layer as that of Co-doping from naive electron counting point of view Johnston (2010); Stewart (2011). Since large sized single crystals can be grown by self-flux method in many of these cases Canfield and Bud’ko (2010), doped BaFe2As2 materials provide a unique opportunity to study the evolution of the static AF order and spin excitations as a function of hole, electron, and isovalent doping throughout the entire AF order to superconductivity phase diagram, and determine their connection with superconductivity. These experiments, together with neutron scattering studies of related materials Ishikado et al. (2009); Shamoto et al. (2010); Wakimoto et al. (2010); Singh et al. (2009); Johnston et al. (2011); Simonson et al. (2012); Lamsal et al. (2013); Kim et al. (2011); Marty et al. (2011); Inosov et al. (2013); Taylor et al. (2013), will establish the common features in the magnetic order and spin excitations in different families of iron-based superconductors. The outcome, together with the results from high- copper oxide and heavy fermion superconductors, and can form a basis to determine if magnetism is indeed responsible for superconductivity in these materials Scalapino (2012).
Compared with other techniques suitable to study magnetism in solids including Muon spin rotation (SR) Uemura (2009), nuclear magnetic resonance (NMR) Alloul et al. (2009), and resonant inelastic X-ray scattering (RIXS) Ament et al. (2011), neutron scattering has several unique advantages: (1) The neutron itself is a charge 0 fermion with a spin , resulting a magnetic dipole moment which can interact with unpaired electrons and magnetism in solids; (2) The charge neutrality of the neutron renders it a weakly interacting probe with well-known scattering cross sections; (3) The available wavelength and energies of neutrons as a scattering probe are ideally suited to study static magnetic order and spin excitations in solids. The general scattering principle involved is simply to measure the number of neutrons scattered into a given solid angle at a known energy (, where is the reduced Planck’s constant and is the angular frequency) and momentum transfer (). The laws of conservation of momentum and energy are satisfied via and , where , , , and are the incident neutron wave vector, energy, outgoing neutron wave vector, and energy, respectively, and is the mass of a neutron. The coherent magnetic scattering cross section from a system with a single species of magnetic atoms is then Xu et al. (2013a),
Here is the number of unit cells, (where cm, is the electron spin -factor, and is the magnetic form factor), is the Debye-Waller factor, are the Cartesian coordinates , , and , and , are the projections of the unit wave vector onto the Cartesian axes. is the dynamic spin correlation function, and is associated with the imaginary part of the dynamic susceptibility via the fluctuation-dissipation theorem:
For a paramagnet with isotropic spin excitations, . Since neutron scattering is only sensitive to spin (fluctuations) direction perpendicular to the wave-vector transfer , the of an isotropic paramagnet measured by unpolarized neutron scattering experiments (see Section III. F for neutron polarization analysis) is related to via . By measuring in absolute units via phonon or vanadium normalization Xu et al. (2013a), one can estimate the energy dependence of the -averaged or the local dynamic susceptibility within a Brillouin Zone (BZ) Lester et al. (2010). The overall strength of the magnetic excitations, corresponding to the local fluctuating moment , can then be computed via Lester et al. (2010)
One of the central purposes of inelastic neutron scattering experiments is to determine the energy and wave vector dependence of in absolute units for various iron pnictides, and compare the outcome with those in copper oxide and heavy fermion superconductors.
In this article, we present a comprehensive review of recent neutron scattering results on iron-based superconductors, mainly focusing on the evolution of the static AF order and spin dynamics of iron pnictides and chalcogenides. In Section II, we summarize the static AF order for various iron pnictides/chalcogenides and its doping evolution. This includes the effects of electron and hole-doping on the static AF order and tetragonal-to-orthorhombic structural transitions (Section II. A.); how impurity (Section II. B.) and isoelectronic substitution (Section II. C.) affect the magnetic and structural phase transitions. Section III summarizes spin excitations and their relationship with superconductivity, including spin waves in the parent compounds of iron-based superconductors (Section III. A.); as well as neutron spin resonance and its relationship with superconductivity (Section III. B.); the electron and hole-doping evolution of the spin excitations in the BaFe2As2 family of iron pnictides (Section III. C.); evolution of spin excitations in iron chalcogenides and alkali iron selenides (Section III. D.); impurity effects on spin excitations of iron pnictide and chalcogenide superconductors (Section III. E.); neutron polarization analysis of spin excitation anisotropy in iron pnictides (Section III. F.); electronic nematic phase and neutron scattering experiments under uniaxial strain (Section III. G.); comparison with SR, NMR, and RIXS measurements (Section III. H.); and comparison of spin excitations in iron-based superconductors with those in copper oxide and heavy fermion superconductors (Section III. I.). Section IV provides a brief account of current theoretical understanding of spin excitations in iron-based superconductors. Finally, we summarize the results and discuss possible future directions for the field.
II Static antiferromagnetic order and its doping evolution
II.1 Lattice and magnetic order in the parent compounds of iron-based superconductors
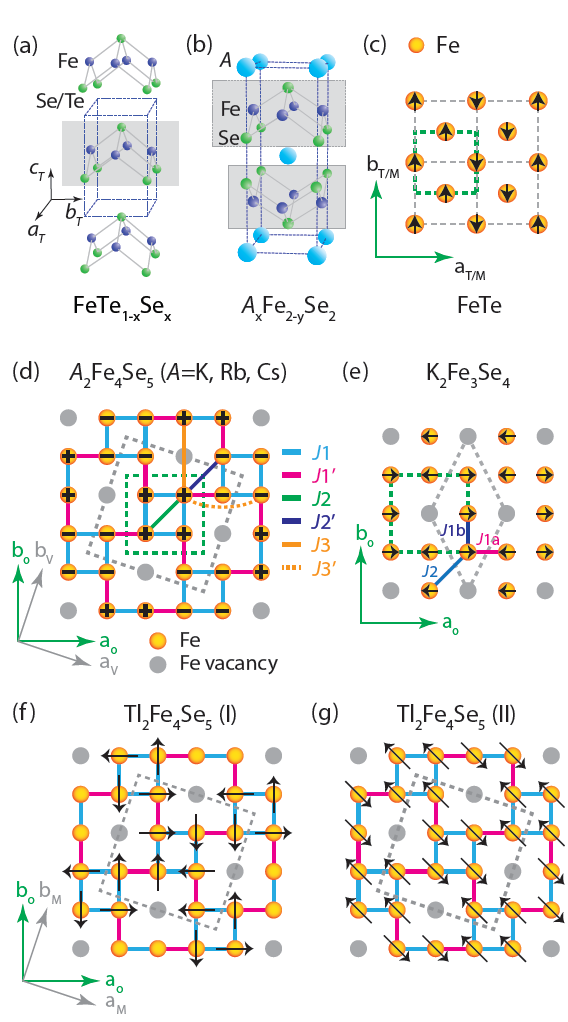
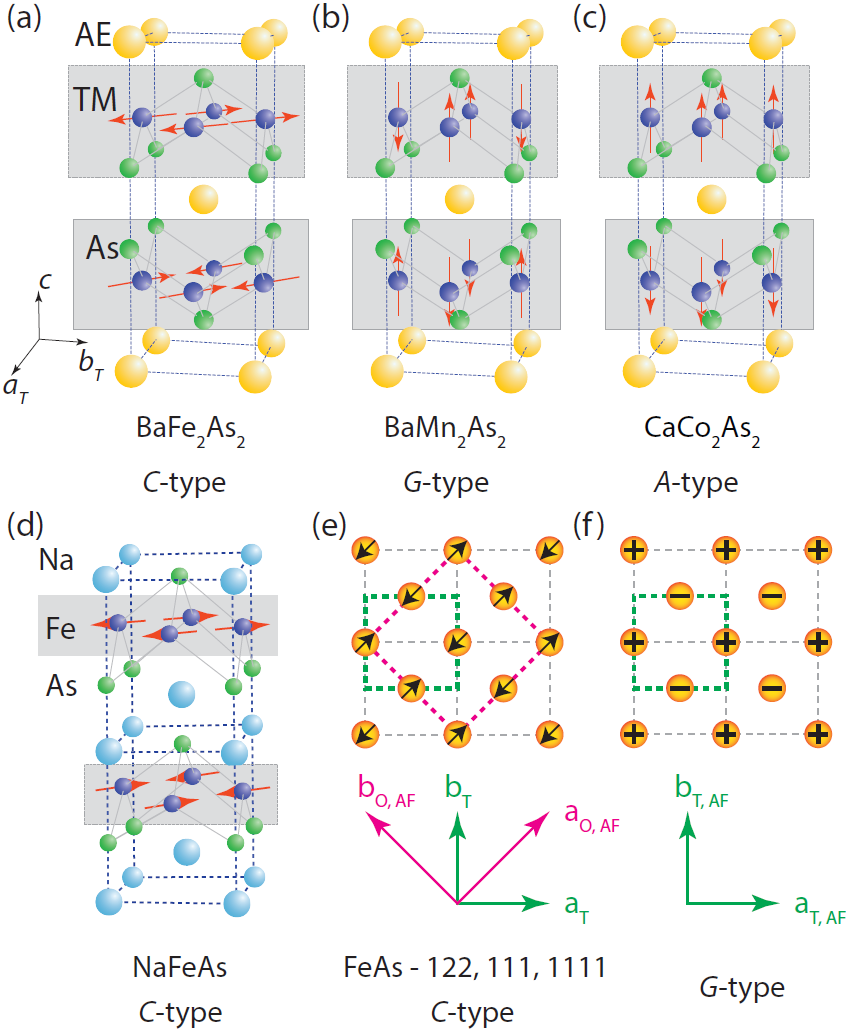
From a crystal structure point of view, the parent compounds of iron-based superconductors can be classified into five different families: FeAsO ( La, Ce, Pr, Nd, Sm,…, the 1111 system), Fe2As2 ( Ba, Sr, Ca, K, the 122 system), FeAs ( Li, Na, the 111 system), Fe1+yTe1-xSex (the 11 system), and Fe2-ySe2 alkali iron selenides ( K, Rb, Cs, Tl, …, including the insulating 245 phase Fe4Se5 and the semiconducting 234 phase Fe3Se4) Paglione and Greene (2010); Johnston (2010); Stewart (2011); Sadovskii (2008); Aswathy et al. (2010); Dagotto (2013); Zhao et al. (2012); Wang et al. (2014), where the 122 and 245 compounds have two FeAs(Se) layers in the unit cell and other systems have single FeAs(Se) layer. A recent development in the field is the synthesis of iron selenide superconductors via intercalation of molecular complexes between layers of FeSe Ying et al. (2012); Burrard-Lucas et al. (2013); Krzton-Maziopa et al. (2012). The crystal structures at room temperature are all tetragonal except for the insulating 245 phase and some of them will become orthorhombic at low temperature below . Neutron diffraction measurements have established that the long range AF order in the iron pnictides including the 1111, 122, 111 families is collinear with moment aligned along the axis direction of the orthorhombic structure [Figs. 1(a), 1(d), and 1(e)] Lynn and Dai (2009), except for the stoichiometric LiFeAs system which is superconducting without a magnetically ordered parent compound Tapp et al. (2008); Wang et al. (2008); Pitcher et al. (2008). Although the in-plane collinear AF structures for different classes of iron pnictides are identical [Fig. 1(e)], the ordering along the axis is material dependent. In the 122 system, which has two magnetic irons per formula unit, the ordering is AF within a unit cell along the axis [Fig. 1(a)]. For the 111 system with one iron per unit cell, the magnetic structure doubles the chemical unit cell along the axis [Fig. 1(d)]. While the collinear AF structure in iron pnictide is the so-called -type antiferromagnet stemming from the original work of Wollan and Koehler on perovskite manganese oxides Wollan and Koehler (1955), the related pnictide materials such as BaMn2As2 Singh et al. (2009) and CaCo2As2 Quirinale et al. (2013) have the - [Figs. 1(b), 1(f)] and -type [Fig. 1(c)] AF structures, respectively. Recently, another AF parent compound was found in electron-overdoped LaFeAsO1-xHx () system in addition to the usual collinear AF structure at Hiraishi et al. (2014).
| Materials | (Å) | (Å) | (K) | (K) | Moment/Fe () |
|---|---|---|---|---|---|
| LaFeAsO 111de la Cruz et al. (2008); McGuire et al. (2008); Huang et al. (2008b); Qureshi et al. (2010). | 4.0301 | 8.7368 | 155 | 137 | 0.36-0.6 |
| CeFeAsO 222Zhao et al. (2008b); Zhang et al. (2013d). | 3.9959 | 8.6522 | 158 | 140 | 0.8 |
| PrFeAsO 333Zhao et al. (2008c); Kimber et al. (2008). | 3.997 | 8.6057 | 153 | 127 | 0.48 |
| NdFeAsO 444Chen et al. (2008); Qiu et al. (2008). | 3.9611 | 8.5724 | 150 | 141 | 0.25 |
| LaFeAsO0.5H0.5 555Hiraishi et al. (2014). | 3.975 | 8.67 | 95 | 92 | 1.21 |
| CaFe2As2 666Goldman et al. (2008); Kreyssig et al. (2008); Goldman et al. (2009). | 3.912 | 11.667 | 173 | 173 | 0.80 |
| SrFe2As2 777Zhao et al. (2008d); Kaneko et al. (2008); Jesche et al. (2008). | 3.920 | 12.40 | 220 | 220 | 0.94 |
| BaFe2As2 888Huang et al. (2008a); Kim et al. (2011). | 3.957 | 12.968 | 140 | 140 | 0.87 |
| Na0.985FeAs 999Li et al. (2009c). | 3.9448 | 6.9968 | 49 | 39 | 0.09 |
| Fe1.068Te 101010Bao et al. (2009); Li et al. (2009d). | 3.8123 | 6.2517 | 67 | 67 | 2.25 |
| K2Fe4Se5 111111Bao et al. (2011). | 8.7306 | 14.113 | 578 | 559 | 3.31 |
| Rb2Fe4Se5 121212Ye et al. (2011); Wang et al. (2011b). | 8.788 | 14.597 | 515 | 502 | 3.3 |
| Cs2Fe4Se5 131313Ye et al. (2011). | 8.865 | 15.289 | 500 | 471 | 3.4 |
| TlFe1.6Se2 141414May et al. (2012). | 8.71 | 14.02 | 463 | 100 | 3 |
For the iron chalcogenides (the 11 family) and alkali iron selenides, their crystal structures are shown in Figs. 2(a) and 2(b), respectively. Instead of a collinear AF structure, the parent compound of the 11 family has a bi-collinear AF spin structure as shown in Fig. 2(c) Fruchart et al. (1975); Bao et al. (2009); Li et al. (2009d). Compared to the collinear spin structure of the 122 family in Fig. 1(e), the iron spins are rotated 45∘ within the -plane in the 11 system. The magnetic structure in the 11 family is sensitive to the excess iron population in the interstitial iron site Rodriguez et al. (2010, 2011). While the bi-collinear magnetic order is commensurate for Fe1+xTe with , it exhibits incommensurate helical magnetic order that competes with the bi-collinear commensurate ordering close to for Rodriguez et al. (2010, 2011, 2013). The alkali iron selenides (the 245 family) Guo et al. (2010); Fang et al. (2011) have two different iron vacancy structures including the insulating iron vacancy ordered phase [Figs. 2(d), 2(f), and 2(g)] Bao et al. (2011); Ye et al. (2011); Wang et al. (2011b) and the semiconducting rhombus iron vacancy ordered 234 phase [Fig. 2(e)] Zhao et al. (2012); Wang et al. (2014). While the 234 phase has a AF structure similar to the parent compounds of the 122 family [Fig. 2(e)] Zhao et al. (2012), the insulating 245 phase have the block AF structure with moments along the axis [Fig. 2(d)] Bao et al. (2011); Ye et al. (2011); Wang et al. (2011b) and in the plane [Figs. 2(f) and 2(g)] May et al. (2012), respectively. Compared with the parent compounds of the 122 system, the ordered moments of the 11 and 245 systems are much larger. In Table I, we summarize the lattice parameters, structure transition temperature , the AF phase transition temperature , and the static ordered moments for the parent compounds of different iron-based superconductors. In the 1111, 111, and 245 systems, the structural transition occurs at a temperature higher than that of the AF phase transition Johnston (2010); Stewart (2011). In the 122 system, the structural and magnetic transitions almost occur simultaneously in the undoped parent compounds Kim et al. (2011), but are well separated upon electron-doping Canfield and Bud’ko (2010).
II.2 The effect of electron, hole-doping, impurity, and isoelectronic substitution on the static AF order and tetragonal-to-orthorhombic structural transitions
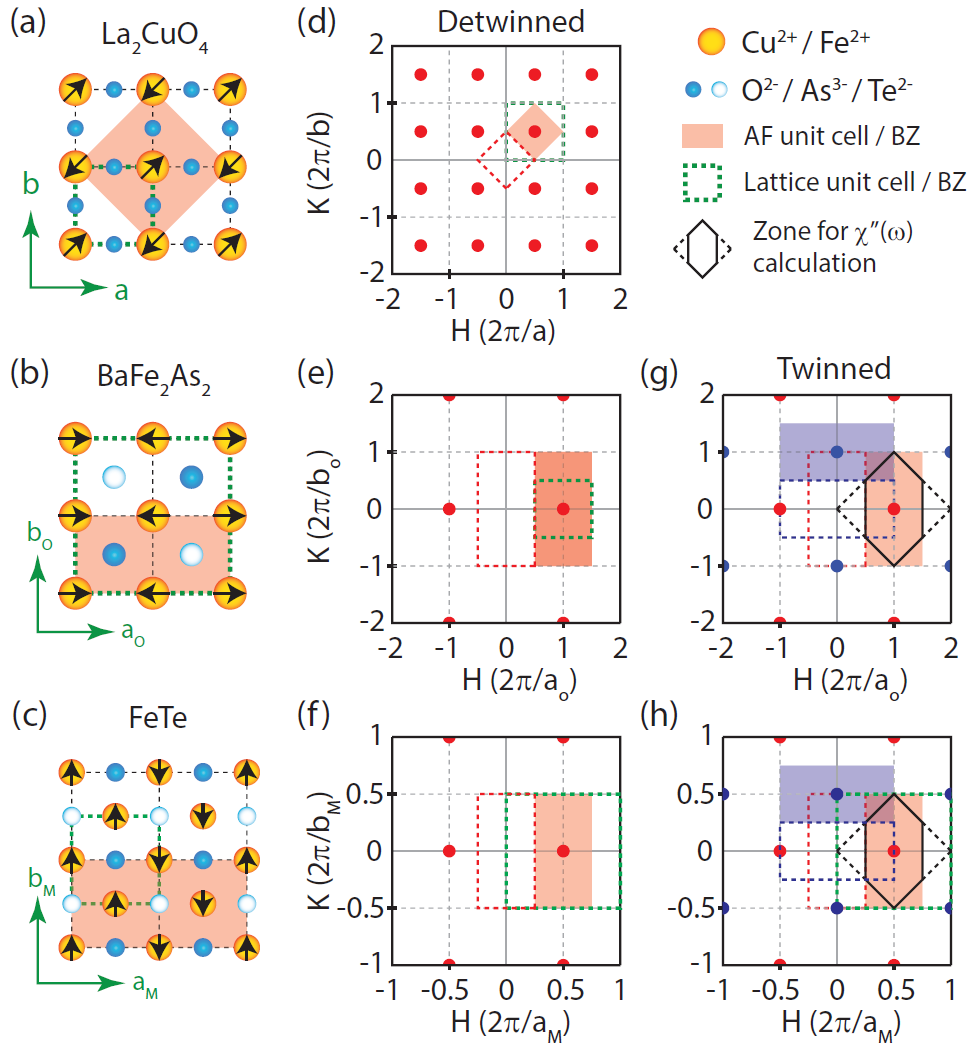
Before discussing the impact of electron/hole doping on the long range AF order, we shall define momentum transfer in reciprocal space and compare the sizes of the Brillouin zones for the parent compounds of different families of high- superconductors. Figures 3(a), 3(b), and 3(c) show spin arrangements within one layer of La2CuO4 Vaknin et al. (1987), BaFe2As2 Huang et al. (2008a), and FeTe Fruchart et al. (1975); Bao et al. (2009); Li et al. (2009d), respectively. The chemical unit cells are marked as green dashed lines and the magnetic unit cells are magenta shaded. The positions of Cu2+/Fe2+ and O2-/As3-/Te2- are also marked. The momentum transfer at (, , ) in Å-1 can be defined as in reciprocal lattice units (r.l.u.), where (or ), (or ), and are lattice parameters of the orthorhombic unit cell. In this notation, the AF order in the parent compound of copper oxide superconductors occurs at where and the first magnetic Brillouin zone is shown as the magenta shaded box in Fig. 3(d). Another equivalent Brillouin zone near is marked by the magenta dashed line, while the first Brillouin zone of the chemical unit cell is the green dashed box. If the ordered moment is entirely on the iron site in BaFe2As2, the chemical unit cell is twice the size of the magnetic unit cell along the axis direction due to out of plane positions of the As atoms [Fig. 3(b)]. In a completely detwinned sample, the first magnetic Brillouin zone is the magenta shaded area around where r.l.u., larger in size than the chemical Brillouin zone in dashed green. Because the AF order in iron pnictides is always preceded by a tetragonal-to-orthorhombic lattice distortion, the twinning effect in the orthorhombic state means that AF Bragg peaks from the twinned domains appear at positions rotated by 90∘ [Blue dots in Fig. 3(g)]. Therefore, to properly account for the twin domain effect, one needs to carry out wave vector integration within the region marked by solid black lines in Fig. 3(g) to obtain the local dynamic susceptibility . Figure 3(c), 3(f), and 3(h) summarizes the bi-collinear spin structure of FeTe, its associated magnetic Bragg peaks in reciprocal in detwinned, and twinned samples, respectively. Depending on the size of the unit cell, the same AF Bragg peak for collinear AF order in BaFe2As2 and and bi-collinear AF order in FeTe can appear with different Miller indices. For example, if we choose unit cells of BaFe2As2 with one [half the magenta shaded area in Fig. 3(b) and ignoring As], two [similar to magenta shaded area in Fig. 3(a)], and four irons [doubling the magenta shaded area in Fig. 3(b) along the -axis], the same AF Bragg peak would occur at in-plane wave vectors , , and , respectively. For the bi-collinear AF order FeTe, one iron and two irons per unit cell would have the same AF Bragg peak at the in-plane wave vectors and , respectively.
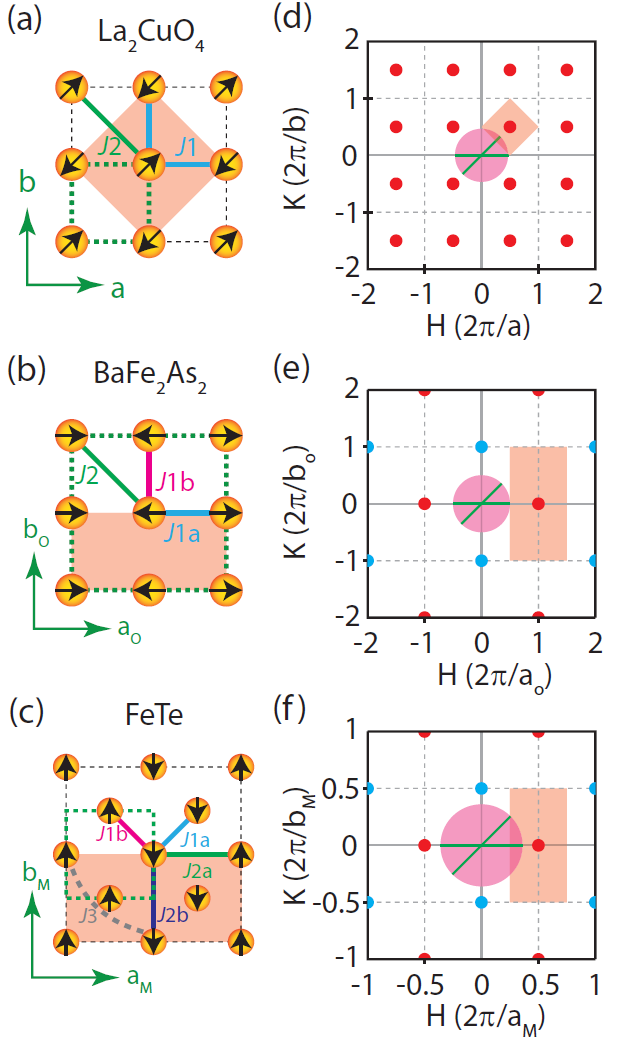
Figure 4(a), 4(b), and 4(c) summarizes the effective nearest neighbor and next nearest neighbor magnetic exchange couplings for La2CuO4, BaFe2As2, and FeTe, respectively. Figure 4(d), 4(e), and 4(f) shows the corresponding reciprocal space with positions marked as red and blue dots for the two different twin domains. While neutron scattering typically studies the magenta region of the reciprocal space within the first Brillouin zone near , RIXS can only probe spin excitations within the purple circles near the origin due to kinematic constraints from energies of the incident and outgoing photons used to enhance the magnetic scattering at Cu -edge and Fe -edge Tacon et al. (2011); Zhou et al. (2013a).
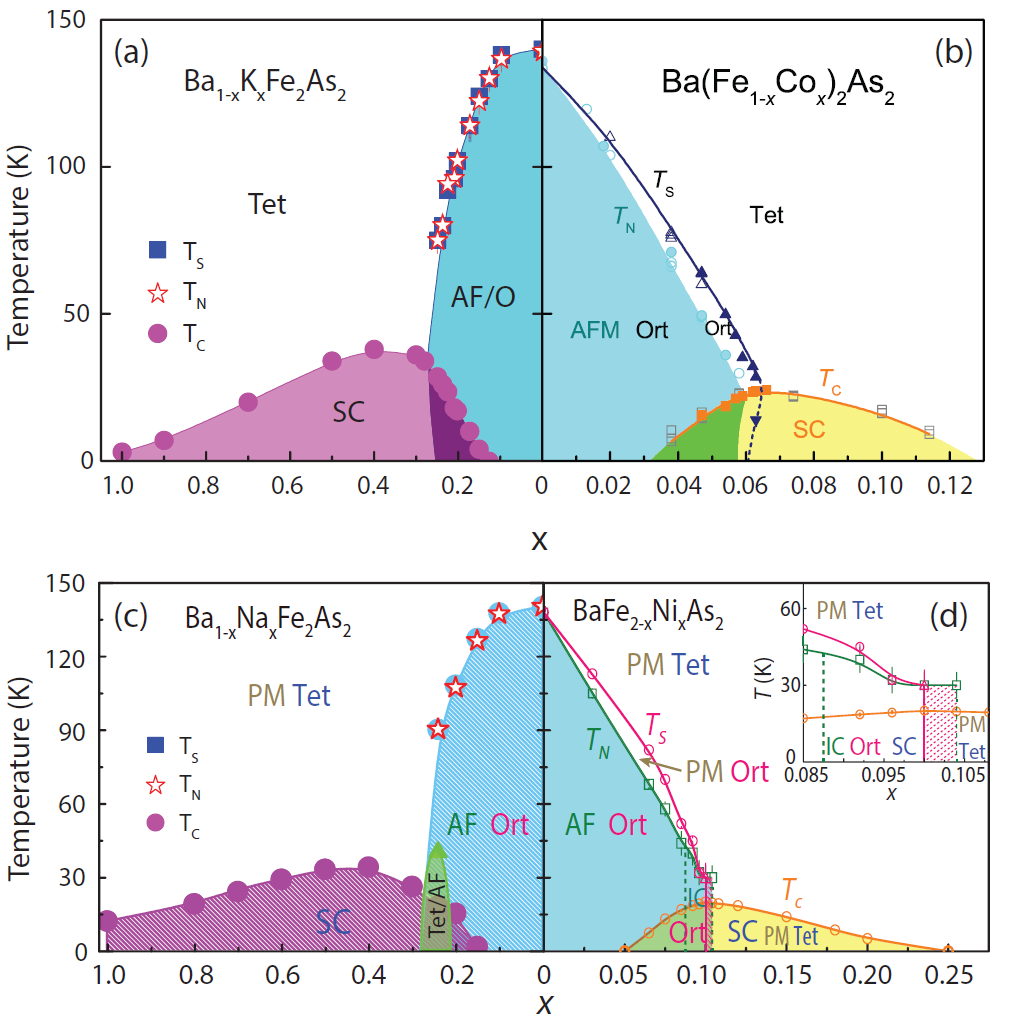
Although the field of iron-based superconductors started with the discovery of the 1111 family of materials Kamihara et al. (2008), majority of recent neutron scattering work has been focused on the 122 family due to the availability of high quality single crystals Canfield and Bud’ko (2010). In the undoped state, the prototypical 122 such as BaFe2As2 exhibits tetragonal-to-orthorhombic lattice distortion and AF order below K Huang et al. (2008a). Figure 5 summarizes evolution of the structural and magnetic phase transitions for the electron and hole doped BaFe2As2. From transport, neutron diffraction, and X-ray diffraction measurements Canfield and Bud’ko (2010); Chu et al. (2009); Lester et al. (2009); Pratt et al. (2009); Christianson et al. (2009); Nandi et al. (2010), the phase diagram of electron-doped Ba(Fe1-xCox)2As2 as shown in Fig. 5(b) has been established. Upon electron-doping via Co substitution for Fe to suppress the static AF order and induce superconductivity, the structural and AF phase transitions are gradually separated with the structural transition occurring at higher temperatures than the magnetic one. The collinear static AF order coexists and competes with superconductivity in the underdoped regime marked as green shaded area in Fig. 5(b) Pratt et al. (2009); Christianson et al. (2009). For electron-doping levels near optimal superconductivity, the orthorhombic lattice distortion initially increases with decreasing temperature below , but then decreases dramatically below . For BaFe1.874Co0.126As2, the orthorhombic structure evolves smoothly back to a tetragonal structure below and the system is believed to enter into a “reentrant” tetragonal phase as shown in Fig. 5(b) Nandi et al. (2010). Subsequent neutron diffraction experiments revealed that the static AF order in the underdoped regime changes from commensurate to transversely incommensurate for Ba(Fe1-xCox)2As2 with Pratt et al. (2011). These results have been hailed as direct evidence for spin-density-wave order in iron pinctides Pratt et al. (2011), where the static AF order arises from Fermi surface nesting between the hole and electron pockets at the and points of the reciprocal space, respectively Dong et al. (2008); Vorontsov et al. (2009); Fink et al. (2009).
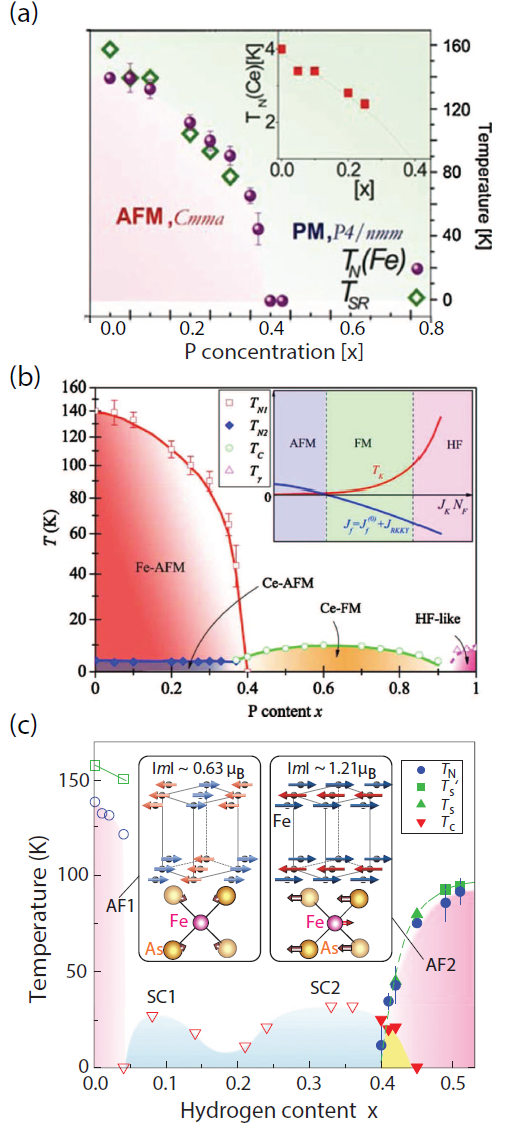
Figure 5(d) shows the phase diagram of electron-doped BaFe2-xNixAs2 obtained from X-ray and neutron scattering experiments Luo et al. (2012b); Lu et al. (2013). Here, the AF order decreases with increasing Ni-doping and disappears near optimal superconductivity in a first order like fashion with an avoided quantum critical point Lu et al. (2013). Similar to Ba(Fe1-xCox)2As2 with Pratt et al. (2011), there is short-range (60 Å) incommensurate AF order for samples near optimal superconductivity Luo et al. (2012b). Although these results indicate an avoided quantum critical point in BaFe2-xNixAs2, they are in direct conflict with a recent NMR work suggesting the presence of two quantum critical points Zhou et al. (2013b). However, these NMR results are inconsistent with systematic NMR and neutron scattering results on nearly optimally Co and Ni-doped BaFe2As2 samples revealing a cluster spin glass state for the magnetic order Dioguardi et al. (2013); Lu et al. (2014b). The spin glass picture of the magnetic order near optimal superconductivity in electron-doped iron pnictides is clearly inconsistent with the spin-density-wave explanation of the transverse incommensurate magnetic order Pratt et al. (2011). These results suggest that the incommensurate AF order in electron-doped iron pnictides arises from a localized moment Si and Abrahams (2008); Fang et al. (2008); Xu et al. (2008), instead of spin-density-wave order induced from nested Fermi surfaces like incommensurate AF order in pure chromium metal Fawcett et al. (1994).
The electronic phase diagrams of hole-doped Ba1-xKxFe2As2 and Ba1-xNaxFe2As2 determined from neutron scattering experiments on powder samples are summarized in Figures 5(a) and 5(c), respectively Avci et al. (2012, 2013, 2014). Compared with electron-doped BaFe2As2, hole-doping does not separate the structural and magnetic phase transitions and the AF and superconducting coexistence region is also present. In particular, for Ba1-xNaxFe2As2 near , a new magnetic ordered phase in the tetragonal symmetry of the underlying lattice has been found Avci et al. (2014). In addition, superconductivity appears in heavily hole-doped regimes, much different from the electron-doped case.
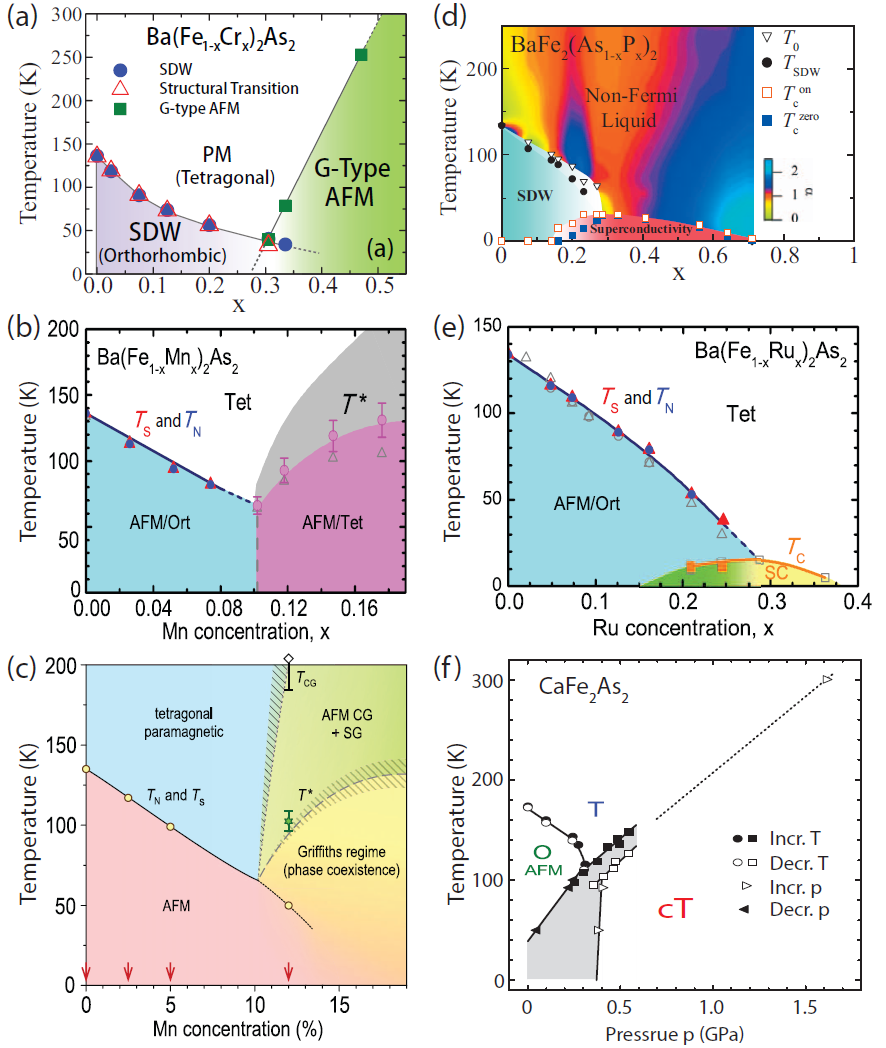
In copper oxide superconductors, superconductivity can only be induced by electron and hole doping into the nearly perfect CuO2 plane, and impurity substitution at the Cu sites by other elements dramatically suppresses superconductivity Kastner et al. (1998); Kivelson et al. (2003); Armitage et al. (2010); Fujita et al. (2012); Tranquada et al. (2014). The situation is much different for iron pnictides. While impurities such as Cr and Mn substituted for Fe in BaFe2As2 suppress the static AF order in the parent compound without inducing superconductivity [Figs. 6(a), 6(b) and 6(c)] Marty et al. (2011); Kim et al. (2010); Inosov et al. (2013), isoelectronic substitution by replacing As with P [Fig. 6(d)] Jiang et al. (2009); Shibauchi et al. (2014) or Fe with Ru [Fig. 6(e)] in BaFe2As2 Kim et al. (2011) can induce superconductivity. For Cr-doped Ba(Fe1-xCrx)2As2, neutron diffraction experiments on single crystals have established the structural and magnetic phase diagram, showing a suppression of the collinear AF order for samples with . For , the system becomes a -type antiferromagnet with a tetragonal structure as shown in Fig. 6(a) Marty et al. (2011). The situation in Mn-doped Ba(Fe1-xMnx)2As2 is somewhat similar. With increasing Mn doping in BaFe2As2, the structural and AF phase transitions are gradually suppressed as shown in Figs. 6(b) and 6(c) Kim et al. (2010); Inosov et al. (2013). For Mn concentration , the system goes into a mixed phase, possibly in the Griffiths regime, with coexisting short-range spin excitations at AF wave vectors similar to those in BaFe2As2 [] and BaMn2As2 [ rotated 45∘ from ] Inosov et al. (2013).
In contrast to Cr and Mn doping, isoelectronic doping by replacing As with P in BaFe2(As1-xPx)2 induces optimal superconductivity near Jiang et al. (2009). From the systematic transport and London penetration depth measurements on BaFe2(As1-xPx)2, a quantum critical point has been identified near optimal superconductivity at [Fig. 6(d)] Shibauchi et al. (2014). For isoelectronic Ba(Fe1-xRux)2As2, optimal superconductivity again appears near Ru-doping level of [Fig. 6(e)] Kim et al. (2011). However, there are no report for the presence of a quantum critical point in this system. Figure 6(f) shows the pressure dependence of the CaFe2As2 phase diagram Goldman et al. (2009). While superconductivity can be induced directly via applying hydrostatic pressure in BaFe2As2 and SrFe2As2 Johnston (2010); Stewart (2011), external pressure exerted on CaFe2As2 results in a nonmagnetic collapsed tetragonal (cT) phase, eliminating the static AF ordered moment and spin excitations without inducing superconductivity Goldman et al. (2009).
Although a majority of neutron scattering work has been focused on the 122 family of materials because of the availability of high-quality single crystals, there are also important phase diagram results in the 1111 family. For example, P-doping in the CeFeAsO family of materials suppresses static AF order, but does not induce superconductivity de la Cruz et al. (2010). Systematic neutron scattering studies of the structural and magnetic phase transitions in powder samples of CeFeAs1-xPxO suggest that the pnictogen height [the average Fe-As(P) distance] and orthorhombicity of the CeFeAs1-xPxO unit cell critically control the iron AF ordered moment and Nel temperature of the system. Figure 7(a) shows the P-doping dependence of the structural and AF phase transition temperatures in CeFeAs1-xPxO, suggesting the presence of a magnetic quantum critical point near de la Cruz et al. (2010). A complete mapping of the CeFeAs1-xPxO phase diagram shown in Fig. 7(b) was obtained via transport and susceptibility measurements, which reveal that superconductivity does not appear in the entire phase diagram, possibly due to heavy fermion properties of the rare earth element Ce Luo et al. (2010). Another recent advance is the discovery of bipartite magnetic parent phases in the H-doped LaFeAsO1-xHx family of materials Hiraishi et al. (2014). In contrast to the general phase diagram of iron pnictides, superconductivity in LaFeAsO1-xHx appears in two domes adjacent to two different AF phases with different magnetic structures and Nel temperatures [Fig. 7(c)] Hiraishi et al. (2014). These results again confirm the notion that superconductivity in iron-based superconductors is intimately connected with the magnetic interactions.
III Spin excitations and their relationship with superconductivity
The rapid development of neutron time-of-flight chopper spectrometers in recent years has allowed measurements of spin excitations in high- superconductors throughout the Brillouin zone for energy transfers up to 1 eV. In the case of copper oxides, spin waves in La2CuO4 have been mapped out throughout the Brillouin zone Coldea et al. (2001); Headings et al. (2010). While the low energy spin excitations are well described by theory based on the Heisenberg Hamiltonian, high-energy spin waves are damped near the position in reciprocal space and merge into a momentum dependent continuum suggesting the decay of spin waves into other excitations Coldea et al. (2001); Headings et al. (2010). The effective magnetic exchange couplings of La2CuO4 determined from the Heisenberg model are summarized in Table II. The doping evolution of spin excitations as a function of electron and hole doping and their coupling to superconductivity are reviewed recently Armitage et al. (2010); Fujita et al. (2012); Tranquada et al. (2014). In the case of iron-based superconductors, the situation is more complicated. Of the 11, 111, 122, 1111, 245 families of materials, spin waves in the AF parent compounds throughout the Brillouin zone were mapped out for the 11 Lipscombe et al. (2011); Zaliznyak et al. (2011), 111 Zhang et al. (2014a), 122 Diallo et al. (2009); Zhao et al. (2009); Harriger et al. (2011); Ewings et al. (2011), and 245 Wang et al. (2011c); Xiao et al. (2013); Chi et al. (2013) families of materials due to the availability of large single crystals needed for inelastic neutron scattering experiments. Although single crystals of the 1111 family of materials are still not large enough to allow a determination of the entire spin wave spectra, measurements of low-energy spin waves reveal that the system is highly two-dimensional with weak magnetic exchange coupling along the axis Ramazanoglu et al. (2013). In the Sections III A and B, we describe spin wave measurements in the parent compounds of different families of iron-based superconductors and discuss their relationship with superconductivity.
III.1 Spin waves in the parent compounds of iron-based superconductors
Inelastic neutron scattering studies of spin waves in the parent compounds of iron-based superconductors began soon after the availability of single crystals of the 122 family Canfield and Bud’ko (2010). For a magnetically ordered system, spin waves occur when the magnetic moments precess around their ordered configuration. Regardless of the microscopic origin of the magnetic order, spin waves of an ordered system should exhibit sharp excitations in the long wavelength limit (small ) and can be described by a suitable Hamiltonian using perturbation theory. For a spin Hamiltonian, one can starts with a Heisenberg model where the energy of spin waves depends only on the relative orientation of neighboring spins. In the initial neutron scattering experiments on low-energy spin waves in SrFe2As2 Zhao et al. (2008a), CaFe2As2 McQueeney et al. (2008), and BaFe2As2 Matan et al. (2009), a spin gap due to magnetic iron anisotropy was identified. In addition, the low-energy spin waves were described by either a local moment Heisenberg Hamiltonian Zhao et al. (2008a); McQueeney et al. (2008) or the spin excitation continuum from itinerant electrons Diallo et al. (2009); Matan et al. (2009). However, these measurements were unable to reach spin waves near the zone boundary and thus did not allow a conclusive determination of the effective nearest and next nearest neighbor magnetic exchange couplings denoted as / and , respectively [Fig. 4(b)]. In the itinerant picture of the magnetism in iron pnictides Mazin (2010); Hirschfeld et al. (2011), spin waves from the AF ordered phase should arise from quasiparticle excitations between the electron and hole Fermi surfaces and form a spin excitation continuum at high-energies Kaneshita and Tohyama (2010). In the initial neutron time-of-flight experiments on CaFe2As2, spin waves up to an energy of 100 meV were measured and found to fit a Heisenberg Hamiltonian Diallo et al. (2009). However, no spin wave signals were found for energies above 100 meV consistent with initio calculations of the dynamic magnetic susceptibility, indicating that the high energy spin excitations are dominated by the damping of spin waves by particle-hole excitations Diallo et al. (2009).
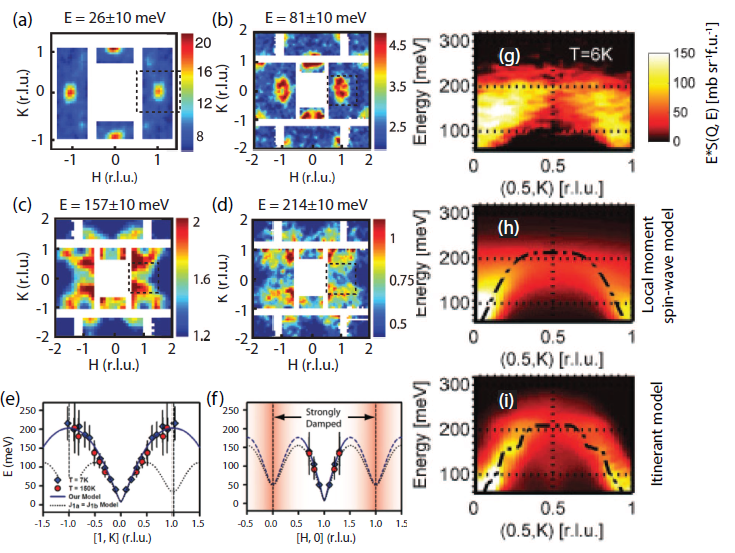
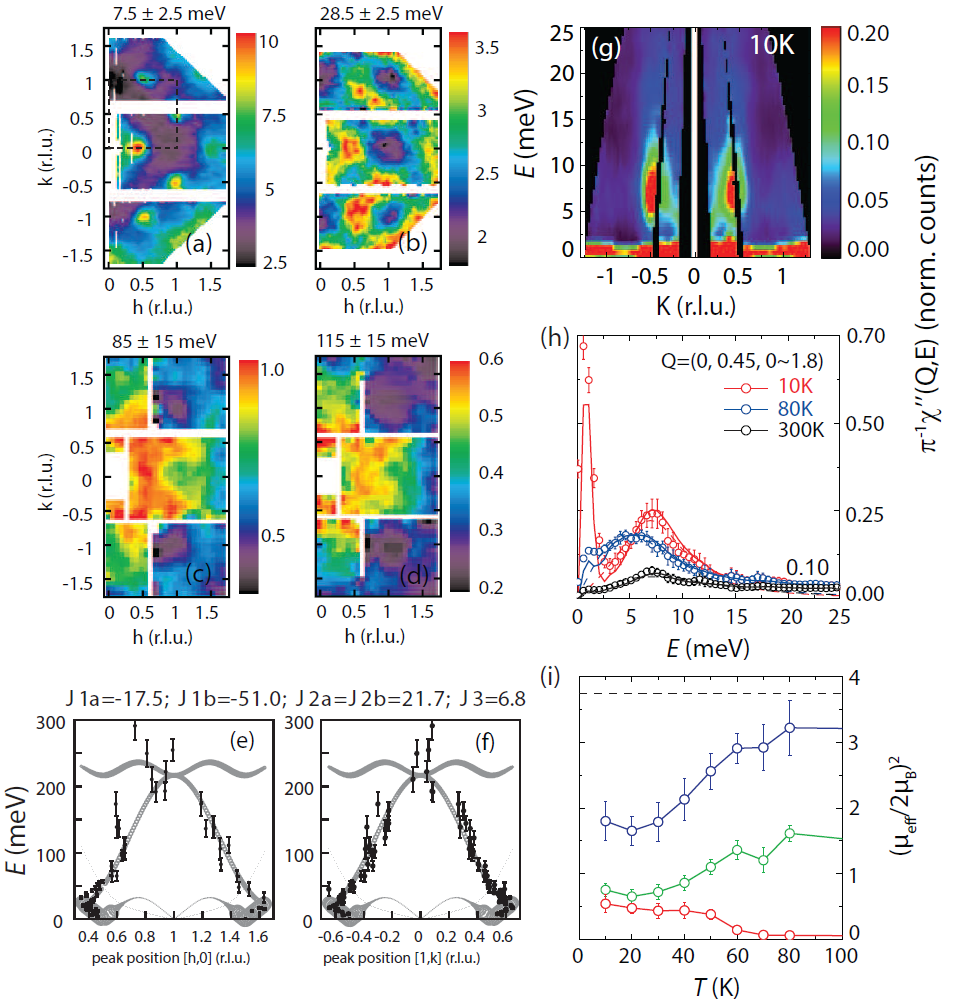
In subsequent neutron scattering experiments on CaFe2As2 Zhao et al. (2009), BaFe2As2 Harriger et al. (2011), and SrFe2As2 using more sample mass Ewings et al. (2011), spin waves were mapped out throughout the Brillouin zone and the zone boundary energy scales were found to be around 220 meV. Figures 8(a)-8(d) show images of spin waves in BaFe2As2 in the AF ordered state at energies of , , , and meV, respectively Harriger et al. (2011). With increasing energy, spin waves become diffusive but one can still see clear excitations near the zone boundary at meV, different from the earlier experiment Diallo et al. (2009). Figures 8(e) and 8(f) show spin wave dispersions of BaFe2As2 along the in-plane and directions. Using a Heisenberg Hamiltonian with anisotropic spin wave damping, one can fit the entire spin wave spectrum with a large in-plane nearest neighbor magnetic exchange anisotropy (, ) and finite next nearest neighbor exchange coupling () Zhao et al. (2009); Harriger et al. (2011). The details of Heisenberg Hamiltonian for spin waves have been discussed in Diallo et al. (2009); Zhao et al. (2009); Harriger et al. (2011). The outcomes of the fits with anisotropic in-plane magnetic exchanges are shown as solid lines in Fig. 8(e), while the dashed lines in the Figure are calculations assuming isotropic in-plane magnetic exchange couplings. The discovery of large in-plane exchange anisotropy is surprising given the small orthorhombic lattice distortion in the AF ordered state Wysocki et al. (2011). Only by probing spin waves at high energies near the zone boundary, one can conclusively determine the effective magnetic exchange couplings in the system. Different magnetic structures and spin exchange couplings in iron-based materials has been studied using a localized moment model with different nearest and next nearest neighbor exchange couplings Hu et al. (2012).
Although spin waves in CaFe2As2 Zhao et al. (2009) and BaFe2As2 Harriger et al. (2011) can be modeled by a local moment Heisenberg Hamiltonian, one still has to use anisotropic spin wave damping characteristic of an itinerant electron system. In the neutron scattering work on spin waves of SrFe2As2 [Fig. 8(g)] Ewings et al. (2011), the authors report that a Heisenberg Hamiltonian that can fit the low-energy spin wave data fails to describe the spectrum near the zone boundary [Fig. 8(h)]. The overall spin wave spectrum is instead best described by an itinerant model with large spin wave damping near the zone boundary [Fig. 8(i)] Ewings et al. (2011).
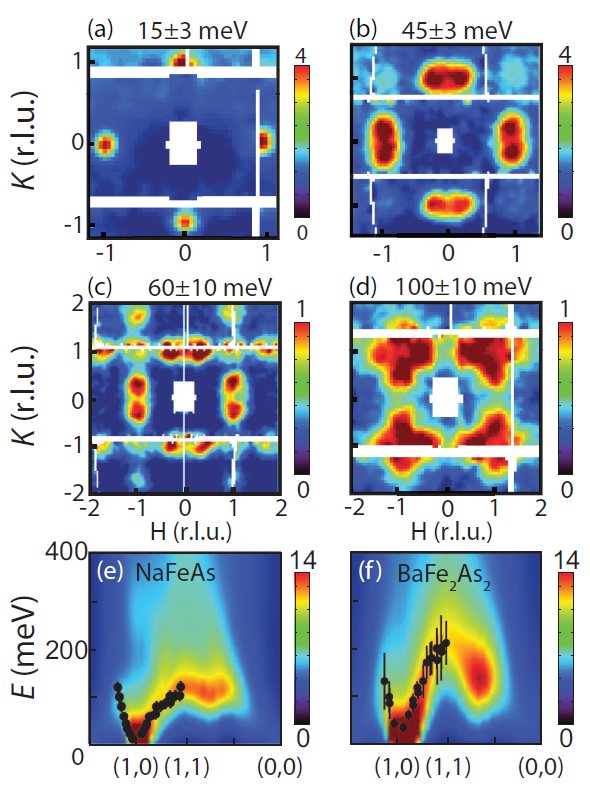
Similar to the 122 family of materials, NaFeAs, the parent compound of the 111 family of iron pnictides, has the collinear AF structure albeit with a greatly reduced ordered moment size Li et al. (2009c). Triple-axis neutron scattering experiments on single crystals of NaFeAs studied low-energy spin waves and found a small gap in the excitation spectrum Park et al. (2012); Song et al. (2013b). Figure 9 summarizes the evolution of spin waves to the zone boundary as a function of increasing energy Zhang et al. (2014a). Compared with the spin wave zone boundary energy of 220 meV in BaFe2As2 as shown in Fig. 8, spin waves in NaFeAs reach the zone boundary at the in-plane wave vector around 110 meV [Fig. 9(d)]. This means that the overall magnetic excitation bandwidth in the 111 family is considerably lower than that of the 122 family of iron pnictides. Figures 9(e) and 9(f) compare the experimental and the combined density functional theory and dynamical mean field theory (DFT+DMFT) calculations of spin wave dispersion of NaFeAs and BaFe2As2, respectively. The outcome suggests that pnictogen height is correlated with the strength of electron-electron correlations and consequently the effective bandwidth of magnetic excitations in iron pnictides Zhang et al. (2014a); Yin et al. (2014).
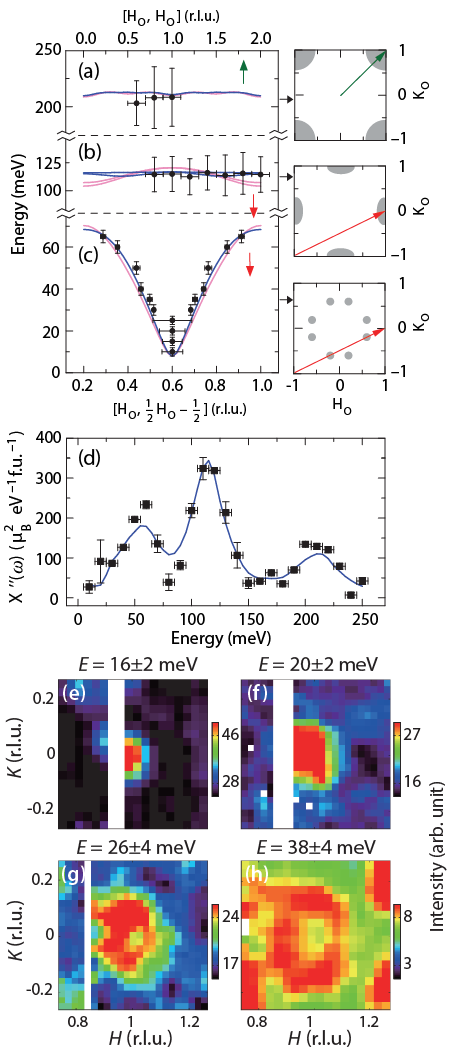
Figure 10 summarizes spin wave measurements for the iron chalcogenide Fe1+xTe Fruchart et al. (1975); Bao et al. (2009); Li et al. (2009d), the parent compound of the 11 family of iron-based superconductors Lipscombe et al. (2011); Zaliznyak et al. (2011). The static magnetic order and spin excitations of Fe1+xTe are sensitive to the excess iron in the interstitial sites Rodriguez et al. (2010, 2011); Stock et al. (2011); Wen et al. (2011). This is rather different from the iron pnictides, which cannot accommodate any excess iron in the crystal structure. For Fe1.05Te and Fe1.1Te, the AF structure is commensurate bi-collinear Rodriguez et al. (2011). Figures 10(a), 10(b), 10(c), and 10(d) show the two-dimensional images of spin waves in Fe1.05Te at , , , and meV, respectively Lipscombe et al. (2011). The dispersion of spin waves is different from that of the 122 and 111 families, and becomes diffusive for energies above 85 meV without well-defined spin waves [Figs. 10(c) and 10(d)]. The solid lines in Figs. 10(e) and 10(f) show fits of the dispersion using a Heisenberg Hamiltonian assuming exchange couplings , , , and Lipscombe et al. (2011). In a separate neutron scattering experiment Zaliznyak et al. (2011), the authors find that the low-energy spin excitations can be well-described by liquid-like spin plaquette correlations [Fig. 10(g)]. Furthermore, the integrated magnetic excitation intensity increases on warming [Fig. 10(h)]. The effective spin per Fe at K in the AF ordered phase grows to at K in the paramagnetic phase, suggesting that the local magnetic moments are entangled with the itinerant electrons in the system [Fig. 10(i)] Zaliznyak et al. (2011).
Of all the iron-based superconductors, alkali iron selenides Fe2-ySe2 Guo et al. (2010); Fang et al. (2011) are unique in that superconductivity in this class of materials always coexists with a static long-range AF order with a large moment and high Nel temperature Bao et al. (2011); Ye et al. (2011); Wang et al. (2011b); Zhao et al. (2012); May et al. (2012). Although there is ample evidence indicating that the superconducting alkali iron selenides are mesoscopically phase separated from the insulating Fe4Se5 phase with the block AF structure as shown in Fig. 2(d) Wang et al. (2012c); Speller et al. (2012); Ricci et al. (2011); Shoemaker et al. (2012); Li et al. (2011b); Ksenofontov et al. (2011); Shermadini et al. (2012); Charnukha et al. (2012); Texier et al. (2012); Carr et al. (2014), there is still no consensus on the chemical and magnetic structures of their parent compounds Ye et al. (2011); Wang et al. (2011b); Zhao et al. (2012); May et al. (2012). Assuming that the insulating Fe4Se5 phase is the parent compound of the superconducting Fe2-ySe2, its spin waves have been mapped out by several groups Wang et al. (2011c); Xiao et al. (2013); Chi et al. (2013). Compared with spin waves in iron pnictides and iron chalcogenides (Figs. 7-10), the dispersion of the spin waves in insulating Fe4Se5 has two optical branches at high energies and one acoustic branch at low energy, where the arrows are wave vector scales and the thin dashed line separates the vertical energy scale for the acoustic and low-energy optical spin waves from the high-energy optical spin waves [Figs. 11(a)-11(c)] Wang et al. (2011c). By integrating the energy dependence of the local dynamic susceptibility in Rb0.89Fe1.58Se2 [Fig. 11(d)], it was found that the total moment sum rule is exhausted for magnetic scattering at energies below 250 meV. Therefore, spin waves in insulating Rb0.89Fe1.58Se2 can be regarded as a classic local moment system where a Heisenberg Hamiltonian is an appropriate description of the spin wave spectrum.
On the other hand, if the semiconducting AF phase with rhombus iron vacancy order [Fig. 2(e)] is the parent compound Zhao et al. (2012); Wang et al. (2014), one finds that spin waves of the system are rather close to those of iron pnictides. Figure 11(e), 11(f), 11(g), 11(h) shows the evolution of spin waves as a function of increasing energy for the semiconducting K0.85Fe1.54Se2 with collinear AF order and K Zhao et al. (2014). The data agrees well with calculations using a Heisenberg Hamiltonian. A comparison of the observed spin wave spectrum in this system with those of the CaFe2As2 single crystals Zhao et al. (2009) reveals remarkable similarity, and thus suggesting similar effective magnetic exchange couplings in these systems Zhao et al. (2014).
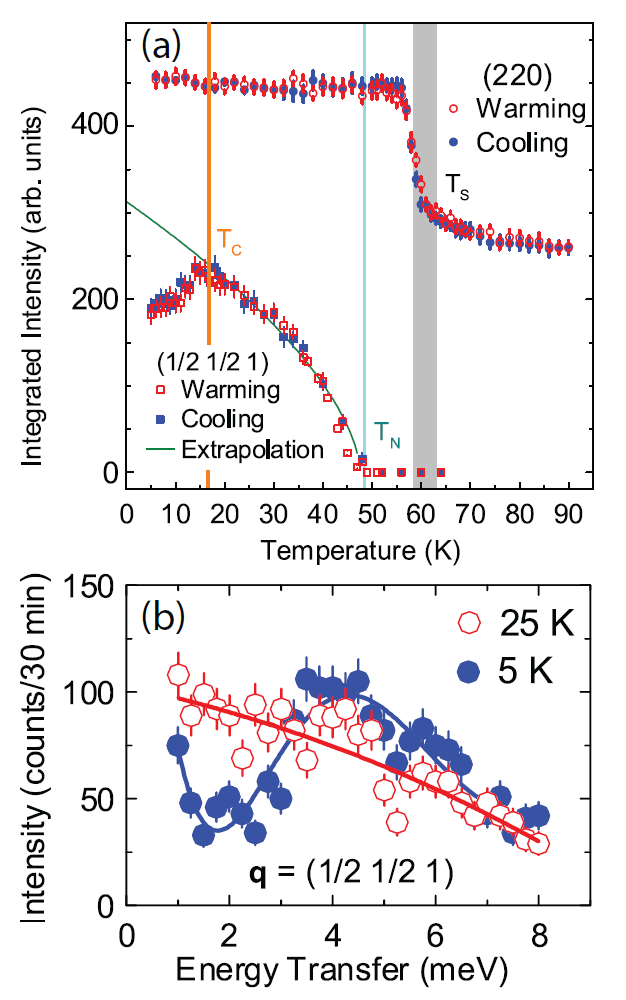
Table II summarizes the effective magnetic exchange couplings for the parent compounds of known iron-based superconductors. We also list the effective magnetic exchange couplings for La2CuO4, the parent compound of copper oxide superconductors. They are dominated by the large nearest neighbor and weak next nearest neighbor magnetic exchange couplings (Fig. 4). For the parent compounds of iron-based superconductors, it is instructive to compare their effective magnetic exchange couplings. In spite of their dramatically different AF structures summarized in Figs. 1-3 , they all appear to have similar next nearest neighbor magnetic exchange couplings (see Table II). This is consistent with the idea that the next nearest neighbor coupling is mainly determined by a local superexchange mechanism mediated by As or Se/Te, regardless of their metallic or insulating ground states Abrahams and Si (2011); Hu and Ding (2012).
| Materials | (meV) | (meV) | (meV) | (meV) | (meV) | (meV) |
|---|---|---|---|---|---|---|
| La2CuO4 151515Coldea et al. (2001). | 0 | 0 | ||||
| NaFeAs 161616Zhang et al. (2014a). | 0 | |||||
| CaFe2As2 171717Zhao et al. (2009). | 0 | |||||
| BaFe2As2 181818Harriger et al. (2011). | 0 | |||||
| SrFe2As2 (L) 191919Ewings et al. (2011). | 0 | |||||
| SrFe2As2 (H) 202020The L and H are fits using low and high-energy spin waves, respectively. | 0 | |||||
| Fe1.05Te 212121Lipscombe et al. (2011). | 1 | |||||
| Rb0.89Fe1.58Se2 222222Wang et al. (2011c). | ||||||
| (Tl,Rb)2Fe4Se5 232323Chi et al. (2013). | 10 2 | 29 | 0 | |||
| K0.85Fe1.54Se2 242424Zhao et al. (2014). | 0 |
III.2 Neutron spin resonance and its relationship with superconductivity
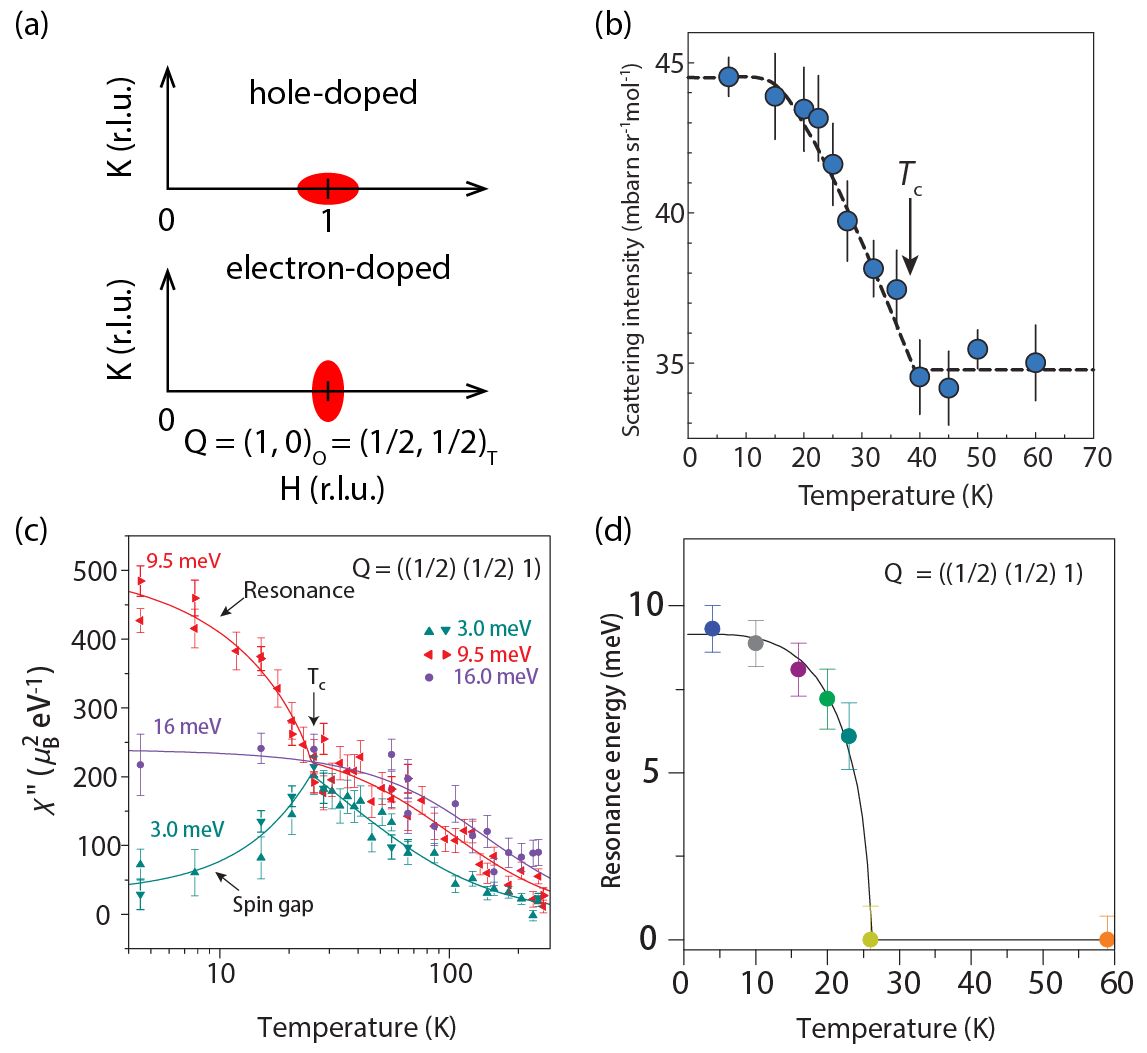
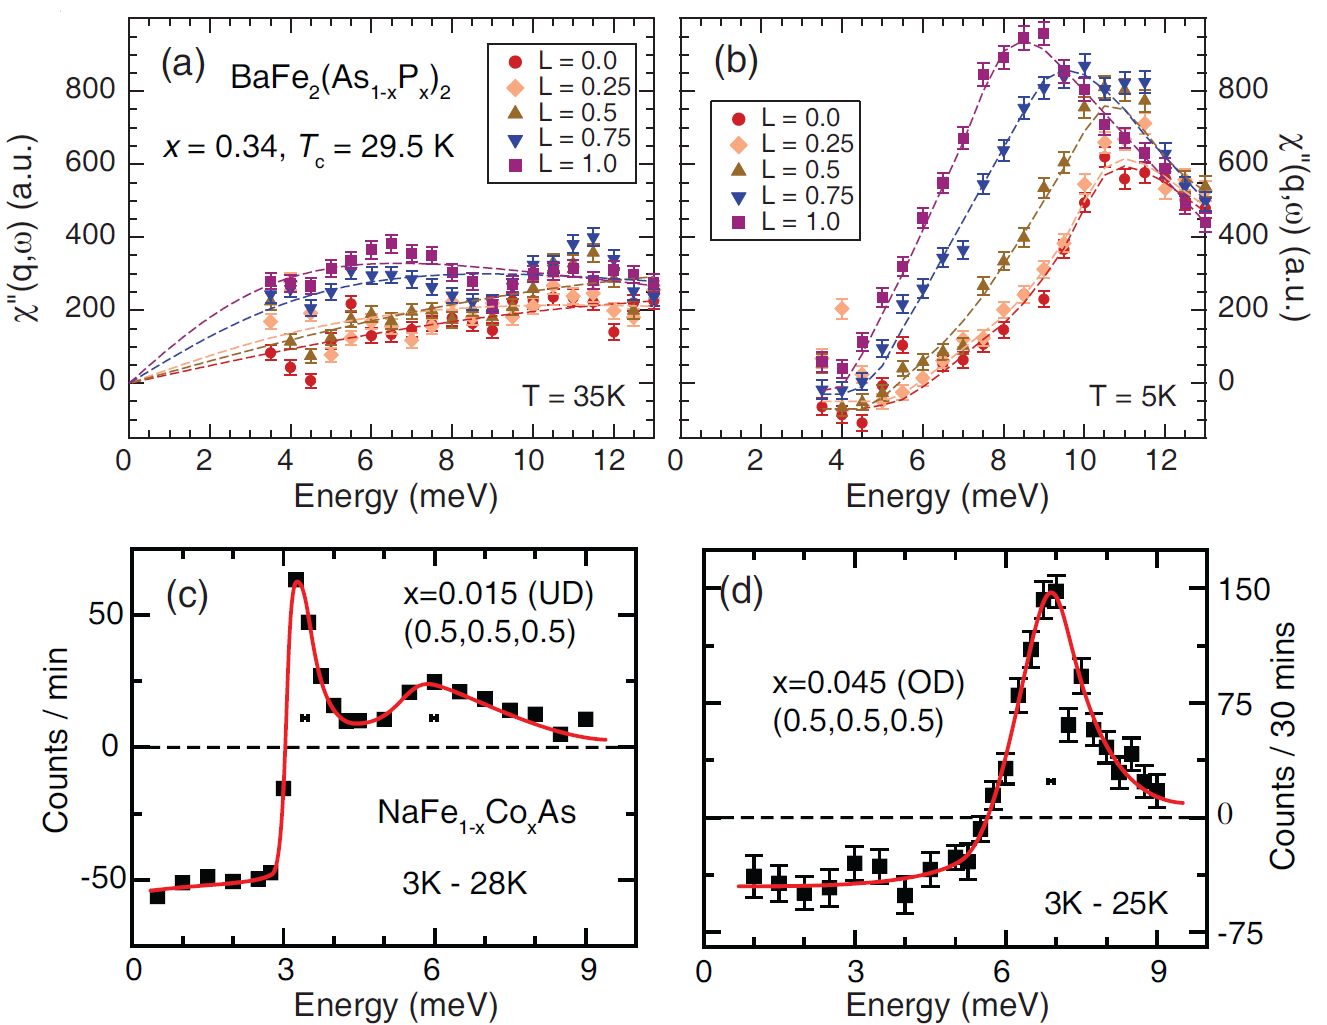
The neutron spin resonance is a collective magnetic excitation occurring below with a temperature dependence similar to the superconducting order parameter Eschrig (2006). First discovered in hole doped YBa2Cu3O6+x copper oxide superconductors Rossat-Mignod et al. (1991), the resonance is located near the AF ordering wave vector of the nonsuperconducting parent compound and occurs at an energy related to the superconducting Dai et al. (2000); Wilson et al. (2006a) or gap energy Yu et al. (2009). It has been argued that the mode is a signature of the -wave pairing as a result of quasiparticle excitations between the sign reversed -wave superconducting gaps Eschrig (2006). Soon after the discovery of iron pnictide superconductors Kamihara et al. (2008), a neutron spin resonance was found in powder samples of Ba0.6K0.4Fe2As2 Christianson et al. (2008). Since the resonance occurs below at the momentum transfer () close to in BaFe2As2 [Fig. 12 (a) and 12(b)] Christianson et al. (2008), the mode is believed to arise from the sign reversed quasiparticle excitations between the hole and electron Fermi surfaces near the and points in reciprocal space, respectively (Figs. 12-14) Mazin (2010); Hirschfeld et al. (2011). In subsequent inelastic neutron scattering experiments on single crystals of electron doped Ba(Fe1-xCox)2As2 Lumsden et al. (2009); Inosov et al. (2010) and BaFe2-xNixAs2 superconductors Chi et al. (2009); Li et al. (2009b), the resonance was indeed found at the in-plane AF ordering wave vector [Fig. 12(a)]. Similar measurements on powder samples of LaFeAsO1-xFx Ishikado et al. (2009); Wakimoto et al. (2010); Shamoto et al. (2010) and molecular-intercalated FeSe Taylor et al. (2013) also revealed resonance like spin excitations below . Figure 12(c) shows temperature dependence of the imaginary part of the dynamic susceptibility for energies below ( meV), at ( meV), and above ( meV) the resonance in superconducting BaFe1.85Co0.15As2 ( K). It is clear that the intensity gain of the resonance below is at the expense of opening a spin gap at energies below it. By carefully monitoring the temperature dependence of the resonance, the authors of Inosov et al. (2010) suggest that the energy of the mode decreases with increasing temperature and may be directly correlated with the temperature dependence of the superconducting gap energy [Fig. 12(d)]. However, recent experiments on the nearly optimally doped BaFe1.904Ni0.096As2 superconductor found that the resonance energy is essentially temperature independent on warming Luo et al. (2013a), different from that of BaFe1.85Co0.15As2 Inosov et al. (2010).
In the electron underdoped regime where static AF order coexists and competes with superconductivity [Figs. 5(b) and 5(d)], the static AF order occurs at a lower temperature than . Figure 13(a) shows the temperature dependence of the nuclear peak intensity at and magnetic Bragg scattering at for underdoped Ba(Fe0.953Co0.047)2As2 ( K) Pratt et al. (2009). In the high temperature tetragonal state, the observed neutron scattering intensity from a strong nuclear Bragg peak is lower than that expected from the structure factor calculation due to multiple scattering effect, termed as the neutron extinction effect Hamilton (1957). When the symmetry of the system is reduced from tegragonal to orthorhombic, there is a dramatic intensity gain below 60 K arising from the release of the neutron extinction effect and the AF order occurs below K. Upon entering into the superconducting state, the intensity of the static AF order decreases. Simultaneously, a weak neutron spin resonance appears at meV [Fig. 13(b)], suggesting that the intensity gain of the mode arises from suppression of the static AF order and spin excitations at energies below the resonance Pratt et al. (2009); Christianson et al. (2009). Application of a magnetic field which partially suppresses superconductivity will enhance the intensity of the static AF order and suppress the resonance Wang et al. (2011d). These results further suggest that the static AF order coexists and competes with superconductivity in electron underdoped iron pnictides.
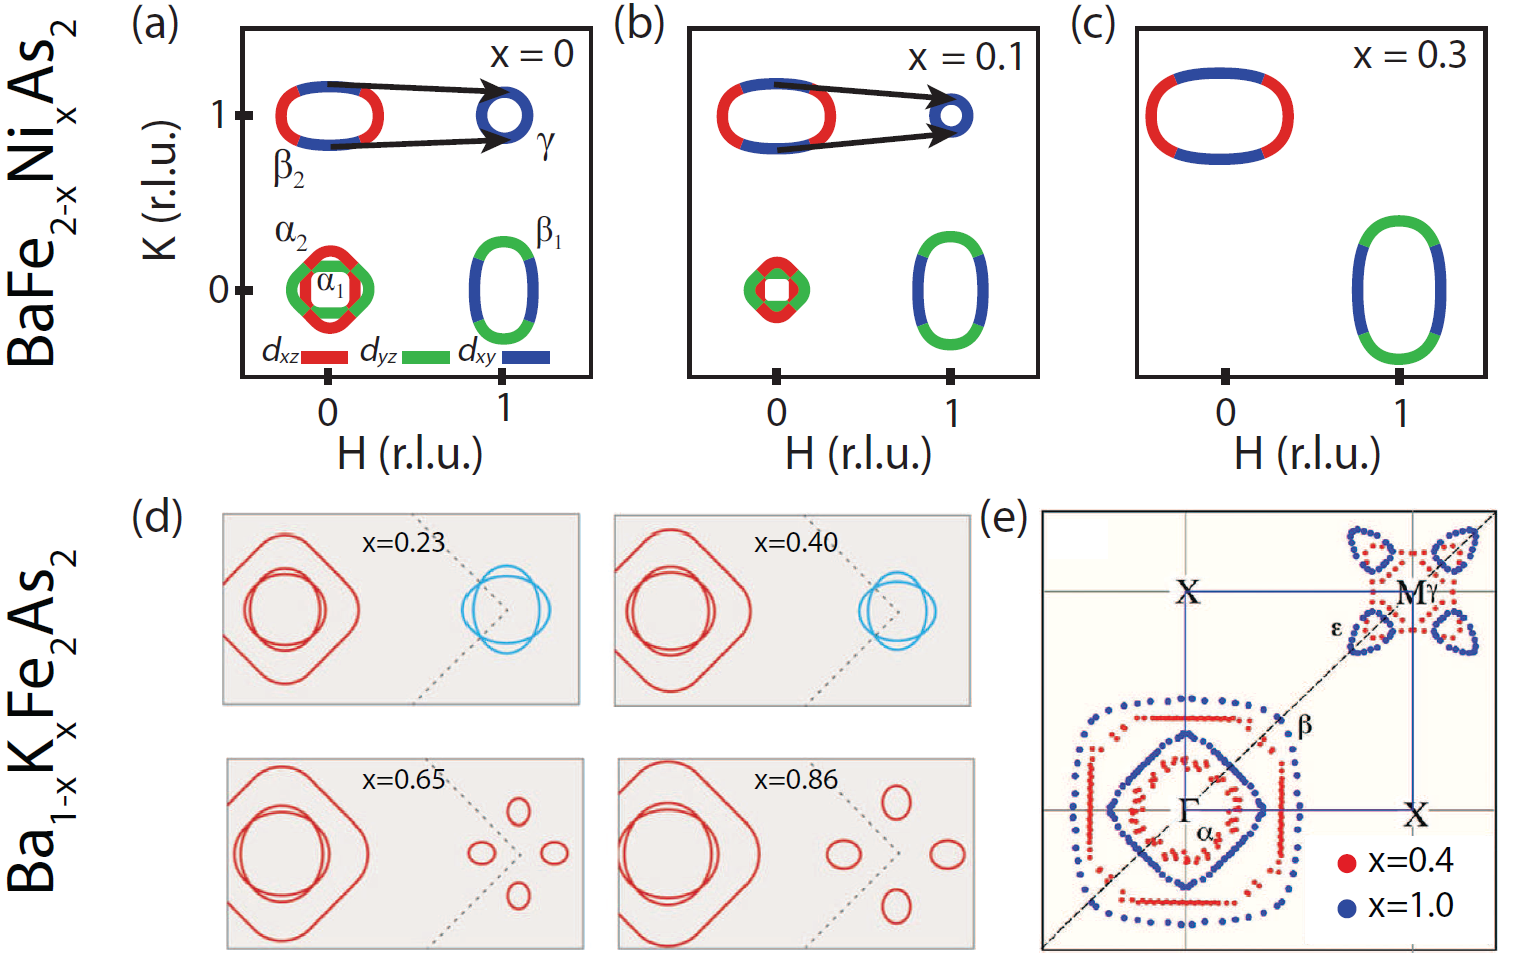
From density functional theory calculations Mazin et al. (2008); Kuroki et al. (2008) and angle resolved photoemission spectroscopy (ARPES) experiments on electron/hole doped iron pnitides Richard et al. (2011); Chen et al. (2014), we know that Fermi surfaces in most of these materials are composed of hole-like pockets near and electron-like pockets near point at . The neutron spin resonance in iron pnictides at can arise from the sign reversed quasiparticle excitations between the hole and electron Fermi surfaces in an -wave superconductor as shown in Fig. 14 Mazin (2010); Hirschfeld et al. (2011), exhibiting the same signature as the sign changed superconducting gap function in the -wave copper oxides Eschrig (2006). With increasing electron-doping, the hole and electron Fermi surfaces decrease and increase in size, respectively [Figure 14(a)-14(c)]. Similarly, the hole Fermi pockets at the point increase in size with increasing hole-doping, while the electron Fermi surfaces exhibit a Lifshitz transition at point before becoming hole overdoped KFe2As2 [Fig. 14(d)-14(f)] Chen et al. (2014).
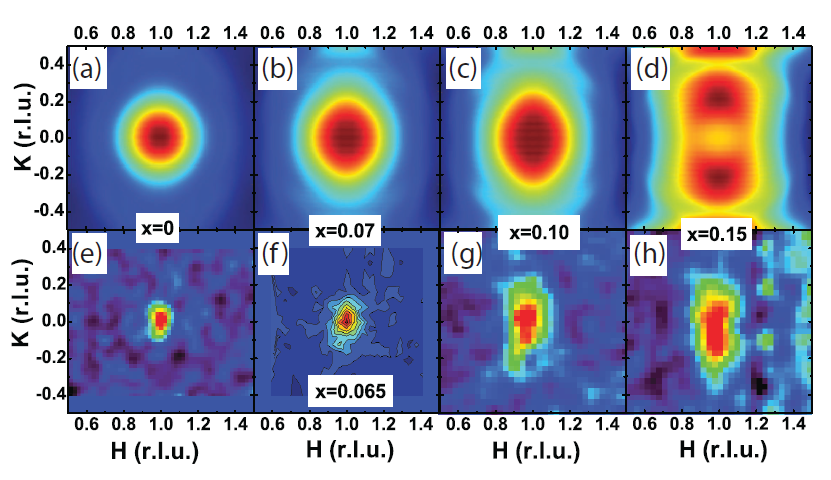
Using the random phase approximation (RPA) based on a three-dimensional tight-binding model in the local density approximation (LDA) Graser et al. (2010), calculations can predict the momentum anisotropy of the low-energy spin excitations and the resonance Park et al. (2010). For electron-doped BaFeAs2, low-energy spin excitations become progressively elongated ellipses along the transverse direction relative to the spin waves in BaFe2As2 due to the enhancement of the intra-orbital, but inter-band, pair scattering process between the orbitals [Figs. 14(a) and 14(b)] Zhang et al. (2010). Figure 15 shows the comparison of the RPA calculations and experimentally measured in-plane spin excitation anisotropy in BaFe2-xNixAs2 superconductors Luo et al. (2012a), confirming that the quasiparticle excitations between the hole and electron Fermi surfaces are consistent with the wave vector evolution of the low-energy spin excitations Luo et al. (2013a).
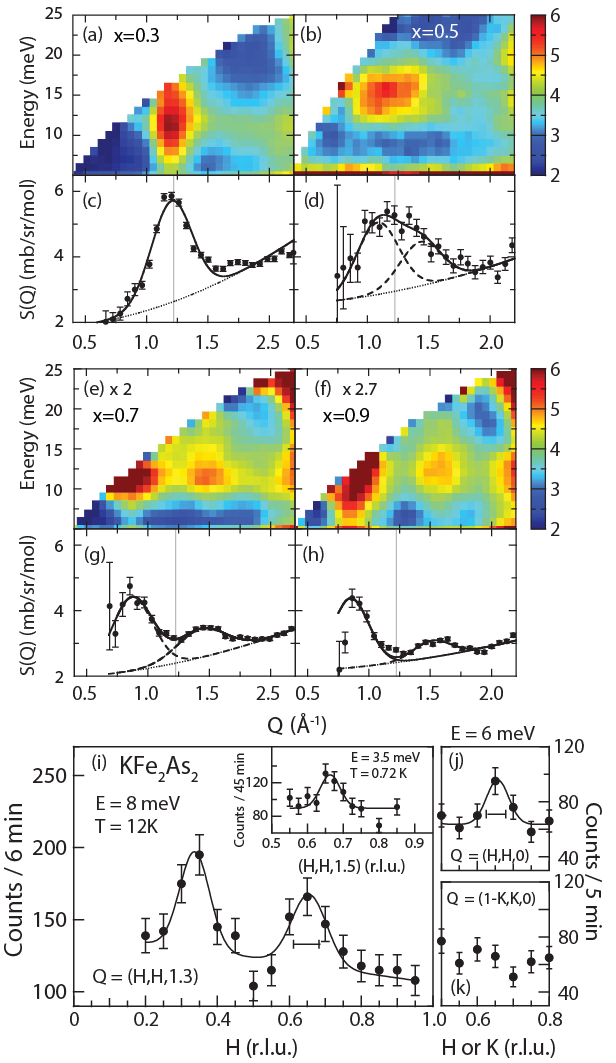
In the case of hole-doped materials, RPA calculations have predicted that spin excitations should be longitudinally elongated, and thus rotated 90∘ from those of the electron-doped BaFeAs2 Park et al. (2010). Inelastic neutron scattering experiments on hole-doped single crystals of superconducting Ba0.67Ka0.33Fe2As2 ( K) reveal longitudinally elongated spin excitations for energies near the resonance, consistent with RPA calculations Zhang et al. (2011a). Figure 16(a)-16(h) plots the hole-doping dependence of the resonance obtained using high-quality powder samples of Ba1-xKxFe2As2 Avci et al. (2011); Castellan et al. (2011). Although these measurements do not provide precise information concerning the wave vector dependence of the spin excitations, they do give the hole-doping evolution of the total momentum transfer of the mode. With increasing hole-doping, the sharp resonance centered at Å-1 for [Fig. 16(a) and 16(c)] becomes broader in and splits into two peaks for and 0.9 [Fig. 16(e)-16(h)] Castellan et al. (2011). This is consistent with the RPA result that hole-doping induces longitudinal incommensurate spin excitations Castellan et al. (2011). Indeed, neutron scattering experiments on hole overdoped KFe2As2 found two incommensurate spin excitation peaks located longitudinally away from [Fig. 16(i)-16(k)], again confirming the notion that low-energy spin excitations in hole and electron-doped iron pnictides are controlled by quasiparticle excitations between the hole and electron Fermi surfaces Lee et al. (2011).
In addition to electron or hole-doping to BaFe2As2, isoelectronic substitution to BaFe2As2 by replacing Fe with Ru Thaler et al. (2010) or As with P Jiang et al. (2009) can also induce superconductivity. Compared with the electron-doped BaFeAs2, isoelectronic substitution is much less effective in suppressing AF order and inducing superconductivity. Inelastic neutron scattering experiments on BaFe2-xRuxAs2 near optimal superconductivity reveal a neutron spin resonance similar to electron-doped BaFeAs2, but with greatly damped intensity, possibly due to the weakening of the electron-electron correlations by Ru doping Zhao et al. (2013). In the case of BaFe2(As1-xPx)2, initial neutron scattering experiments on powder samples with K have revealed the presence of a resonance at meV Ishikado et al. (2011). Figure 17(a) and 17(b) shows the energy dependence of above and below , respectively, obtained for single crystals of BaFe2As1.32P0.68 ( K) Lee et al. (2013a). In the normal state, is featureless and changes only slightly at different momentum transfers along the axis (). Upon entering into the superconducting state, a neutron spin resonance is formed and its energy is significantly dispersive along the axis [Fig. 17(b)] Lee et al. (2013a). Since the bandwidth of the dispersion becomes larger on approaching the AF ordered phase, the dispersive feature may arise from the three-dimensional AF spin correlations in the undoped parent Lee et al. (2013a).
So far, most of the neutron scattering work has been focused on single crystals of electron/hole-doped BaFe2As2 family of materials. For the NaFe1-xCoxAs family of materials Parker et al. (2010); Tan et al. (2013), the air sensitive nature of these materials makes it very difficult to perform inelastic neutron scattering experiments Tanatar et al. (2012). By using hydrogen free glue to coat the samples, neutron scattering experiments can be carried out to study the evolution of spin excitations in NaFe1-xCoxAs Park et al. (2012); Song et al. (2013b). From ARPES experiments Liu et al. (2011); Ge et al. (2013), it was found that the superconducting gap in the electron Fermi pockets of the underdoped regime near has a large anisotropy, which is absent in the hole Fermi pocket. The superconducting gap anisotropy disappears upon increasing to 0.045. Figure 17(c) and 17(d) shows the intensity gain of the resonance below for underdoped Zhang et al. (2013c) and overdoped Zhang et al. (2013a), respectively. Instead of a single resonance peak, superconductivity induces a sharp resonance at meV and a broad resonance at meV Zhang et al. (2013c). Similar measurements on electron overdoped reveal only one sharp resonance Zhang et al. (2013a). The appearance of the double resonance and the superconducting gap anisotropy in the underdoped sample was interpreted as originating from either the orbital dependence of the superconducting pairing Zhang et al. (2013c); Yu et al. (2014) or superconductivity coexisting with static AF order in the iron pnictides Rowe et al. (2012); Lv et al. (2014).
III.3 The electron and hole-doping evolution of the spin excitations in the BaFe2As2 family of iron pnictides
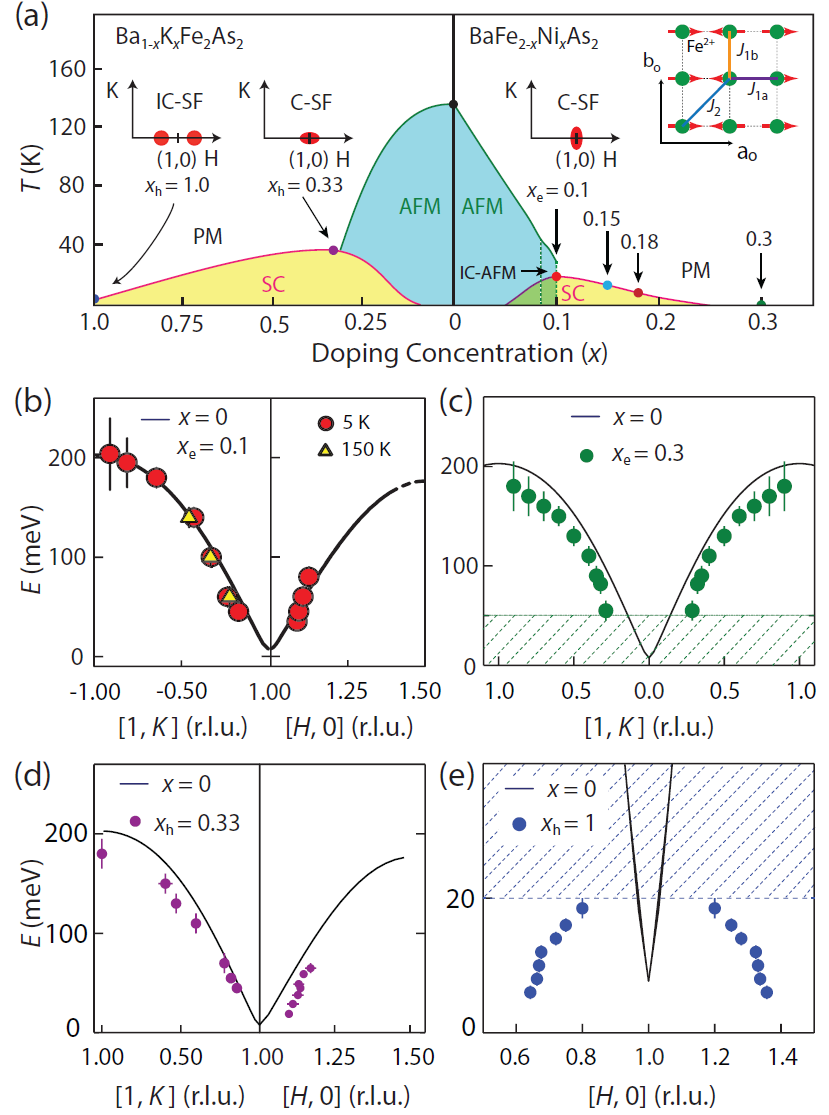
To understand the interplay between magnetism and superconductivity in iron pnictides, one must first determine the electron and hole-doping evolution of the spin excitation spectra throughout the Brillouin zone. Since single crystals of electron and hole-doped BaFe2As2 are available, one can systematically map out the evolution of spin excitations at different electron/hole-doping levels marked with arrows in the phase diagram [Fig. 18(a)] Chen et al. (2014); Harriger et al. (2011); Lee et al. (2011); Liu et al. (2012a); Tucker et al. (2012a); Luo et al. (2013a); Wang et al. (2013b). The solid lines in Figs. 18(b)-18(e) show the dispersion of spin waves in BaFe2As2 along the and directions Harriger et al. (2011). Upon electron-doping to induce optimal superconductivity, spin excitations become broader at low-energies ( meV) and couple to superconductivity via the resonance while remaining almost unchanged at high energies ( meV) Liu et al. (2012a); Tucker et al. (2012a). The red circles and yellow upper triangles in Fig. 18(b) show spin excitation dispersions of the optimally electron doped BaFe1.9Ni0.1As2 at K and 150 K, respectively Liu et al. (2012a). Figure 18(c) shows the dispersions of spin excitations of the electron-overdoped nonsuperconducting BaFe1.7Ni0.3As2, where a large spin gap forms for energies below 50 meV Wang et al. (2013b). Figure 18(d) and 18(e) shows the dispersions of spin excitations for optimally hole-doped Ba0.67K0.33Fe2As2 and hole-overdoped KFe2As2, respectively Wang et al. (2013b). While electron doping does not much affect the high-energy spin excitations and dispersion, hole-doping suppresses the high-energy spin excitations.
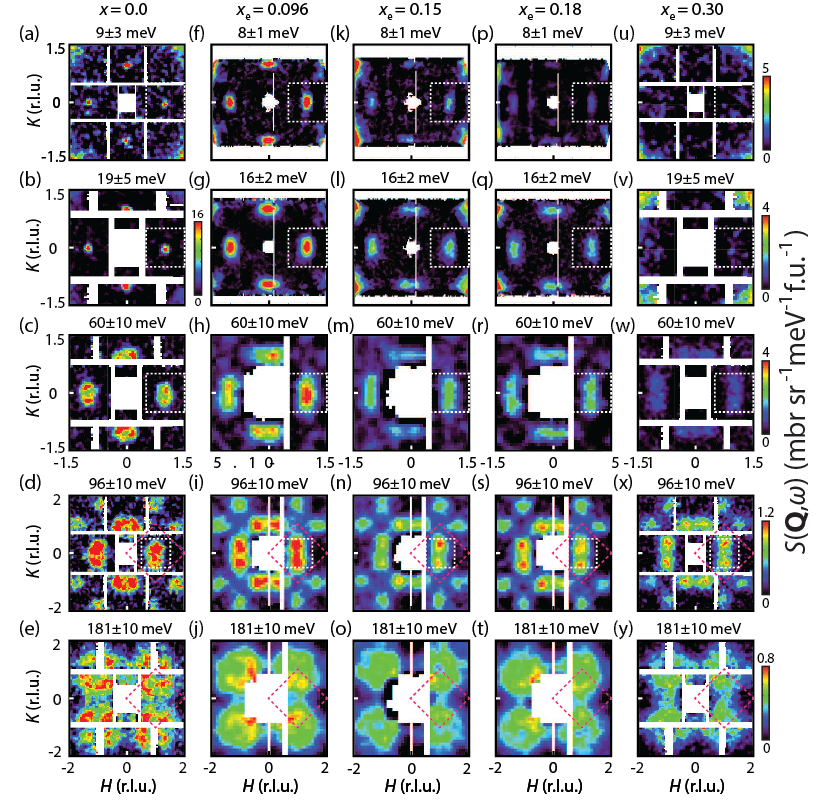
Figure 19 reveals the evolution of the two-dimensional constant-energy images of spin excitations in the plane at different energies as a function of electron-doping for BaFe2-xNixAs2 Harriger et al. (2011); Luo et al. (2013a); Wang et al. (2013b). In undoped BaFe2As2, there is an anisotropy spin gap below 15 meV, thus there is essentially no signal at meV [Fig. 19(a)] Matan et al. (2009). For nearly optimally electron doped , the spin gap is suppressed and low-energy spin excitations are dominated by the resonance [Fig. 19(f)] Lumsden et al. (2009); Inosov et al. (2010); Chi et al. (2009); Li et al. (2009b); Luo et al. (2012a). In electron overdoped BaFe2-xNixAs2 with ( K) and 0.18 ( K), spin excitations at meV become weaker and more transversely elongated [Figs. 19(k) and 19(p)] Luo et al. (2013a). For the nonsuperconducting sample, a large spin gap forms in the low-energy excitation spectra [Fig. 19(u)]. Figures 19(b)-19(e), 19(g)-19(j), 19(q)-19(t), 19(v)-19(y) show the evolution of spin excitations at different energies for BaFe2-xNixAs2 with and 0.30, respectively. While electron doping modifies spin excitations at energies below meV, high energy spin excitations remain similar and only soften slightly.
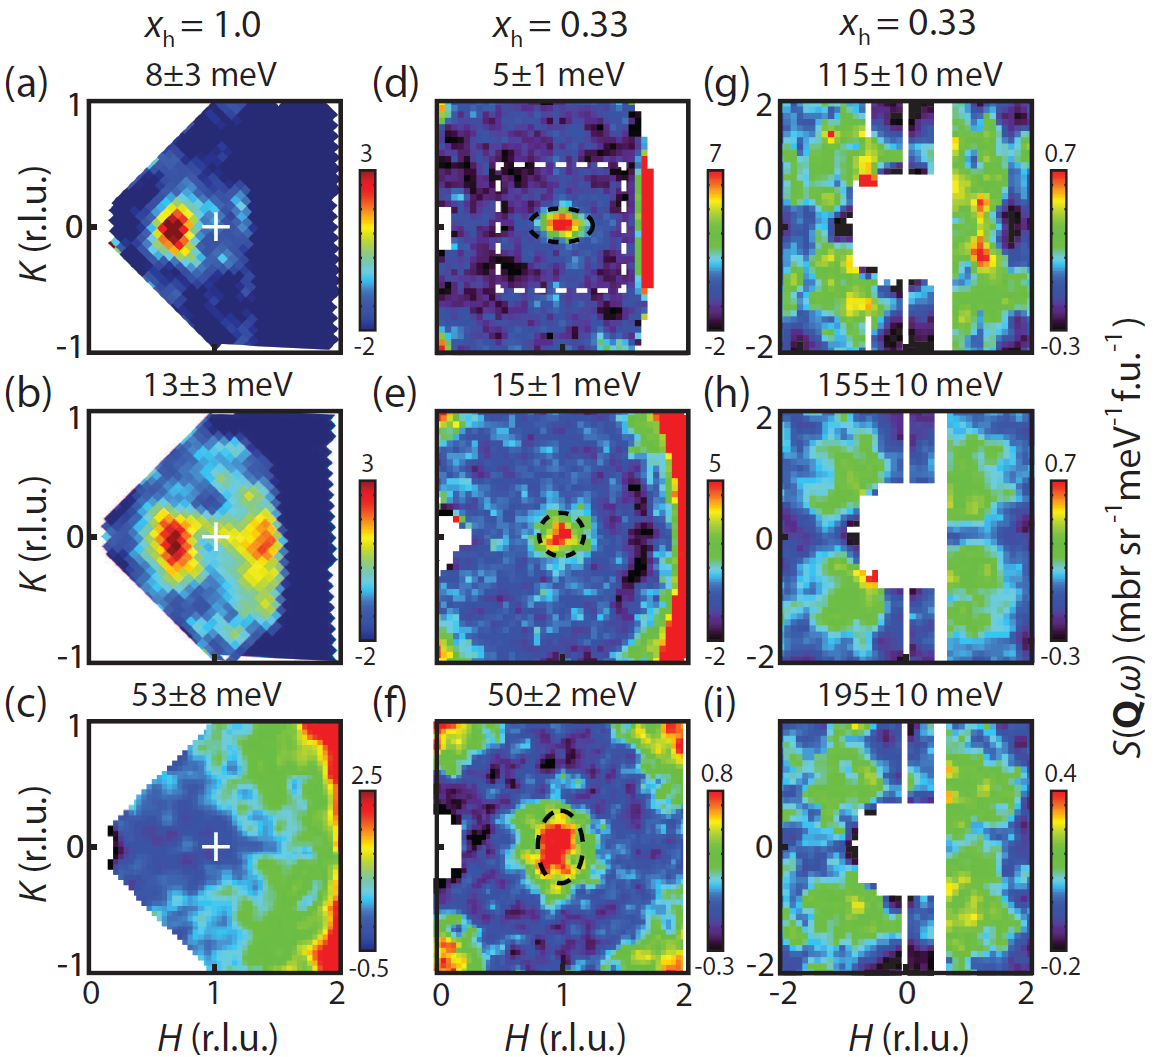
Figure 20 shows the constant-energy images of spin excitations as a function of hole-doping. For pure KFe2As2, incommensurate spin excitations along the longitudinal direction are seen at meV [Fig. 20(a)] and meV [Fig. 20(b)] Lee et al. (2011). However, spin excitations become much weaker at meV Wang et al. (2013b). For optimally hole-doped Ba0.67K0.33Fe2As2, the low-energy spin excitations change from longitudinally elongated ellipses at meV [Fig. 20(d)] to transversely elongated ellipses at meV [Fig. 20(f)]. At the neutron spin resonance energy of meV, spin excitations change from longitudinally elongated ellipses above (not shown) to isotropic circles below in reciprocal space [Fig. 20(e)]. For energies above 100 meV, spin excitations in hole-doped Ba0.67K0.33Fe2As2 [Figs. 20(g)-20(i)] behave similarly to those of electron-doped BaFe2-xNixAs2 (Fig. 19) Wang et al. (2013b).
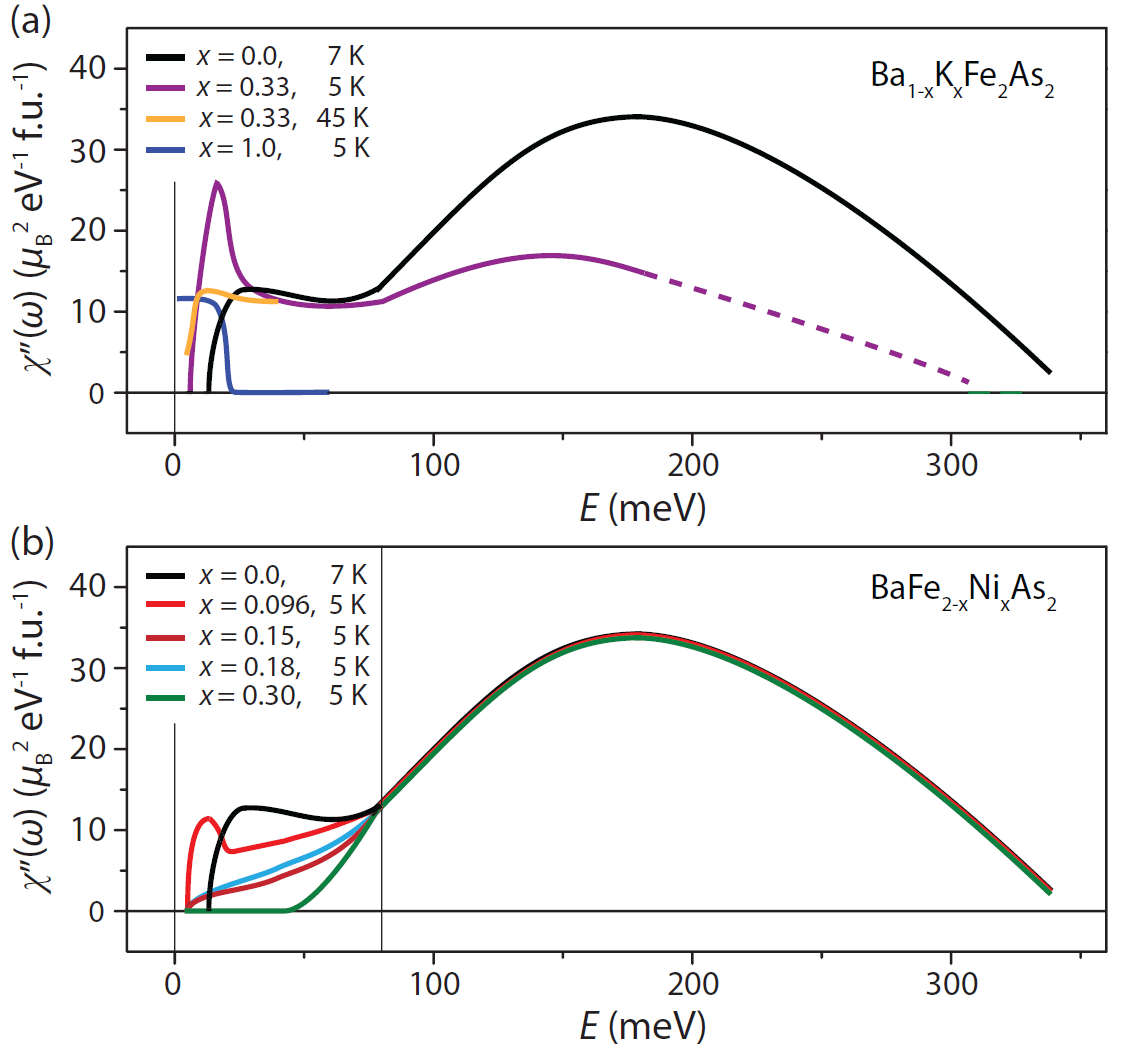
To quantitatively determine the electron and hole-doping evolution of the spin excitations in iron pnictides, one can estimate the energy dependence of the local dynamic susceptibility per formula unit Lester et al. (2010); Liu et al. (2012a). The dashed boxes in Figs. 19 and 20 show the integration region of the local dynamic susceptibility in reciprocal space. At low-energies, we only integrate the scattering within the white dashed box since it includes all magnetic responses in the Brillouin zone. Approaching to the zone boundary, we integrate the response within the purple dashed box in Fig. 19 as discussed in Section II A (Fig. 3). The energy dependence of the local dynamic susceptibility for hole and electron doped iron pnictides are plotted in Figs. 21(a) and 21(b), respectively. We see that the effect of hole-doping near optimal superconductivity is to suppress high-energy spin excitations and transfer spectral weight to low energies. The intensity changes across for hole-doped Ba0.67K0.33Fe2As2 are much larger than that of the electron-doped BaFe1.9Ni0.1As2 Liu et al. (2012a). As a function of increasing electron-doping, the local dynamic susceptibility at low energies decreases and finally vanishes for electron-overdoped nonsuperconducting BaFe1.7Ni0.3As2 Luo et al. (2013a); Wang et al. (2013b).
III.4 Evolution of spin excitations in iron chalcogenides and alkali iron selenides
Compared with iron pnictides, iron chalcogenide (Fe1+yTe1-xSex) superconductors have a different static AF ordered (bi-collinear instead of collinear) parent compound Fruchart et al. (1975); Bao et al. (2009); Li et al. (2009d), but a similar Fermi surface topology Subedi et al. (2008); Nakayama et al. (2010); Chen et al. (2010b). If the resonance originates from the hole and electron Fermi surface nesting, one would also expect a resonance at a wave vector similar to that of the iron pnictides. The neutron scattering experiments on FeTe0.6Se0.4 reveal that this is indeed the case Qiu et al. (2009); Mook et al. (2010); Babkevich et al. (2010). Figure 22(a) shows that the resonance energy is weakly temperature dependent and suddenly vanishes above Qiu et al. (2009); Harriger et al. (2012). Another interesting aspect of Fe1+yTe1-xSex is the presence of transverse incommensurate spin excitations at different energies [Figs. 22(b) and 22(c)] Lumsden et al. (2010); Lee et al. (2010); Argyriou et al. (2010); Li et al. (2010). Since the parent compound of iron chalcogenide superconductors has bi-collinear spin structure, the AF Bragg peaks and associated spin excitations in nonsuperconducting iron chalcogenides stem from wave vector positions rotated 45∘ from those of the resonance in reciprocal space. The enhancement of the resonance in superconducting Fe1+yTe1-xSex occurs at the expense of the spin excitations associated with the AF nonsuperconducting parent compound Xu et al. (2010); Liu et al. (2010); Chi et al. (2011).
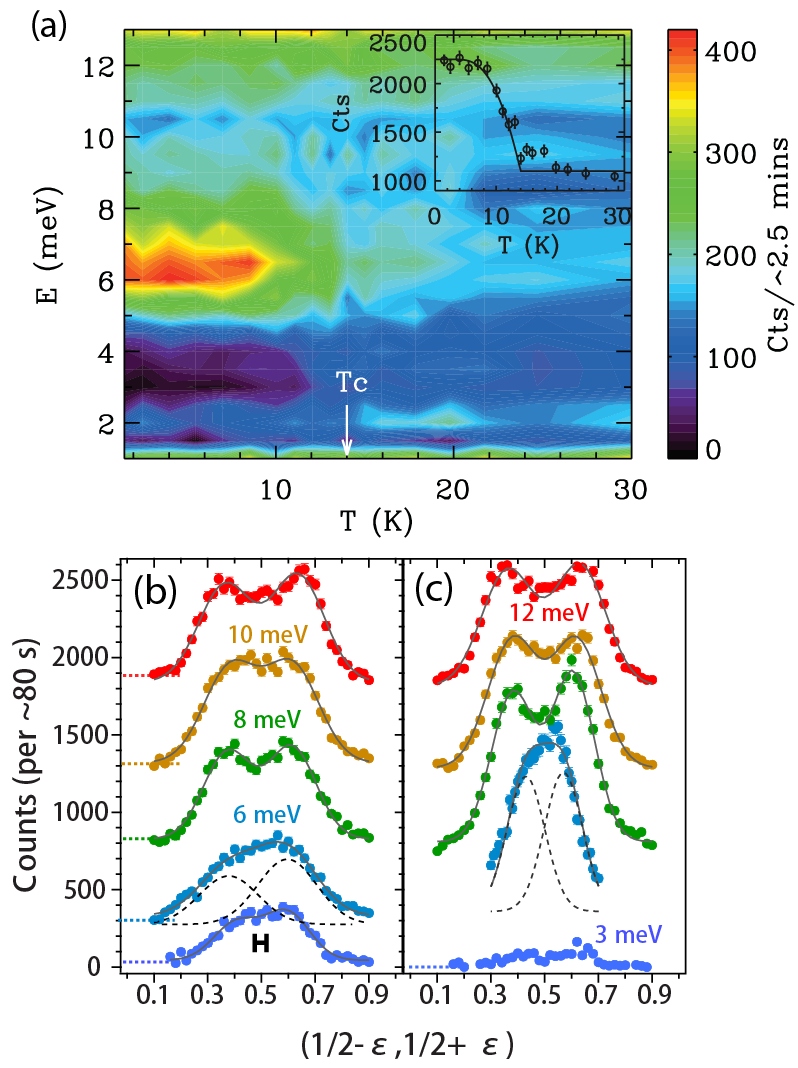
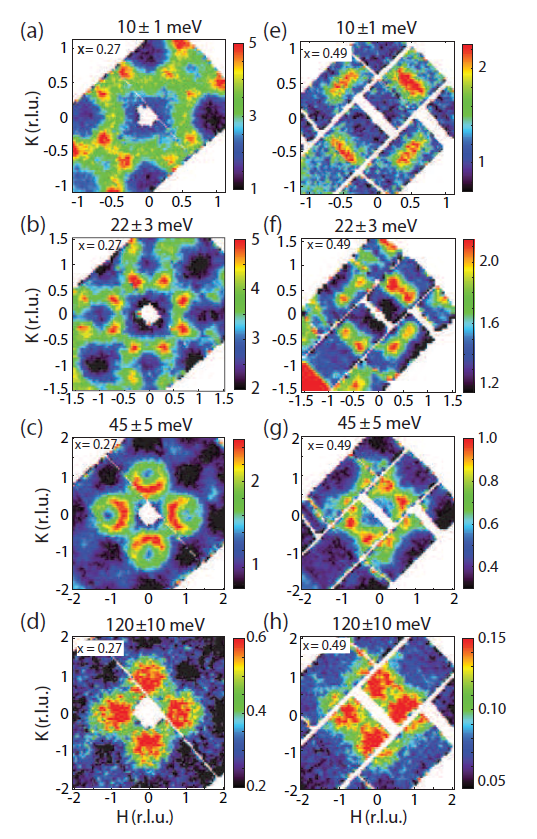
Figure 23 compares the wave vector dependence of spin excitations at different energies within the plane for nonsuperconducting Fe1+yTe0.73Se0.27 and superconducting Fe1+yTe0.51Se0.49 Lumsden et al. (2010). Using the tetragonal crystalline lattice unit cell, the reciprocal lattice units in Fe1+yTe1-xSex are rotated 45∘ from that for the AF ordered orthorhombic iron pnictides (Fig. 3). In this notation, spin waves from the bi-collinear AF ordered Fe1+yTe stem from in reciprocal space while the resonance occurs at Lumsden et al. (2010). For the nonsuperconducting Fe1+yTe0.73Se0.27, spin excitations at low energies (, meV) peak at transversely incommensurate positions from [Figs. 23(a) and 23(b)]. On increasing the energies to [Fig. 23(c)] and meV [Fig. 23(d)], spin excitations become fourfold symmetric and move to positions near and Lumsden et al. (2010). For superconducting Fe1+yTe0.51Se0.49, the transverse incommensurate spin excitations in the nonsuperconducting sample at and meV are replaced by the resonance and transversely elongated spin excitations near [Figs. 23(e) and 23(f)]. Spin excitations at [Fig. 23(g)] and meV [Fig. 23(h)] are not greatly affected by superconductivity. These results are similar to spin excitations in electron-doped iron pnictides Liu et al. (2012a), suggesting that superconductivity in iron chalcogenides only affects low-energy spin excitations and has commensurate spin excitations consistent with the hole and electron Fermi surface nesting Liu et al. (2010); Chi et al. (2011).
In iron pnictide and iron chalcogenide superconductors, the neutron spin resonance is believed to arise from quasiparticle excitations between the hole and electron Fermi pockets near the and points, respectively Mazin (2010); Hirschfeld et al. (2011). Since alkali iron selenide superconductors Fe2-ySe2 Guo et al. (2010); Fang et al. (2011) do not have hole pockets near the Fermi energy Qian et al. (2011); Mou et al. (2011); Zhang et al. (2011b), it is important to determine if the system also has a resonance arising from quasiparticle excitations between the two electron-like Fermi pockets near the and positions in reciprocal space Maier et al. (2011). From the earlier work on copper oxide superconductors, it is generally believed that the resonance arises from sign reversed quasiparticle excitations between two different parts of the Fermi surfaces Eschrig (2006). As there are no hole Fermi surfaces in superconducting Fe2-ySe2, a determination of the location of the resonance in reciprocal space will directly test the prediction from the RPA and weak coupling calculation concerning the nature of the superconducting pairing interaction Maier et al. (2011). If a resonance is seen approximately at a wave vector connecting the two electron Fermi pockets, one would expect a sign change between the two Fermi pockets reminiscent of the -wave pairing symmetry state of the copper oxide superconductors Maier et al. (2011); Wang et al. (2011a); Das and Balatsky (2011).
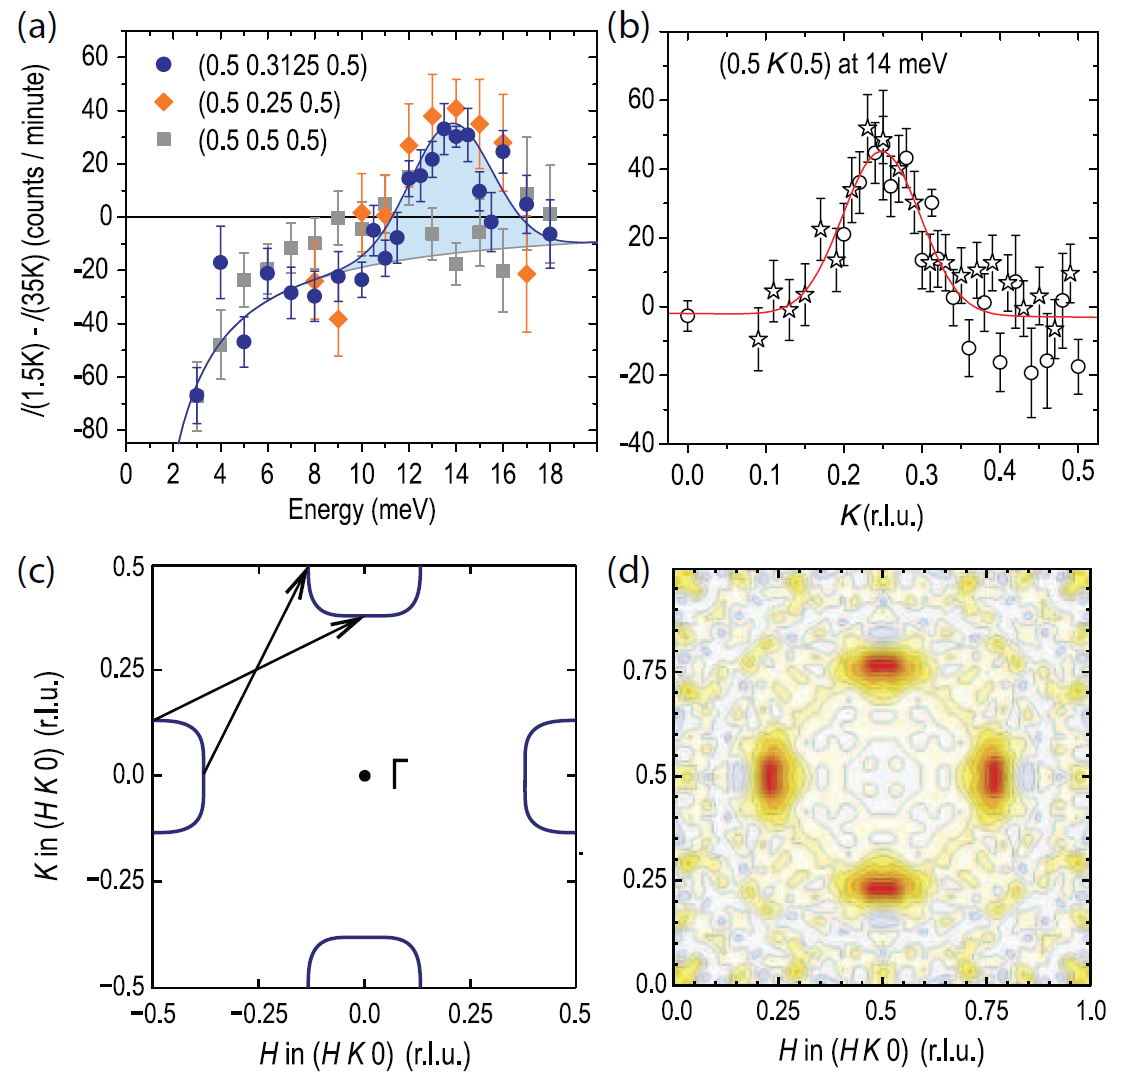
Experimentally, a neutron spin resonance has been observed at an energy of meV in the superconducting Rb2Fe4Se5 with K [Fig. 24(a)] Park et al. (2011b). A complete mapping of the reciprocal space within the scattering plane of the system reveals that the mode occurs near the wave vector in the tetragonal unit cell notation Friemel et al. (2012b). Figure 24(a) and 24(b) plots the temperature difference between 1.5 K() and 35 K() showing the superconductivity-induced resonance in energy and wave vector scans, respectively. Figure 24(c) shows the Fermi surfaces in the plane corresponding to the doping level of 0.18 electrons/Fe. The arrows are the in-plane nesting wave vectors consistent with the resonance Friemel et al. (2012b). Figure 24(d) plots the difference of the RPA calculated dynamic susceptibility between the superconducting and normal states at the resonance energy Friemel et al. (2012b). The calculated results are in qualitatively agreement with the neutron scattering experiments, thus suggesting that the mode arises from quasiparticle excitations between the electron pockets Friemel et al. (2012b, a). Subsequent neutron scattering experiments on superconducting Rb0.82Fe1.68Se2 ( K) Wang et al. (2012b) and CsxFe2−ySe2 Taylor et al. (2012) also found the resonance at wave vector positions connecting the two electron Fermi surfaces, thus confirming this is a general feature of the superconducting alkali iron selenides. Although the resonance mode energy in molecular-intercalated FeSe superconductors Ying et al. (2012); Burrard-Lucas et al. (2013); Krzton-Maziopa et al. (2012) approximately follows consistent with other iron-based superconductors Inosov et al. (2011), its wave vector is better matched to those of the superconducting component of Fe2-ySe2 Taylor et al. (2013).
III.5 Impurity effect on spin excitations of iron pnictide and chalcogenide superconductors
As described in the earlier sections, low-energy spin excitations in high- copper oxide and iron-based superconductors are coupled to superconductivity via the opening of a spin gap and re-distributing the weight to a neutron spin resonance, both at the AF ordering wave vector of their parent compounds Eschrig (2006). Since superconductivity in high- superconductors can be altered rather dramatically with impurity doping, it is important to determine the effect of impurities on spin excitations. In the case of the copper oxide superconductors, the resonance and low-energy spin excitations respond to magnetic and nonmagnetic impurity doping differently Sidis et al. (2000). When magnetic impurities such as Ni are doped into optimally superconducting YBa2Cu2O7, the resonance peak shifts to lower energy with a preserved energy-to- ratio Sidis et al. (2000). In contrast, nonmagnetic impurity Zn doping to YBa2Cu2O7 restores normal state spin excitations but hardly changes the energy of the resonance Sidis et al. (2000). Similar Zn-substitution in the underdoped YBa2Cu2O6.6 induces static magnetic order at low temperatures and triggers a spectral-weight redistribution from the resonance to the low-energy incommensurate spin excitations Suchaneck et al. (2010).
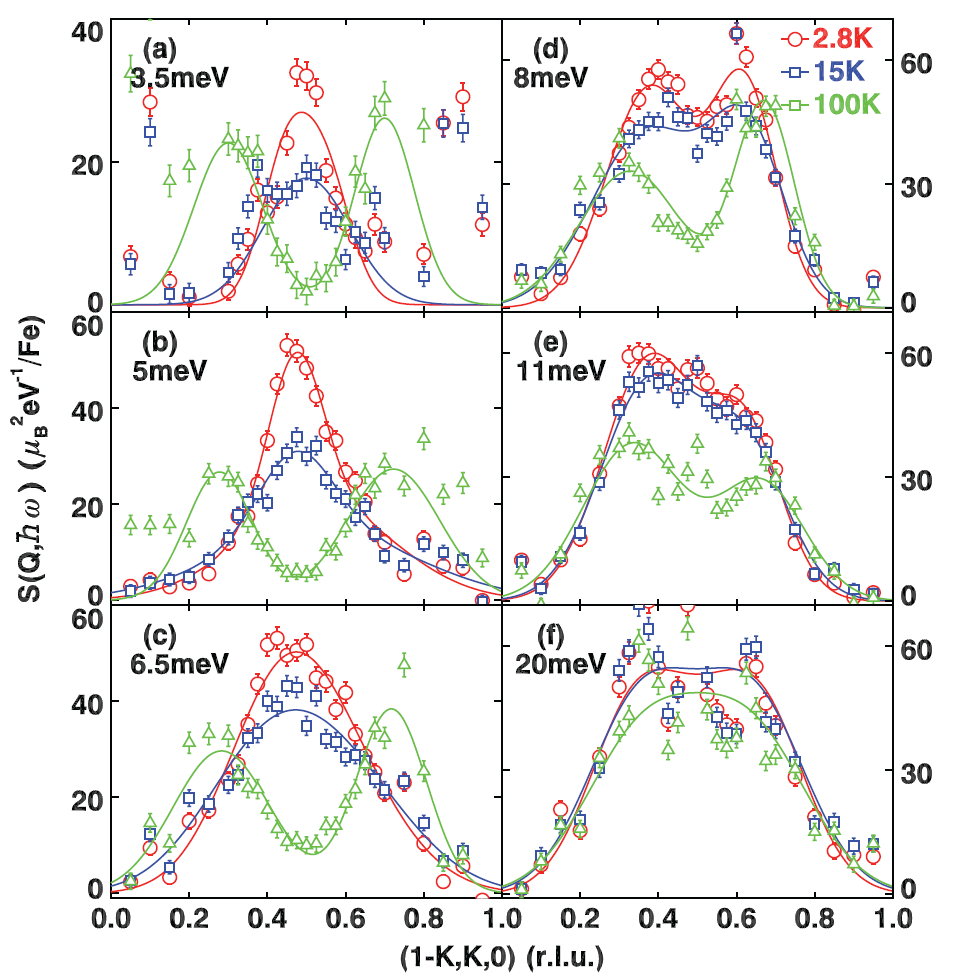
To see the impurity effect on the resonance and low-energy spin excitations in iron-based superconductors, inelastic neutron scattering experiments were carried out on Ni and Cu-doped superconducting Fe1+yTe0.5Se0.5 Xu et al. (2012). Figure 25 shows the temperature dependence of the spin excitations at different energies for Fe1+y-0.04Ni0.04Te0.5Se0.5 Xu et al. (2012). In addition to reducing the energy of the resonance, the spin excitations at [Fig. 25(a)], 5 [Fig. 25(b)], and 6.5 meV [Fig. 25(c)] change from commensurate below to transversely incommensurate around 100 K. Wave vector scans at [Fig. 25(d)], 11 [Fig. 25(e)], and 20 meV [Fig. 25(f)] have similar lineshapes on warming from 2.8 K to 100 K. Such a dramatic spectral reconstruction for temperatures up to is not seen in copper oxide and iron pnictide superconductors, and may indicate the presence of strong electron correlations in iron chalcogenide superconductors Xu et al. (2012). In subsequent transport and neutron scattering experiments on Cu-doped Fe0.98-zCuzTe0.5Se0.5 with , and 0.1 Wen et al. (2013), a metal-insulator transition was found for . In addition, low-energy spin excitations of the system are enhanced with increasing Cu-doping. These results suggest that the localization of the conducting states and electron correlations induced by the Cu-doping may play an important role Wen et al. (2013).
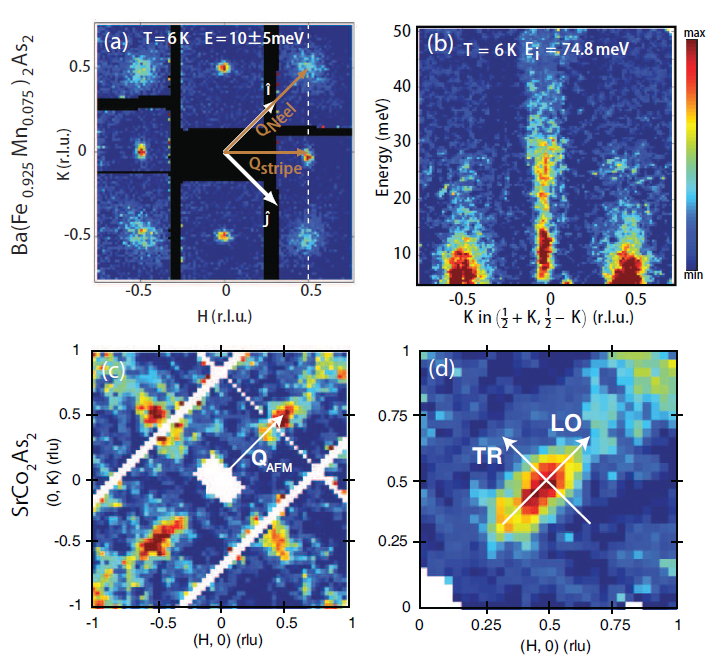
While it is well known that hole-doping via K substitution for Ba in BaFe2As2 induces high- superconductivity Rotter et al. (2008a), substitution of Mn and Cr for Fe in BaFe2As2 never induces superconductivity Thaler et al. (2011); Sefat et al. (2009). In the case of Cr-doping, the system adopts a checkerboard -type AF structure for Ba(Fe1−xCrx)2As2 with [Fig. 6(a)] Marty et al. (2011). How spin excitations in the parent compound BaFe2As2 are modified by Cr-doping is unclear. On the other hand, Mn-doped BaFe2As2 represents a more complicated situation: while BaMn2As2 forms a simple AF structure with the ordered moment along the axis Singh et al. (2009), Mn-doping of BaFe2As2 may induce a Griffiths regime associated with the suppression of the collinear AF order in BaFe2As2 by the randomly introduced localized Mn moments acting as strong magnetic impurities Inosov et al. (2013). Inelastic neutron scattering experiments were carried out on single crystals of Ba(Fe1-xMnx)2As2 with , which has a tetragonal-to-orthorhombic lattice distortion and orders into a collinear AF structure simultaneously below K Tucker et al. (2012b). Figure 26(a) shows spin excitations of the system measured with the crystallographic axis parallel to the incident neutron beam at meV. In addition to spin excitations associated with the collinear AF structure denoted as , there are excitations at the AF wave vector positions of BaMn2As2 () Tucker et al. (2012b). At present, it is unclear if this is an intrinsic effect of the system or there is real space phase separation between Mn and Fe. Figure 26(b) shows energy dependence of the scattering at and . While spin excitations at extend well above 50 meV, they are limited to below 30 meV at [Fig. 26(b)].
In the study of electron-doping evolution of the spin excitations in iron pnictides, it was found that electron-doping via Co or Ni substitution for Fe in BaFe2As2 induces transversely elongated spin excitations near due to the mismatched hole and electron Fermi surfaces (Figs. 15 and 16) Zhang et al. (2010). If this scenario is correct for all electron-doping levels, one would expect transversely elongated spin excitations in heavily Co-doped BaFe2As2 or SrFe2As2. Figure 26(c) and 26(d) shows wave vector dependence of spin excitations in SrCo2As2 Jayasekara et al. (2013). Although spin excitations still appear at the same wave vector positions as those of BaFe2As2, they are longitudinally elongated. As SrCo2As2 may have complicated Fermi surfaces like that of BaCo2As2 Xu et al. (2013b), Fermi surface nesting could potentially explain the line-shape of the spin excitations. It will be interesting to sort out how spin excitations evolve from transversely elongated to longitudinally elongated in reciprocal space as a function of Co-doping for BaFe2-xCoxAs2 and SrFe2-xCoxAs2.
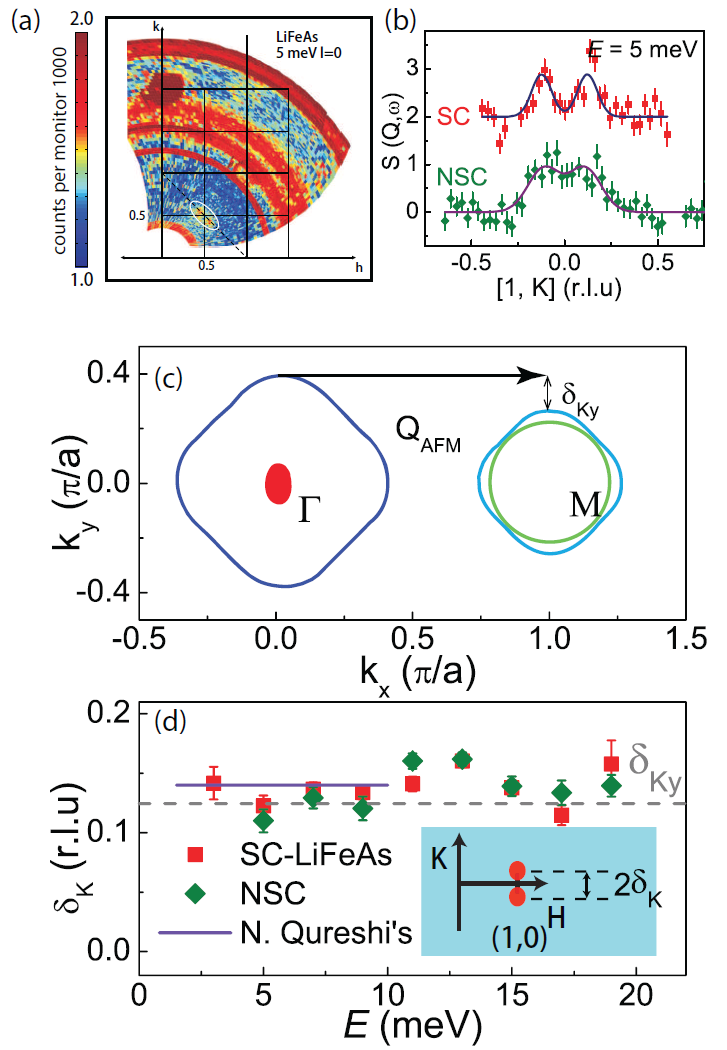
Another iron pnictide worthy of mention is LiFeAs Wang et al. (2008); Tapp et al. (2008); Pitcher et al. (2008). Although this material has the same crystal structure as that of NaFeAs [Fig. 1(d)], it is a superconductor without static AF order in stoichiometric LiFeAs and Li deficiency tends to suppress superconductivity. Initial inelastic neutron scattering measurements on powder samples indicate the presence of superconductivity-induced resonance near the usual AF ordering wave vector Taylor et al. (2011). Subsequent neutron scattering experiments on single crystals showed that spin excitations in this system are transversely incommensurate away from the for both the superconducting LiFeAs [Fig. 27(a)] Qureshi et al. (2012a) and nonsuperconducting Li1-xFeAs [Fig. 27(b)] Wang et al. (2012a). The absence of the static AF order has been interpreted as due to poor Fermi surface nesting between and consistent with ARPES measurements [Fig. 27(c)] Brydon et al. (2011); Borisenko et al. (2010). However, the quasiparticle scattering between the hole pockets near and electron pocket should give rise to transverse incommensurate spin fluctuations and this is indeed the case [Fig. 27(a)] Qureshi et al. (2012a); Wang et al. (2012a); Qureshi et al. (2014b). Furthermore, the incommensurate spin excitations are weakly energy dependent and only broaden slightly for nonsuperconducting Li1-xFeAs [Fig. 27(d)] Wang et al. (2012a). These results suggest that spin excitations in LiFeAs have the same origin as other iron pnictides, and the low-energy spin excitations in the system follow the nested Fermi surface scenario.
III.6 Neutron polarization analysis of spin excitation anisotropy in iron pnictides
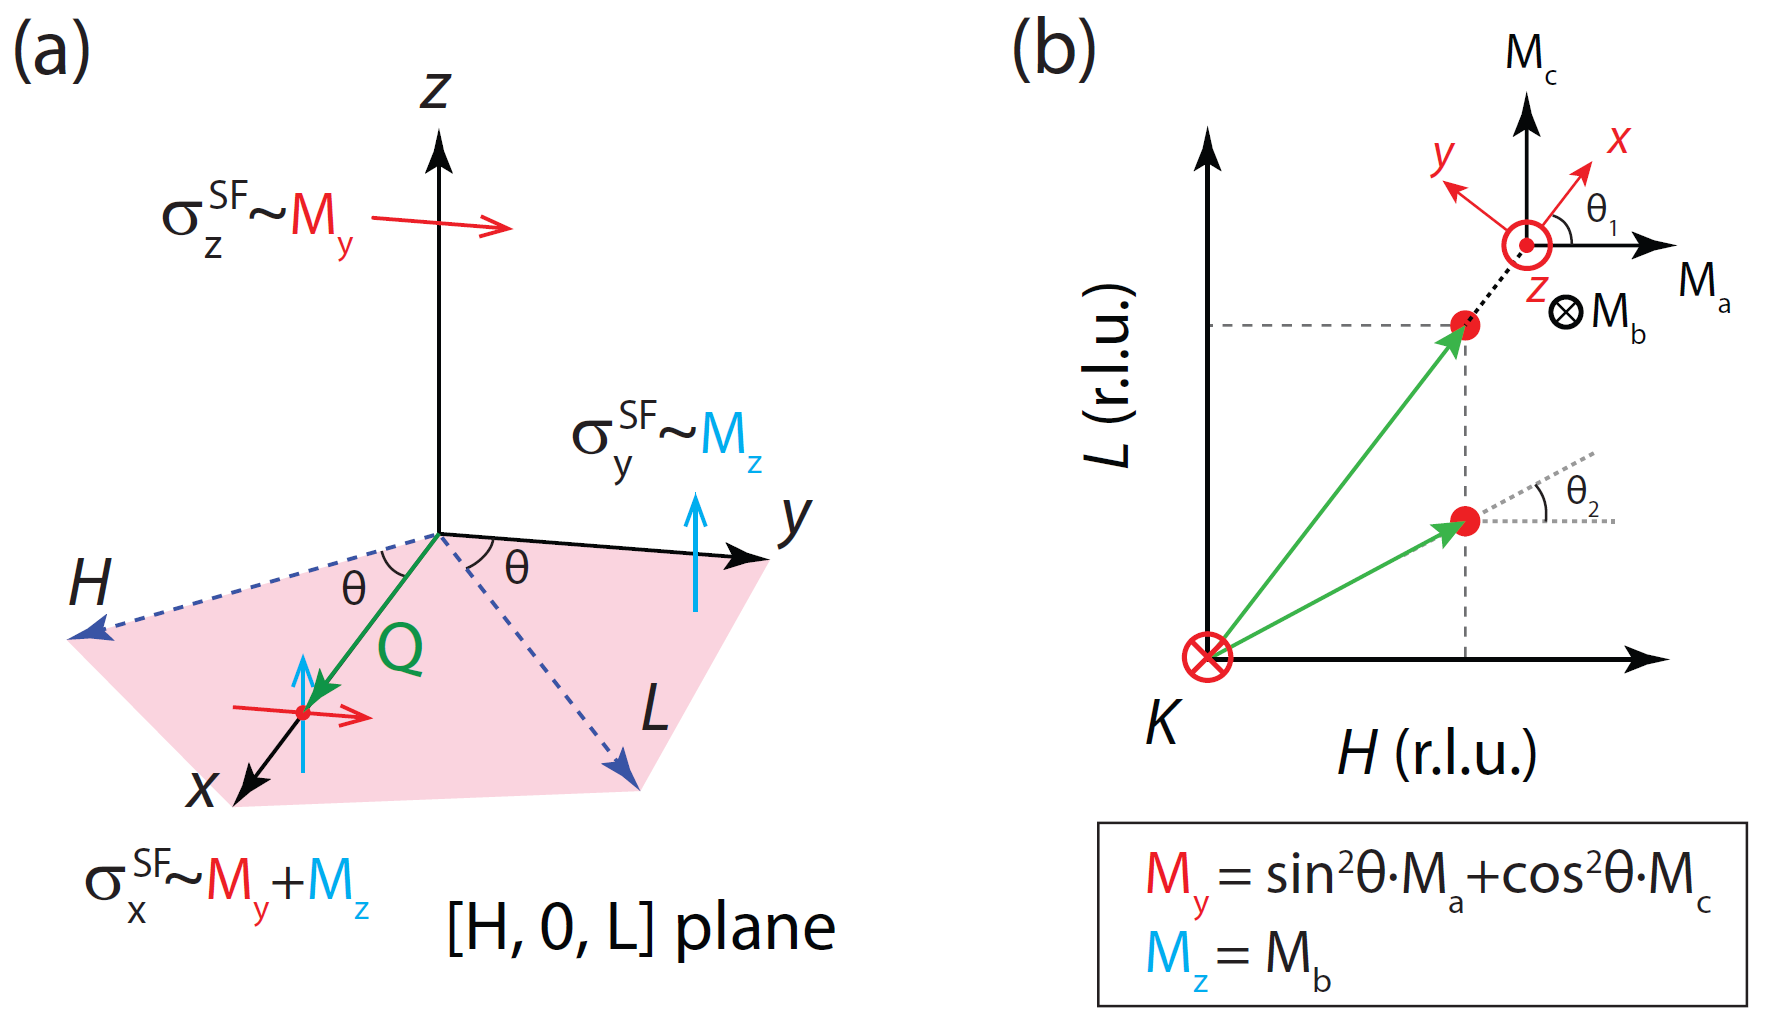
Although most neutron scattering experiments are carried out with unpolarized neutrons, neutron polarization analysis can provide some unique information concerning the nature of the ordered moment and the anisotropy of spin excitations. The neutron polarization analysis was first developed at Oak Ridge National Laboratory in the pioneering work of Moon, Riste, and Koehler Moon et al. (1969). This technique was used to unambiguously identify the magnetic nature of the neutron spin resonance in optimally doped high- copper oxide YBa2Cu3O7 Mook et al. (1993). In modern polarized neutron scattering experiments on high- superconductors at the Institut Laue-Langevin, the Cryopad capability Leliévre-Berna et al. (2005) is typically used to ensure that the sample is in a strictly zero magnetic field environment, thus avoiding errors due to flux inclusion and field expulsion in the superconducting phase of the sample Lester et al. (2010). The Cryopad device can also be used for neutron polarimetry in which an arbitrary incident and scattered neutron beam polarization can be measured Leliévre-Berna et al. (2005).
Polarized neutrons were produced using a focusing Heusler monochromator and analyzed using a focusing Heusler analyzer. Polarization analysis can be used to separate magnetic (e.g. spin excitations) and nuclear (e.g. phonon) scattering because the former has a tendency to flip the spin of the neutron, whereas the latter leaves the neutron spin unchanged. More specifically, the spin of the neutron is always flipped in a magnetic interaction where the neutron polarization is parallel to the wave vector transfer and the magnetic moment or excitation polarization in the sample is transverse to . We therefore describe the neutron polarization in a coordinate system where is parallel to . For convenience, we then define the other orthogonal directions with in the scattering plane, and out of plane [see Fig. 28(a)]. There are then six independent channels in which the instrument can be configured at a specific wave vector and energy point: three neutron polarization directions , , , each of which can be measured to detect neutrons that flip or do not flip their spins when scattering at the sample. The measured neutron cross-sections are labeled by the experimental configuration in which they were measured, and are written , , where is the neutron polarization direction (, or ) and the superscript represents either spin-flip (SF) or non-spin flip (NSF) scattering.
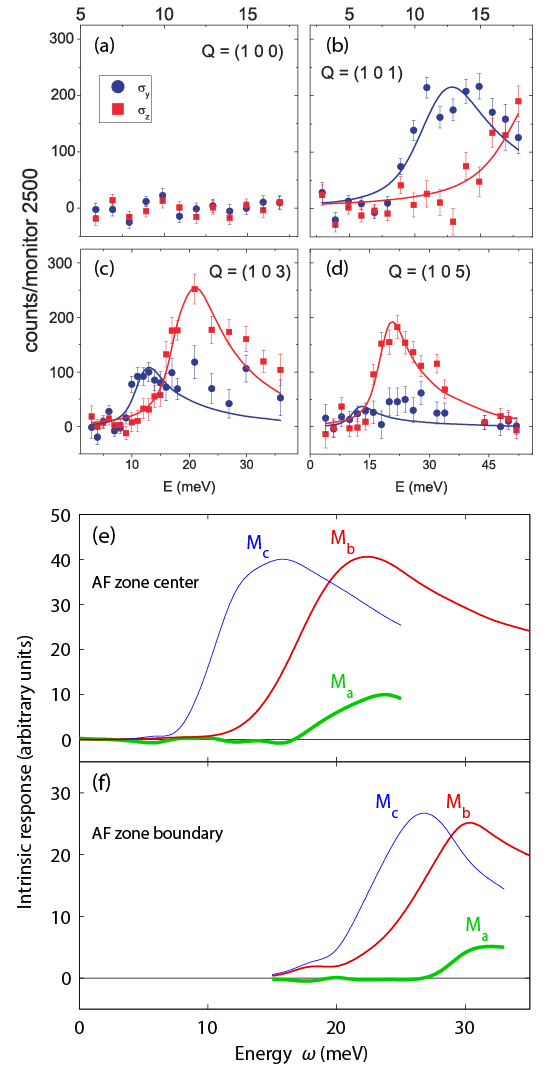
Magnetic neutron scattering only probes the magnetic moment perpendicular to . The cross-sections can therefore be written in terms of and [see Fig. 28(a)], the two spatial components (perpendicular to ) of the spin direction of the magnetic excitations, and the nuclear scattering strength . However, a measured cross-section component on an imperfect instrument contains a leakage between SF and NSF channels due to imperfect neutron polarization. This leakage can be quantified by measuring the nuclear Bragg peak contamination into the spin flip channel, the “instrumental flipping ratio” (for an unpolarized neutron scattering experiment =1, and in an ideal polarized neutron scattering experiment). The measured cross-section components can then be written Moon et al. (1969); Lipscombe et al. (2010)
| (1) |
where B is a background term to take account of instrumental background and the non-magnetic nuclear incoherent scattering from the sample, which is assumed to be equal in all six cross-sections when measured at the same wave vector and energy. NSI is the nuclear spin incoherent scattering caused by moments within the nuclei of the isotopes in the sample. NSI is independent of and typically is negligible in magnitude compared with the nuclear coherent cross-section . Furthermore, in the case where only SF (or only NSF) cross-section components are collected, NSI would be absorbed into the B term.
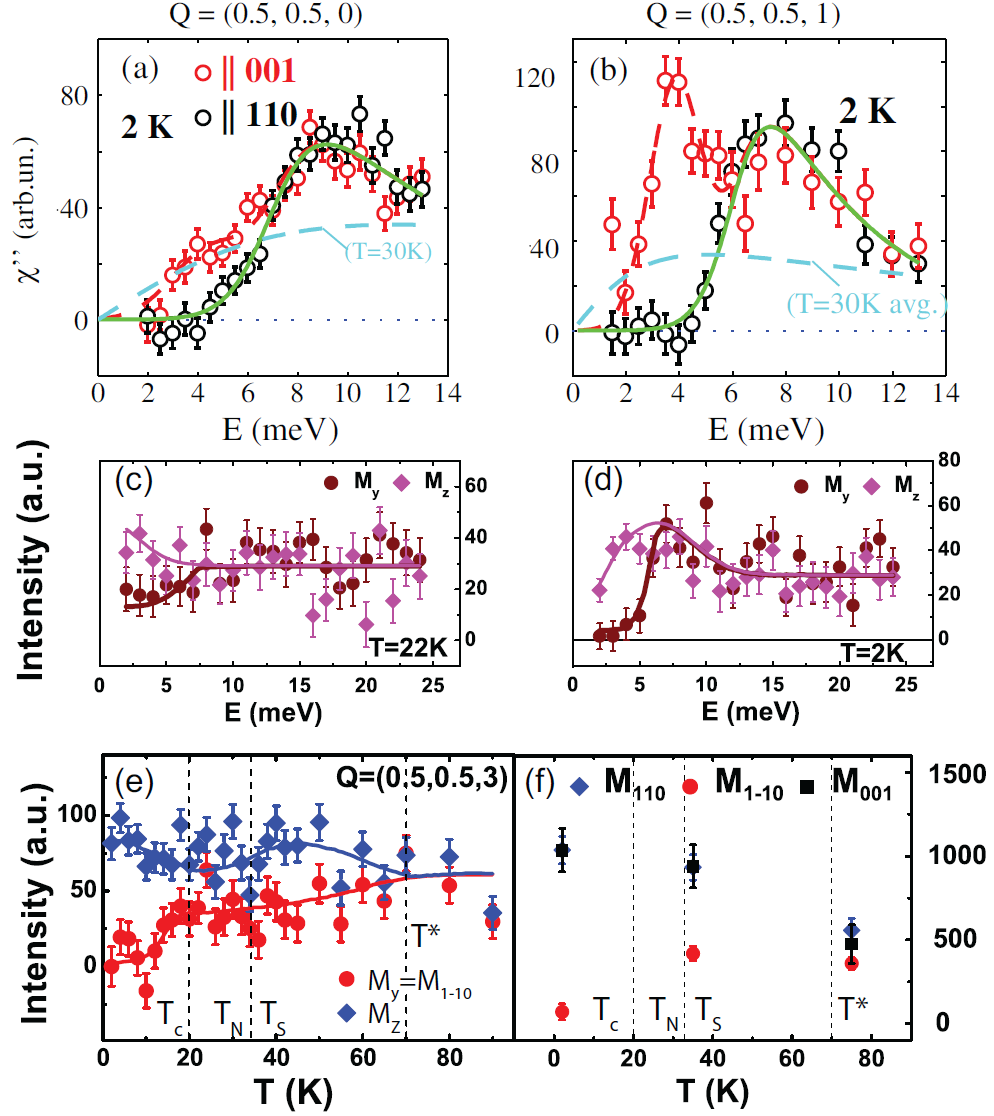
For SF neutron scattering measurements at , one can conclusively determine the magnetic components and . If the magnetic components of the system along the , , and are , , and , respectively, we would have and if the sample is aligned in the scattering plane, where , , and are magnitudes of spin excitations along the orthorhombic , , and -axis directions of the lattice, respectively, and is the angle between and -axis [Fig. 28(b)] Lipscombe et al. (2010). Since there are three unknowns () and only two equations with known and , one can only determine the values of , , and by measuring at least two equivalent reciprocal lattice vectors with different angle as illustrated in Fig. 28(b). In the initial polarized neutron scattering experiments on optimally electron-doped superconducting BaFe1.9Ni0.1As2, spin excitation anisotropy near the resonance energy was observed Lipscombe et al. (2010). Similar results were also found for the resonance in optimal superconducting Fe(Se,Te) Babkevich et al. (2011). For electron-overdoped BaFe1.85Ni0.15As2, the resonance and spin excitations at all energies probed are isotropic with Liu et al. (2012b).
Figure 29 summarizes the outcome from polarized neutron scattering experiments on BaFe2As2. From unpolarized neutron scattering experiments, it is well known that spin waves in the AF ordered state are gapped below about 15 meV at the magnetic Brillouin zone center Matan et al. (2009); Park et al. (2012). Figure 29(a)-29(d) shows neutron SF inelastic constant- scans at the zone center for different values and at . The blue dots represent the magnitude of magnetic scattering along the axis direction, or , while red squares depict , where Qureshi et al. (2012b). Consistent with unpolarized measurements Matan et al. (2009); Park et al. (2012), there are large spin gaps at and . However, the gap value for is significantly larger than that for [Figs. 29(b)-29(d)]. These results indicate strong single-iron anisotropy within the layer, suggesting that it costs more energy to rotate a spin within the orthorhombic - plane than to rotate it perpendicular to the FeAs layers Qureshi et al. (2012b). In addition, there is no evidence for longitudinal spin fluctuations typically associated with itinerant electrons and nested Fermi surfaces like in the spin-density-wave state of pure chromium metal Fawcett et al. (1994); Qureshi et al. (2012b).
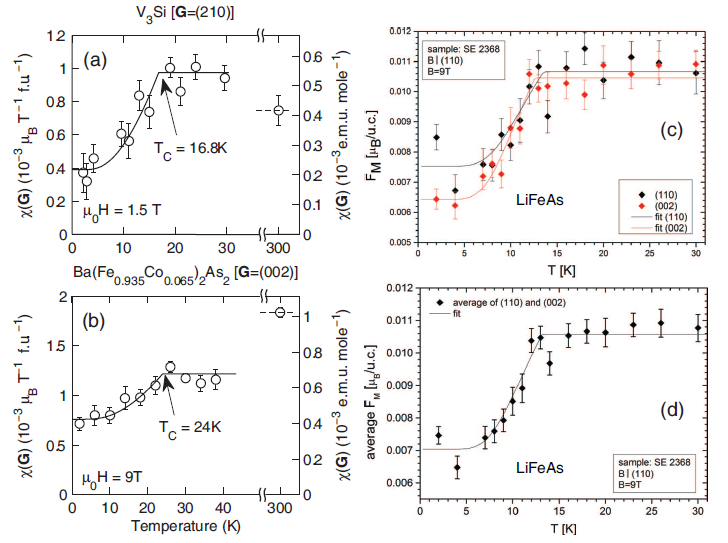
In subsequent polarized neutron scattering experiments on BaFe2As2 with greater sample mass Wang et al. (2013a), three distinct spin-excitation components, , , and , with magnetic moments fluctuating along the three crystallographic axes are identified at the AF Brillouin zone center [Fig. 29(e)] and zone boundary [Fig. 29(f)]. The data reveals the presence of finite at the AF zone center for energies above 20 meV [Fig. 29(e)]. Similar measurements at the AF zone boundary suggest nonzero values of above 30 meV [Fig. 28(f)]. While and , the two transverse components of spin waves, can be described by a linear spin-wave theory with magnetic anisotropy and inter-layer coupling, the presence of , the longitudinal component of spin waves, is generically incompatible with transverse spin waves at low- from a local-moment Heisenberg Hamiltonian. These results suggest a contribution of itinerant electrons to the magnetism that is already in the parent compound of this family of Fe-based superconductors. This means that one cannot account for spin waves in the parents of iron pnictides with a purely local moment picture, and must take the contribution from itinerant electrons into account to understand the magnetism in these materials Wang et al. (2013a).
In a polarized inelastic neutron scattering experiment on optimally electron-doped BaFe1.88Co0.12 ( K), two resonance-like excitations were found in the superconducting state Steffens et al. (2013). While the high-energy mode occurring at meV is an isotropic resonance with weak dispersion along the axis, there is a 4 meV spin excitation that appears only in the axis polarized channel and whose intensity modulates along the axis similar to spin waves in the undoped BaFe2As2 [Fig. 30(a) and 30(b)]. These results suggest that spin excitations in undoped and optimally electron doped BaFe2As2 have similar features, different from what one might expect for superconducting and AF phases of iron pnictides Steffens et al. (2013).
In a separate polarized inelastic neutron scattering experiment on electron underdoped BaFe1.904Ni0.096As2, where the system exhibits an AF order and tetragonal-to-orthorhombic lattice distortion temperatures near K, and superconductivity below K, neutron SF cross sections have been measured at various energies and wave vectors. Figure 30(c) and 30(d) shows energy dependence of and in the normal and superconducting states at the AF wave vector Luo et al. (2013b). In addition to confirming that the low-energy spin excitations are highly anisotropic below 5 meV in the superconducting state [Fig. 30(d)], the magnetic scattering appears to be anisotropic in the normal state with [Fig. 30(c)]. Figure 30(e) shows that the magnitudes of and become different below , illustrating that the magnetic anisotropy first appears below the temperature where transport measurements on uniaxial strain detwinned samples display in-plane resistivity anisotropy Chu et al. (2010); Tanatar et al. (2010); Fisher et al. (2011). To quantitatively determine if the spin excitation anisotropy is indeed within the - plane, neutron SF cross sections were measured at multiple equivalent wave vectors. The outcome suggests that the presence of in-plane spin excitation anisotropy is associated with resistivity anisotropy in strain-induced sample [Fig. 30(f)]. Therefore, spin excitation anisotropy in iron pnictides is a direct probe of the spin-orbit coupling in these materials Luo et al. (2013b). Recent polarized inelastic neutron scattering experiments on superconducting Ba0.67K0.33Fe2As2 Zhang et al. (2013b) and Ba0.5K0.5Fe2As2 Qureshi et al. (2014a) reveal that the low-energy spin excitation anisotropy persists to hole overdoped iron pnictides far away from the AF ordered phase. Similar polarized neutron scattering experiments on underdoped NaFe0.985Co0.015As with double resonances [Fig. 17(c)] suggest that the first resonance is highly anisotropic and polarized along the and axes, while the second mode is isotropic similar to that of electron overdoped NaFe0.935Co0.045As. Since the axis polarized spin excitations of the first resonance appear below , the itinerant electrons contributing to the magnetism may also be coupled to the superconductivity Zhang et al. (2014b).
Polarized neutron scattering is not only useful for determining the spin excitation anisotropy, it can also be used to to measure the susceptibility and induced magnetization in the normal and superconducting states of a superconductor. The technique of using polarized neutron diffraction to study the magnetization of the paramagnetic crystal by an externally applied magnetic field was developed by Shull and Wedgewood in their study of electron spin pairing of a BCS superconductor V3Si Shull and Wedgewood (1966). Instead of the full neutron polarization analysis as described above, the magnetization measurements are performed under a magnetic field using a polarized incident beam of neutrons Brown et al. (2010); Lester et al. (2011). The flipping ratio , defined as the ratio of the neutron scattering cross sections with neutrons parallel and antiparallel to the applied magnetic field, is associated with the nuclear structure factors and the Fourier transform of the real-space magnetization density via , where m and is the reciprocal lattice vector Lester et al. (2011). In a conventional BCS superconductor such as V3Si, where electrons below form singlet Cooper pairs, the temperature dependence of the field induced magnetization shows the characteristic Yosida drop below expected for singlet pairing [Fig. 31(a)] Shull and Wedgewood (1966). For a spin-triplet superconductor such as Sr2RuO4 Mackenzie and Maeno (2003), there are no change in the field induced magnetization across Duffy et al. (2000). The temperature dependence of the field-induced magnetization shows a clear drop below in nearly optimally electron-doped BaFe1.87Co0.13As2 [Fig. 31(b)] Lester et al. (2011), consistent with measurements of the NMR Knight shift in the same compound Ning et al. (2008); Oh et al. (2011). The large residual contribution of the field induced magnetization below seen in both V3Si Shull and Wedgewood (1966) and BaFe1.87Co0.13As2 Lester et al. (2011) has been attributed to the van Vleck or orbital contribution to the susceptibility.
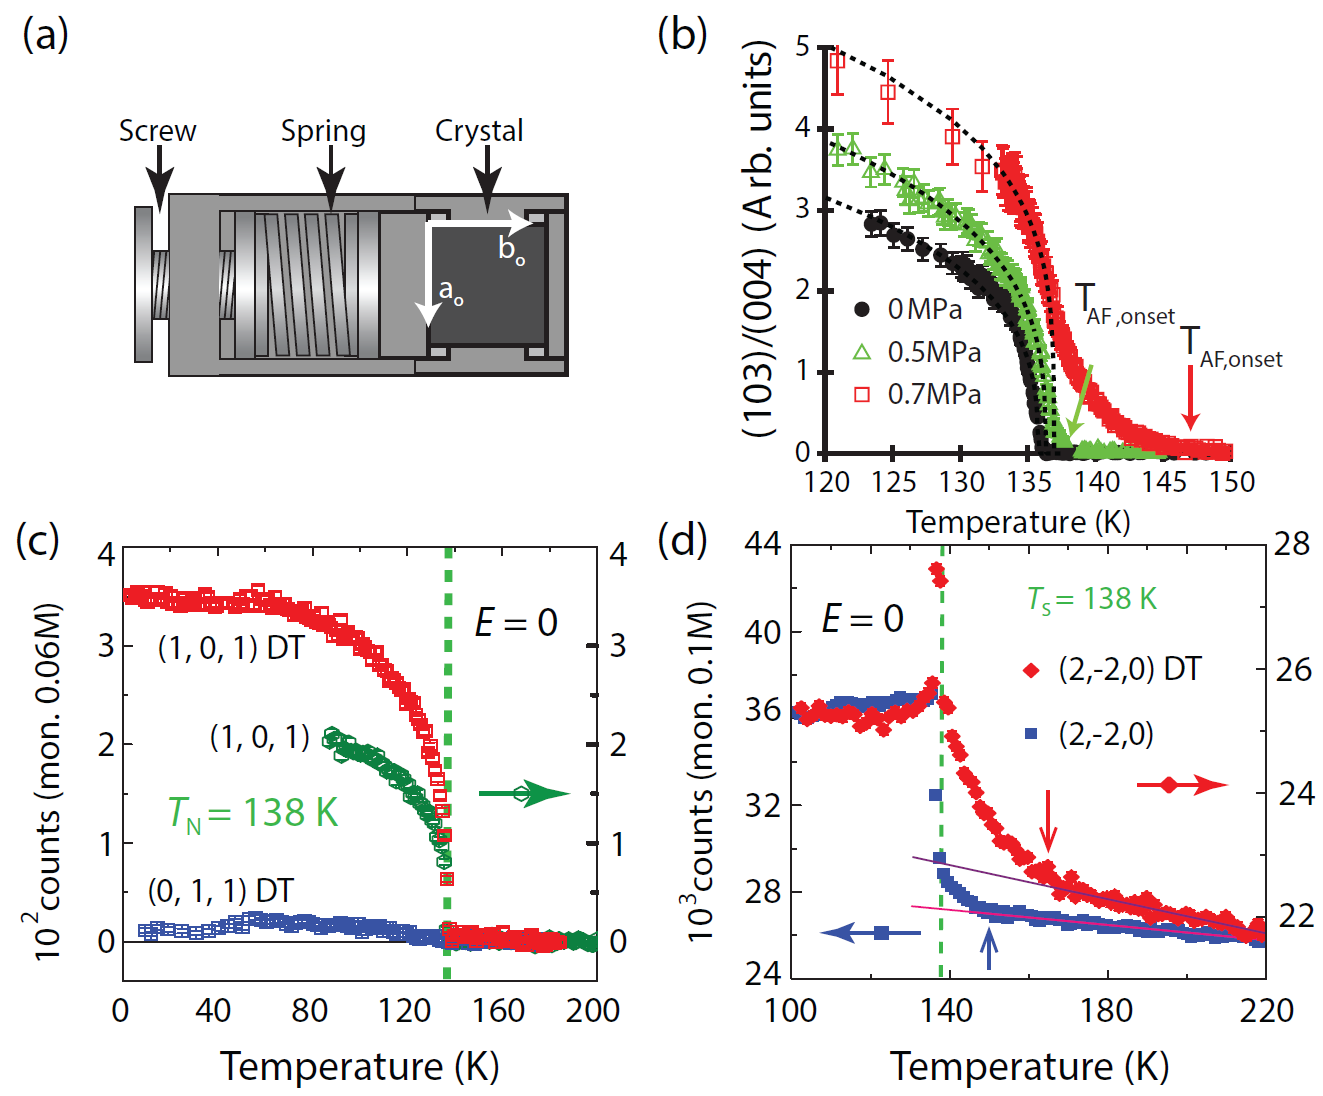
Similar polarized neutron diffraction experiments have also been carried out on superconducting LiFeAs Brand et al. (2014), which does not have a static AF ordered parent compound Tapp et al. (2008); Wang et al. (2008); Pitcher et al. (2008) and may have triplet electron pairing due to a large density of states near the Fermi level favoring a ferromagnetic instability Brydon et al. (2011). Figure 31(c) shows temperature dependence of the field-induced magnetization at wave vectors and . The average of the and is shown in Fig. 31(d). Different from the spin triplet superconductor Sr2RuO4 Duffy et al. (2000), the field-induced magnetization clearly decreases at the onset of , consistent with the spin singlet electron pairing Brand et al. (2014). Therefore, the mechanism of superconductivity in LiFeAs is likely the same as all other iron-based superconductors.
III.7 Electronic nematic phase and neutron scattering experiments under uniaxial strain
As mentioned in Section F, transport measurements on uniaxial strain detwinned electron-doped BaFe2As2 reveal clear evidence for the in-plane resistivity anisotropy first occurring at a temperature above the zero pressure and Chu et al. (2010); Tanatar et al. (2010); Fisher et al. (2011). As a function of increasing electron-doping, the resistivity anisotropy first increases and then vanishes near optimal superconductivity Fisher et al. (2011), consistent with a signature of the spin nematic phase that breaks the in-plane fourfold rotational symmetry () of the underlying tetragonal lattice Fernandes et al. (2014); Fang et al. (2008); Dai et al. (2009). NMR experiments on 1111 family of materials also indicate the presence of a nematic phase below Fu et al. (2012). However, recent scanning tunneling microscopy Allan et al. (2013) and transport measurements Ishida et al. (2013) suggest that the resistivity anisotropy in Co-doped BaFe2As2 arises from Co-impurity scattering and is not an intrinsic property of these materials. On the other hand, ARPES measurements on Co-doped BaFe2As2 Yi et al. (2011) and NaFeAs Zhang et al. (2012) reveal a splitting in energy between two orthogonal bands with dominant and character at the temperature of resistivity anisotropy in uniaxial strain detwinned samples, thereby suggesting that orbital ordering is also important for the electronic properties of iron pnictides Krüger et al. (2009); Lee et al. (2009); Lv et al. (2009). Finally, since transport measurements were carried out on uniaxial strain detwinned samples Fisher et al. (2011), it is unclear if the uniaxial strain can modify the structural and magnetic phase transitions in these materials.
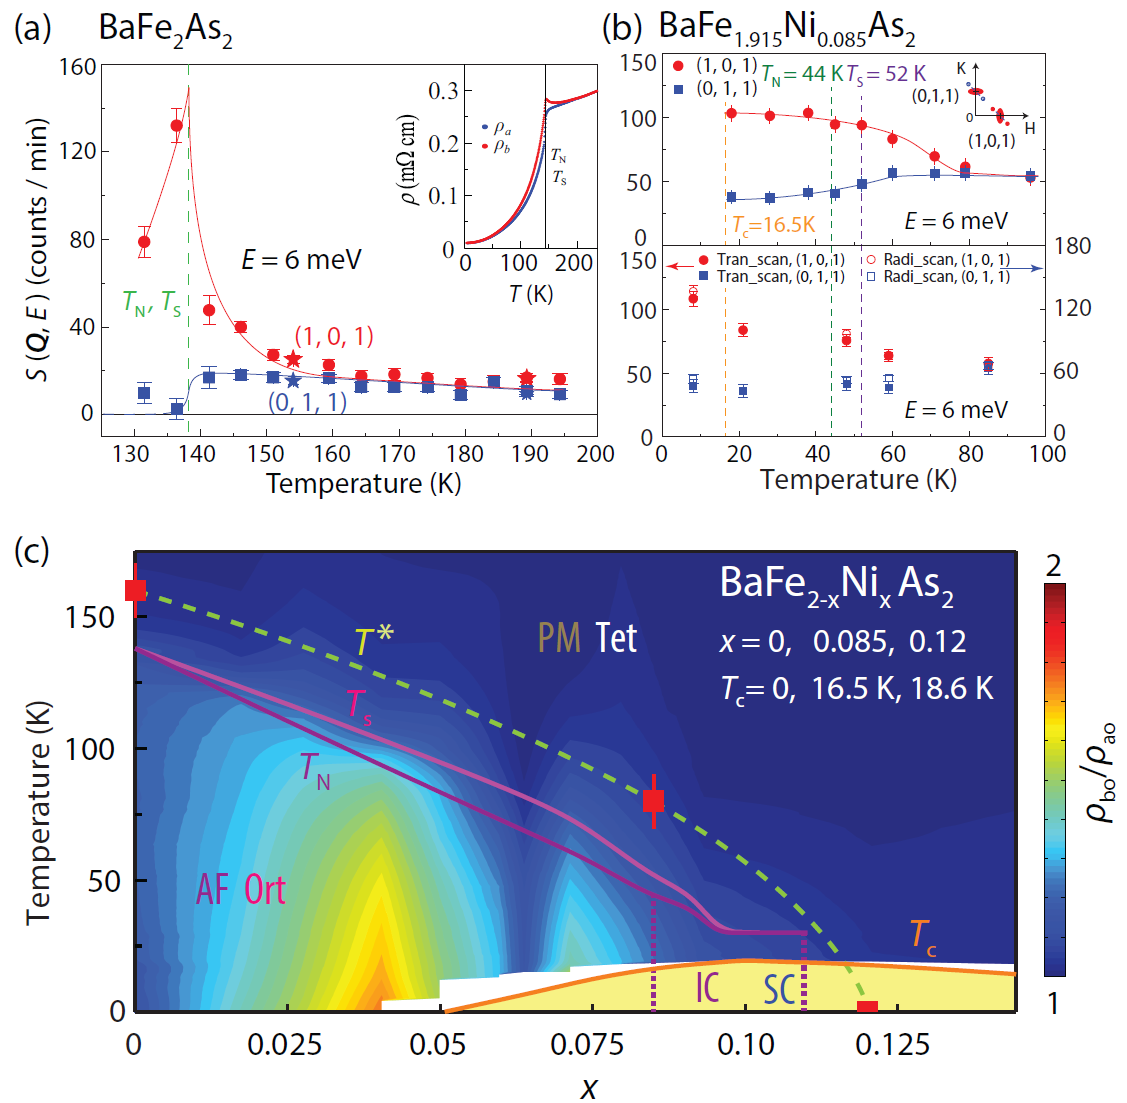
The first neutron scattering experiment carried out under uniaxial strain was on as-grown BaFe2As2 Dhital et al. (2012). The data show that modest strain fields along the in-plane orthorhombic axis as shown in Fig. 32(a) can induce significant changes in the structural and magnetic phase behavior simultaneous with the removal of structural twinning effects. Both the structural lattice distortion and long-range spin ordering occur at temperatures far exceeding the strain free phase transition temperatures [Fig. 32(b)], thus suggesting that the resistivity anisotropy in transport measurements is a consequence of the shift in and under uniaxial strain Dhital et al. (2012). In subsequent neutron scattering study of the effect of uniaxial pressure on and in NaFeAs, as-grown and annealed BaFe2As2 Song et al. (2013a), it was found that while the uniaxial strain necessary to detwin the sample indeed induces a significant increase in and for as-grown BaFe2As2, similar uniaxial pressure used to detwin NaFeAs and annealed BaFe2As2 has a very small effect on their and . These results would suggest that resistivity anisotropy observed in transport measurements Fisher et al. (2011) is an intrinsic property of these materials Song et al. (2013a).
In a recent systematic study of magnetic and structural transitions of the as-grown parent and lightly Co-doped Ba(Fe1-xCox)2As2 under uniaxial pressure Dhital et al. (2014), it was found that the uniaxial strain induces a thermal shift in the onset of AF order that grows as a percentage of as Co-doping is increased and the superconducting phase is approached. In addition, the authors find a decoupling between the onsets of the and under uniaxial strain for parent and lightly-doped Ba(Fe1-xCox)2As2 on the first order side of the tri-critical point Dhital et al. (2014).
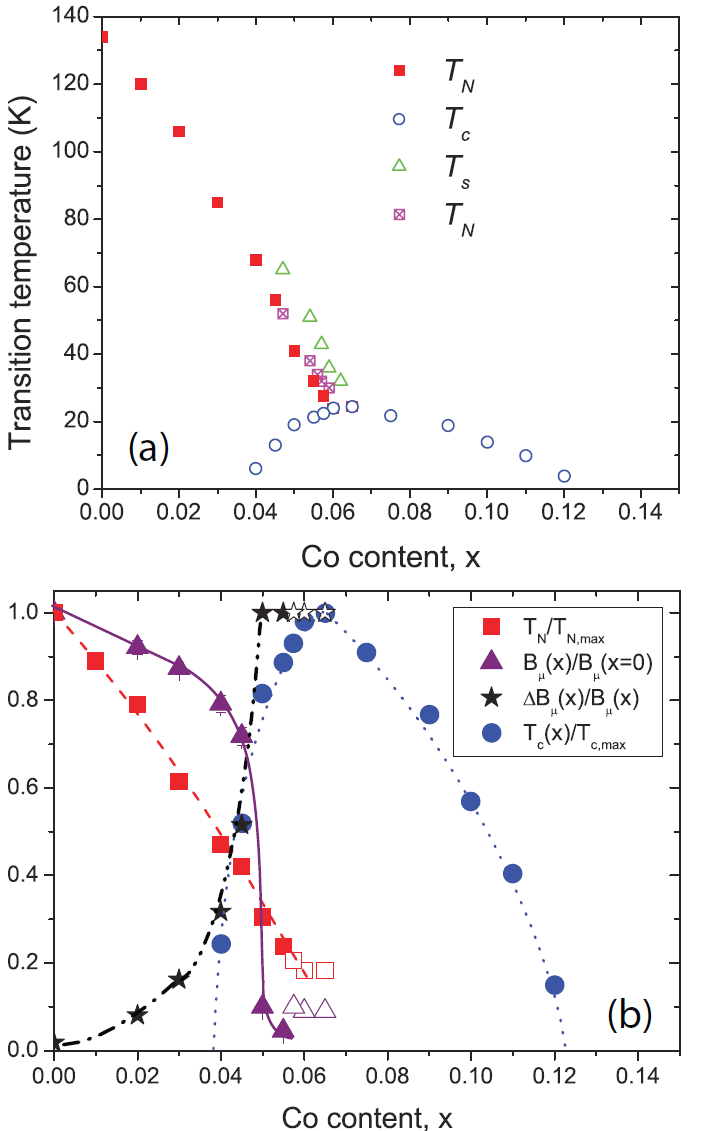
At around the same time, elastic and inelastic neutron scattering experiments were carried out on the annealed BaFe2As2 ( K), BaFe1.915Ni0.085As2 ( K, K), and BaFe1.88Ni0.12As2 ( K, tetragonal structure without static AF order) to study the temperature dependence of the spin excitation anisotropy at wave vectors and Lu et al. (2014a). By comparing the temperature dependence of the magnetic order parameters at wave vectors and in zero and 15 MPa uniaxial pressure on annealed BaFe2As2 [Fig. 32(c)], it was concluded that the applied uniaxial strain is sufficient to completely detwin the sample, and does not affect . Furthermore, the temperature dependence of the intensity at the nuclear Bragg reflection for the twinned and detwinned samples both show a dramatic jump at K arising from the neutron extinction release that occurs due to strain and domain formation related to the orthorhombic lattice distortion, indicating that the uniaxial pressure does not change the tetragonal-to-orthorhombic structural transition temperature [Fig. 32(d)]. Since the measurable extinction release at temperatures well above was suggested to arise from significant structural fluctuations related to the orthorhombic distortion Kreyssig et al. (2010), data for the detwinned sample indicates that the applied uniaxial pressure pushes structural fluctuations to a temperature similar to that at which resistivity anisotropy emerges. These results are different from those of Ref. Dhital et al. (2014) carried out on as-grown BaFe2As2. It remains to be seen how the different results in these experiments can be reconciled Dhital et al. (2012); Song et al. (2013a); Dhital et al. (2014); Lu et al. (2014a).
In addition to determining the effect of uniaxial strain on structural and magnetic phase transitions in annealed BaFe2As2, inelastic neutron scattering experiments on BaFe2-xNixAs2 also reveal that low-energy spin excitations in these materials change from fourfold symmetric to twofold symmetric in the uniaxial-strained tetragonal phase at temperatures corresponding to the onset of in-plane resistivity anisotropy Lu et al. (2014a). The inset in Figure 33(a) shows the in-plane resistivity anisotropy on annealed BaFe2As2 under uniaxial strain. The temperature dependence of the meV spin excitations (signal above background scattering) at and is shown in Fig. 33(a). In the AF ordered state, there are only spin waves at the AF wave vector . On warming to the paramagnetic tetragonal state above and , we see clear differences between and that vanish above 160 K, the same temperature below which anisotropy is observed in the in-plane resistivity [inset in Fig. 33(a)]. Similar measurements on underdoped BaFe1.915Ni0.085As2 reveal that the meV spin excitations at the and wave vectors becomes anisotropic below 80 K [Fig. 33(b)], again consistent with the in-plane resistivity anisotropy from uniaxial strain detwinned BaFe2-xNixAs2 [Fig. 33(c)] Fisher et al. (2011). Finally, uniaxial strain on electron overdoped BaFe1.88Ni0.12As2 induces neither spin excitations nor in-plane resistivity anisotropy at all temperatures Fisher et al. (2011); Lu et al. (2014a). Therefore, resistivity and spin excitation anisotropies both vanish near optimal superconductivity and are likely intimately connected, consistent with spin nematic phase induced electronic anisotropy Fernandes et al. (2014).
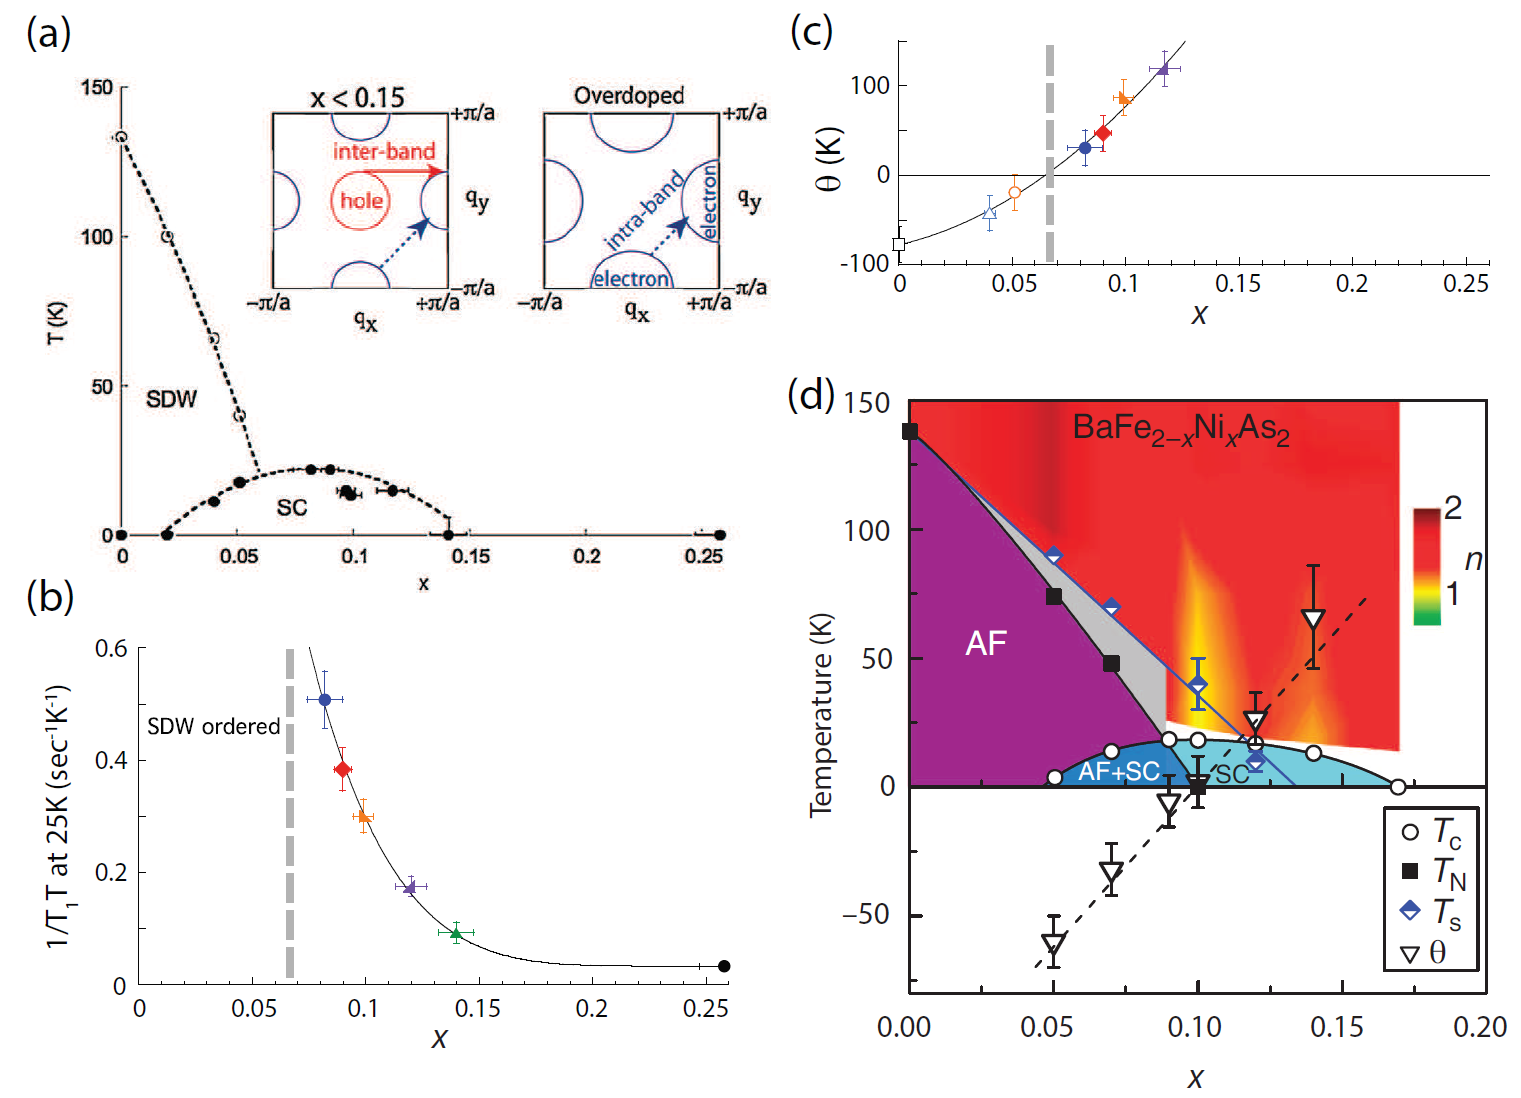
III.8 Comparison of magnetic order and spin excitations determined from neutron scattering with those from SR, NMR, and RIXS measurements
In the discussions above, we have summarized recent progress in the AF order and spin dynamics in iron-based high temperature superconductors determined from elastic and inelastic neutron scattering. However, neutron scattering is not the only technique to study magnetism in these materials. Other probes such as SR, NMR, and RIXS experiments have also been used to investigate their magnetic properties. Compared with neutron scattering, which is a global probe determining the average magnetic properties of the bulk solids, the SR technique is a local probe measuring the magnitude of the static random field experienced by muons that reside on interstitial lattice sites of the studied material. In addition to being able to detect static AF order and superfluid density, it can determine the volume fractions of the magnetic and superconducting phases and their temperature dependence Uemura (2009); Carretta2013. Similarly, NMR is also a local probe that can detect magnetic and superconducting properties of the studied materials Alloul et al. (2009). In this section, we briefly summarize recent results from these techniques and compare them with results obtained from neutron scattering.
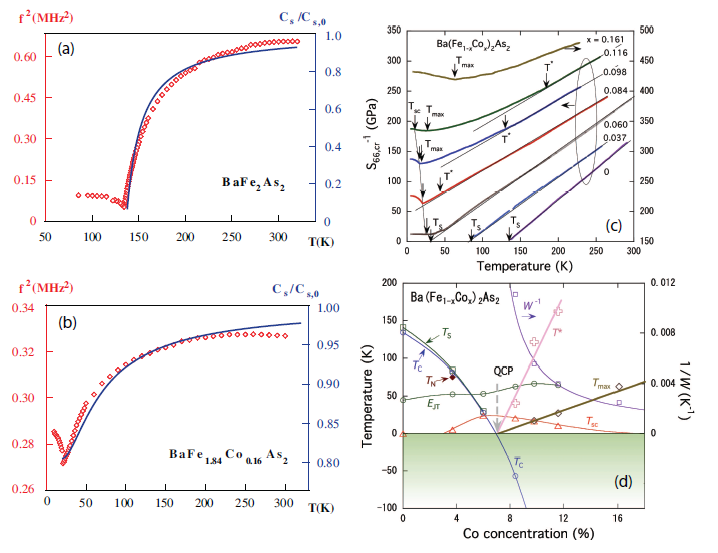
We begin by comparing the electronic phase diagrams of electron doped Ba(Fe1-xCox)2As2 determined from X-ray and neutron scattering Nandi et al. (2010); Pratt et al. (2011) with those determined from the SR measurements [Fig. 34(a)] Bernhard et al. (2012). For Co-doped samples in the underdoped regime (), the SR results find full volume AF ordered phase coexisting and competing with superconductivity. This is consistent with neutron diffraction results indicating static commensurate AF order coexists and competes with superconductivity in the underdoped regime (Fig. 13) Pratt et al. (2009); Christianson et al. (2009). For Ba(Fe1-xCox)2As2 near optimal superconductivity with , magnetic order only develops in parts of the sample volume and the normalized values of the average magnetic field at the muon site, , are reduced dramatically [Fig. 34(b)]. In addition, the AF Néel temperature of the system saturates to a value near or slightly above before vanishing in a first order fashion with increasing Co-doping [Fig. 34(b)] Bernhard et al. (2012). This region of Co-doping is consistent with the appearance of the transverse incommensurate AF order seen in neutron diffraction experiments Pratt et al. (2011). However, instead of a uniform incommensurate spin-density-wave ordered phase, the SR data indicates a spatially inhomogeneous magnetic state for which the volume fraction of the ordered phase decreases with increasing Co-doping Bernhard et al. (2012). The NMR measurements on Ba(Fe1-xCox)2As2 samples near optimal superconductivity reveal that the system is in the spin-glass state which competes with superconductivity Dioguardi et al. (2013). Instead of being a consequence of Fermi surface nesting Pratt et al. (2011), the incommensurate magnetic order in Co-doped BaFe2As2 may arise from inhomogeneous short-range magnetic order similar to the moment modulating cluster spin glass in Ni-doped BaFe2As2 Lu et al. (2014b). Therefore, the electronic phase diagrams of the Co- and Ni-doped BaFe2As2 are similar, showing a homogeneous commensurate long-range static AF ordered phase competing with superconductivity in the underdoped region and a short-range spin glass phase near optimal superconductivity [Fig. 5(b)] Luo et al. (2012b); Lu et al. (2013); Dioguardi et al. (2013); Lu et al. (2014b); Bernhard et al. (2012). There is no evidence for a conventional magnetic quantum critical point near optimal superconductivity, and the AF order disappears in the superconducting phase with increasing Co/Ni-doping in a first order fashion Luo et al. (2012b); Lu et al. (2013); Dioguardi et al. (2013); Lu et al. (2014b); Bernhard et al. (2012).
The electron phase diagrams of the Co- and Ni-doped BaFe2As2 systems have also been mapped out by NMR measurements [Figs. 35(a) and 35(d)] Zhou et al. (2013b); Ning et al. (2009, 2010). In the case of Ba(Fe1-xCox)2As2, the NMR experiments on electron overdoped samples suggest that the absence of quasiparticle excitations with momentum transfer between the hole and electron Fermi surfaces results in complete suppression of the low-energy spin fluctuations for . The insets in Fig. 35(a) show that the hole bands sink below the Fermi surface for , disallowing inter-band quasiparticle transitions between the hole and electron Fermi surfaces Ning et al. (2010). These results are consistent with neutron scattering data on electron-doped BaFe2-xNixAs2, where there is a large (50 meV) spin gap in the nonsuperconducting sample with Wang et al. (2013b).
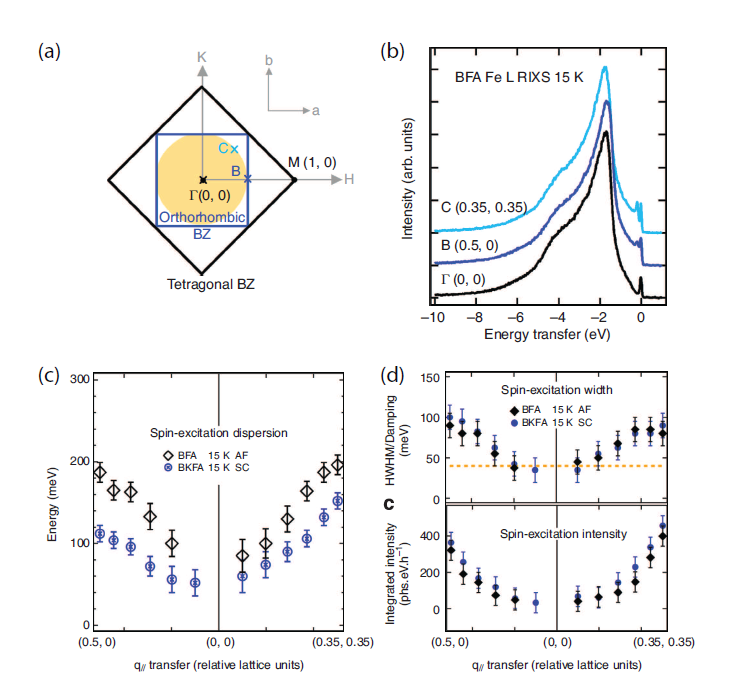
In addition to determining the electronic phase diagram of Ba(Fe1-xCox)2As2 as shown in Fig. 35(a), the obtained by NMR measurements is also related to the wave vector integral of the low-energy spin dynamic susceptibility via , where is the Curie-Weiss temperature (the temperature at which a plot of the reciprocal molar magnetic susceptibility against the absolute temperature intersects the -axis), is the NMR frequency, is the lattice constant, is the form factor of transferred hyperfine coupling at the 75As sites, and the wave vector summation of is taken over the entire first Brillouin zone Ning et al. (2009). By measuring the Co-doping dependence of , one can fit the data with Curie-Weiss law and obtain the electron doping dependence of . Figure 35(b) and 35(c) shows the Co-doping dependence of the in the normal state () and , respectively Ning et al. (2010). The enhancement of and the negative to positive crossing of near vanishing AF order suggest the presence of a magnetic quantum critical point at Ning et al. (2010). Similar NMR data and transport measurements on BaFe2-xNixAs2 suggest the presence of two quantum critical points associated with AF order and the tetragonal-to-orthorhombic lattice distortions, respectively [Fig. 35(d)] Zhou et al. (2013b). These results are in direct contrast to the conclusions of neutron scattering and SR experiments as described earlier in the session, which suggests a weakly first order phase transition from static AF order to superconductivity in electron-doped BaFe2As2. We note that these NMR measurements have not been carried out for the Co and Ni-doped samples with incommensurate magnetic order and near optimal superconductivity Ning et al. (2010); Zhou et al. (2013b).
Although determining whether a conventional magnetic quantum critical point exists in the iron pnictides is important, it is equally important to understand what happens to the tetragonal-to-orthorhombic lattice distortion in the Co and Ni-doped BaFe2As2 phase diagram near optimal superconductivity. From initial high-resolution X-ray diffraction experiments, it was suggested that Ba(Fe1-xCox)2As2 has reentrant behavior near optimal superconductivity, exhibiting a tetragonal-orthorhombic transition above and orthorhombic-tetragonal structural transition below Nandi et al. (2010). While the overall trends of these results were confirmed by later high-resolution X-ray diffraction experiments on BaFe2-xNixAs2 near optimal superconductivity, the presence of low-temperature incommensurate AF order suggests that the system is still in the orthorhombic phase Lu et al. (2013). Using resonant ultrasonic spectroscopy, one can measure the temperature dependence of the anisotropic elastic stiffness associated with the tetragonal-orthorhombic lattice distortion in Ba(Fe1-xCox)2As2 Fernandes et al. (2010); Yoshizawa et al. (2012). Figure 36(a) and 36(b) shows the temperature dependence of the resonant ultrasonic spectroscopy measured squared resonant frequency (red points), and of the calculated elastic stiffness (shear modulus) of the tetragonal phase (solid lines) for BaFe2As2 and BaFe1.84Co0.16As2, respectively Fernandes et al. (2010). The dramatic softening of the shear modulus at temperatures above the tetragonal-orthorhombic lattice distortion temperature has been interpreted as due to the spin nematic phase Fernandes et al. (2010). Figure 36(c) shows the temperature dependence of the inverse of for Co-doping levels of and 0.245 Yoshizawa et al. (2012). The resulting phase diagram shown in Fig. 36(d) suggests the presence of a structural quantum critical point near . While this is consistent with the NMR results of a magnetic quantum critical point Ning et al. (2009, 2010), it differs from the first order nature of the AF order to superconducting phase transition in electron-doped pnictides determined from neutron and SR experiments Lu et al. (2013); Dioguardi et al. (2013); Lu et al. (2014b); Bernhard et al. (2012).
In the past, the only way to explore the energy and wave vector dependence of the spin excitations in materials was via inelastic neutron scattering, which in principle can map out the spin excitations in absolute units from low energy to high energy throughout the Brillouin zone as described in section III of this review. However, such technique suffers from the need for large amounts of single crystals, which may not be available. Recent advances in RIXS provide an alternative method to look for high-energy spin excitations in copper Tacon et al. (2011) and iron Zhou et al. (2013a) based high- superconductors, although the precise RIXS cross section is difficult to calculate and includes couplings to orbital and electronic excitations in addition to magnetic excitations Ament et al. (2011). For the hole-doped YBa2Cu3O6+x family of materials, RIXS measurements showed the existence of damped but well-defined dispersive magnetic excitations, deep in the Stoner continuum of hole-doped cuprates with doping beyond the optimal level Tacon et al. (2011). The high-energy spin excitation spectral weights are found to be similar to those of spin waves in the undoped, antiferromagnetically ordered parent material Tacon et al. (2011). So far, these measurements on hole-doped copper oxide superconductors have not been independently confirmed by inelastic neutron scattering experiments, which mostly probe spin excitations near the AF ordering wave vector instead of near the origin as in RIXS experiments due to the small neutron scattering cross section near (Fig. 4) Fujita et al. (2012); Tranquada et al. (2014). Given that the RIXS cross section is not well-known Ament et al. (2011), it is extremely important to compare inelastic neutron scattering and RIXS experiments on similar samples. Recently, such a comparison has been made for high-energy spin excitations of Sr2CuO2Cl2 Plumb et al. (2014).
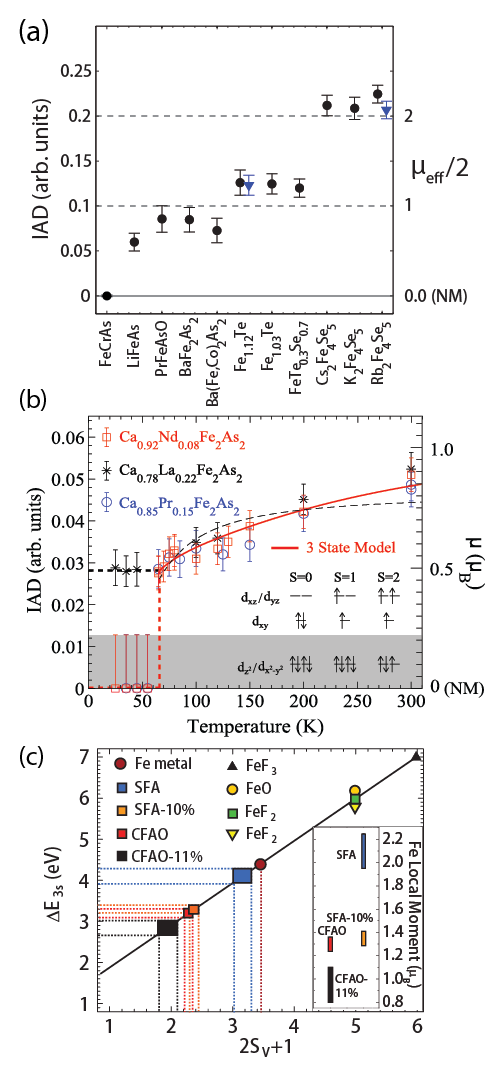
Figure 37(a) shows schematic view of the reciprocal space that can be covered by Fe RIXS shaded by a yellow circle. Black (blue) squares represent the tetragonal (orthorhombic) Brillouin zone Zhou et al. (2013a). Similar to the case of copper oxide superconductors, RIXS by Fe edge will not be able to cover the same region of the reciprocal space as that of inelastic neutron scattering [Fig. 3(e)]. Figure 37(b) plots Fe edge RIXS spectrum on BaFe2As2 collected at 15 K with polarized incoming light, at (), () and (0.35, 0.35) () using orthorhombic reciprocal lattice units [see Fig. 37(a) for the , , and positions in reciprocal space]. In addition to the intense Fe fluorescence at around eV energy transfer, there are momentum dispersive excitations centered around 200 meV near the quasi-elastic peak at zero energy [Fig. 37(b)]. Since the dispersions of these excitations are identical to those of spin waves in BaFe2As2 determined from inelastic neutron scattering [Fig. 37(c)] Harriger et al. (2011), they are believed to arise from the same spin waves in BaFe2As2 measured by RIXS Zhou et al. (2013a). Similar RIXS measurements on optimally hole-doped superconducting Ba0.6K0.4Fe2As2 (BKFA) indicate that while the dispersions of spin excitations are softened [Fig. 37(c)], the excitation intensity and widths are unchanged from its undoped parent BaFe2As2 [Fig. 37(d)] Zhou et al. (2013a). This is a surprising result, different from the hole-doping evolution of the high-energy spin excitations in copper oxides Tacon et al. (2011). While the dispersion of the spin excitations in BKFA determined by RIXS has been confirmed by later inelastic neutron scattering experiments, the absolute spin excitation intensity in BKFA measured by neutrons is much smaller than that of the spin waves in BaFe2As2 Wang et al. (2013b). At present, it is unclear how to reconcile the RIXS and neutron scattering results, although we note that region of the reciprocal space probed by RIXS is different from that probed by inelastic neutron scattering.
As discussed in the introduction, neutron scattering can measure the overall strength of the magnetic excitations through the local fluctuating moment . For a local moment Heisenberg model with spin , the integrated spectral weight when integrated over all wave vector and energy space should yield . Therefore, one can in principle determine the magnitude of by measuring elastic and inelastic magnetic scattering of the system in absolute units throughout the Brillouin zone, and the outcome should be the same as the local moment determined from the X-ray emission spectroscopy (XES) Rueff and Shukla (2010) and core level photo-emission spectra (PES) Vilmercati et al. (2012). However, the current unpolarized time-of-flight neutron scattering technology can only measure correlated spin excitations, and thus will underestimate the size of the effective spin when spin excitations become diffusive and broad as in the case of most iron pnictides [except for the true local moment system Rb0.89Fe1.58Se2 Wang et al. (2011c)]. By measuring the local dynamic susceptibility for electron-doped BaFe2-xNixAs2, we see that the magnitude of decreases from for to Fe, corresponding to Luo et al. (2013a); Wang et al. (2013b).
Figure 38(a) shows the local moment for various iron-based superconductors in the paramagnetic phase as determined from XES Gretarsson et al. (2011). Here the material variation of the local moment of Fe can be extracted using the overall shape of the Fe emission spectra by applying the integrated absolute difference (IAD) analysis. The absolute values of were obtained by scaling the results to neutron scattering data. Figure 38(b) plots the temperature dependence of the IAD for Ca0.92Nd0.08Fe2As2, Ca0.78La0.22Fe2As2, and Ca0.85Nd0.15Fe2As2 Gretarsson et al. (2013). The local moments in the Nd- and Pr-doped samples disappear in the cT phase Goldman et al. (2009), indicating that the Fe2+ ions go through a spin-state transition by taking on the low-spin state in the cT phase. Inelastic neutron scattering experiments on CaFe2As2 also reveal vanishing spin excitations in the cT phase Soh et al. (2013), similar to the XES results Gretarsson et al. (2013). Figure 38(c) shows the values of local Fe moment for various iron pnictides estimated from PES measurements Vilmercati et al. (2012). We see that the values of for BaFe2As2 and SrFe2As2 family of iron pnictides are much larger than those obtained by inelastic neutron scattering, and decrease by about 40% in the optimally doped compound, also different from doping dependence results from neutron scattering Mannella (2014). As emphasized in a recent Review Mannella (2014), the PES experiments sample spin excitations on time scales shorter than - s, while inelastic neutron scattering measurements probing spin excitations up to 300 meV correspond to time scales on the order of 10-15 fs, at least one or two orders of magnitude slower than those in PES experiments. Furthermore, PES measurements determine the total uncorrelated spin while present inelastic neutron scattering measures correlated spin excitations near the AF ordering wave vector within the first Brillouin zone.
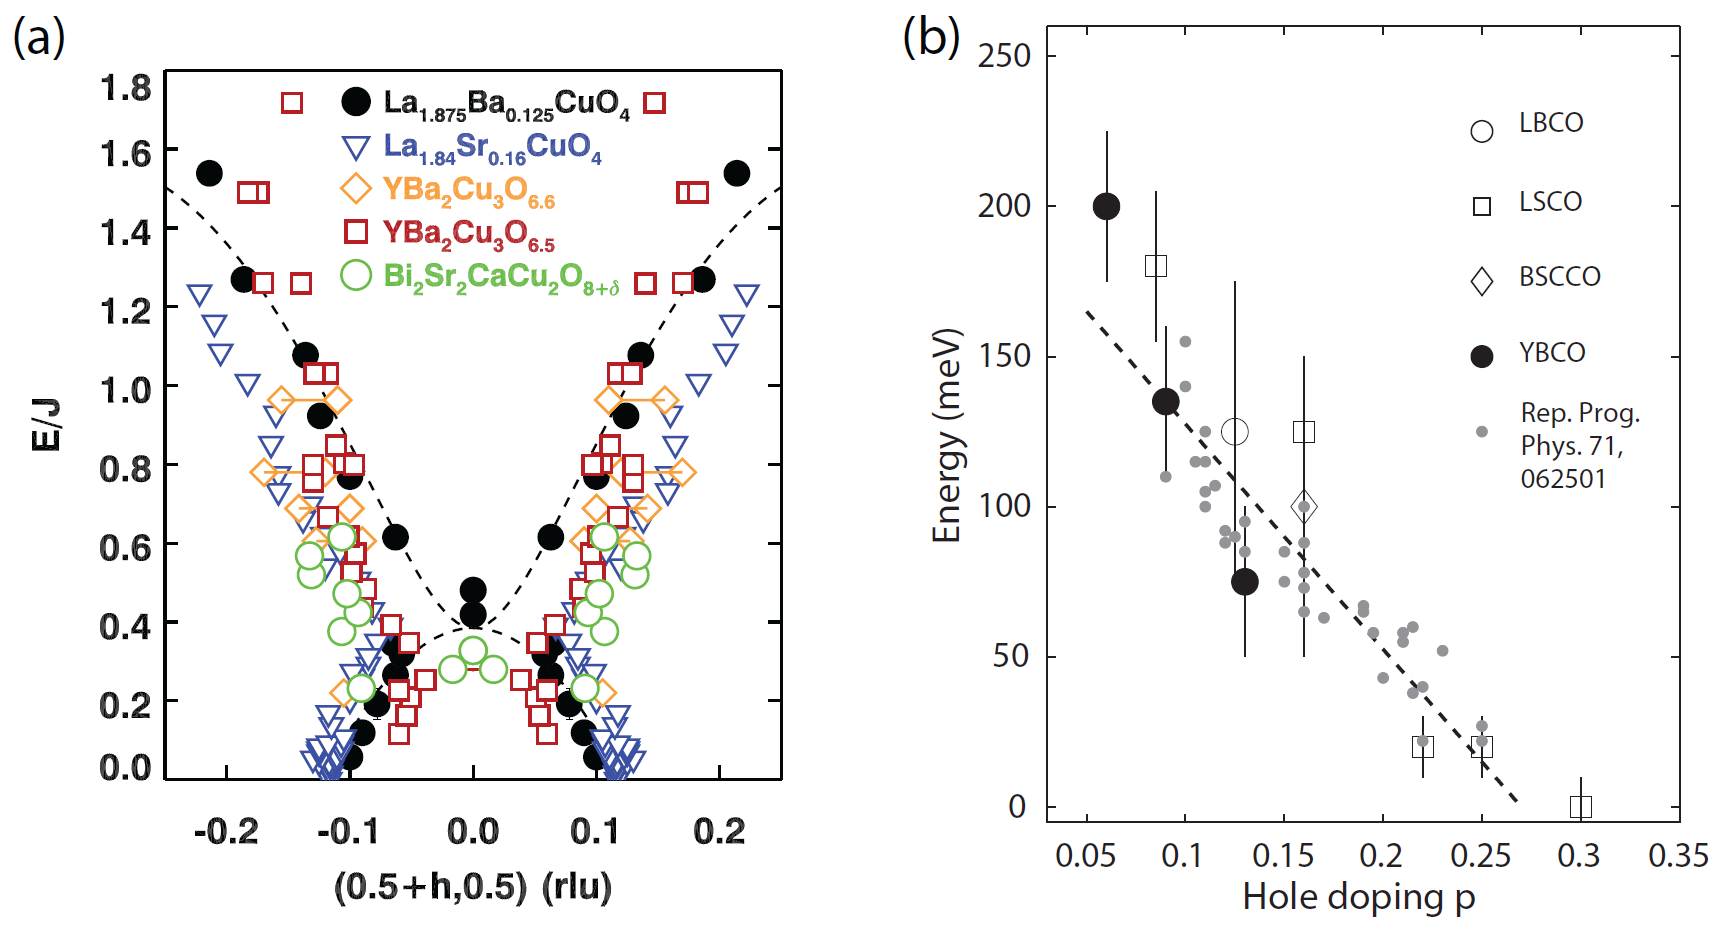
III.9 Comparison of spin excitations in iron-based superconductors with those in copper oxide and heavy fermion superconductors
With the discovery of La2-xBaxCuO4 family of copper oxide superconductors in 1986 Bednorz and Müller (1986), the field of high- superconductivity was born. Although research in high- copper oxide superconductors is still active with many exciting new results almost 30 years later Ghiringhelli et al. (2012); Fradkin and Kivelson (2012), the discovery of iron-based superconductors in 2008 provided an entire new class of materials where high- superconductivity occurs Kamihara et al. (2008). Since high- copper oxide and iron-based superconductors, as well as heavy fermion superconductors are close to AF instability, magnetism may be a common thread for unconventional superconductivity Scalapino (2012). If this is indeed the case, it will be interesting to determine the similarities and differences in spin excitations of these superconductors.
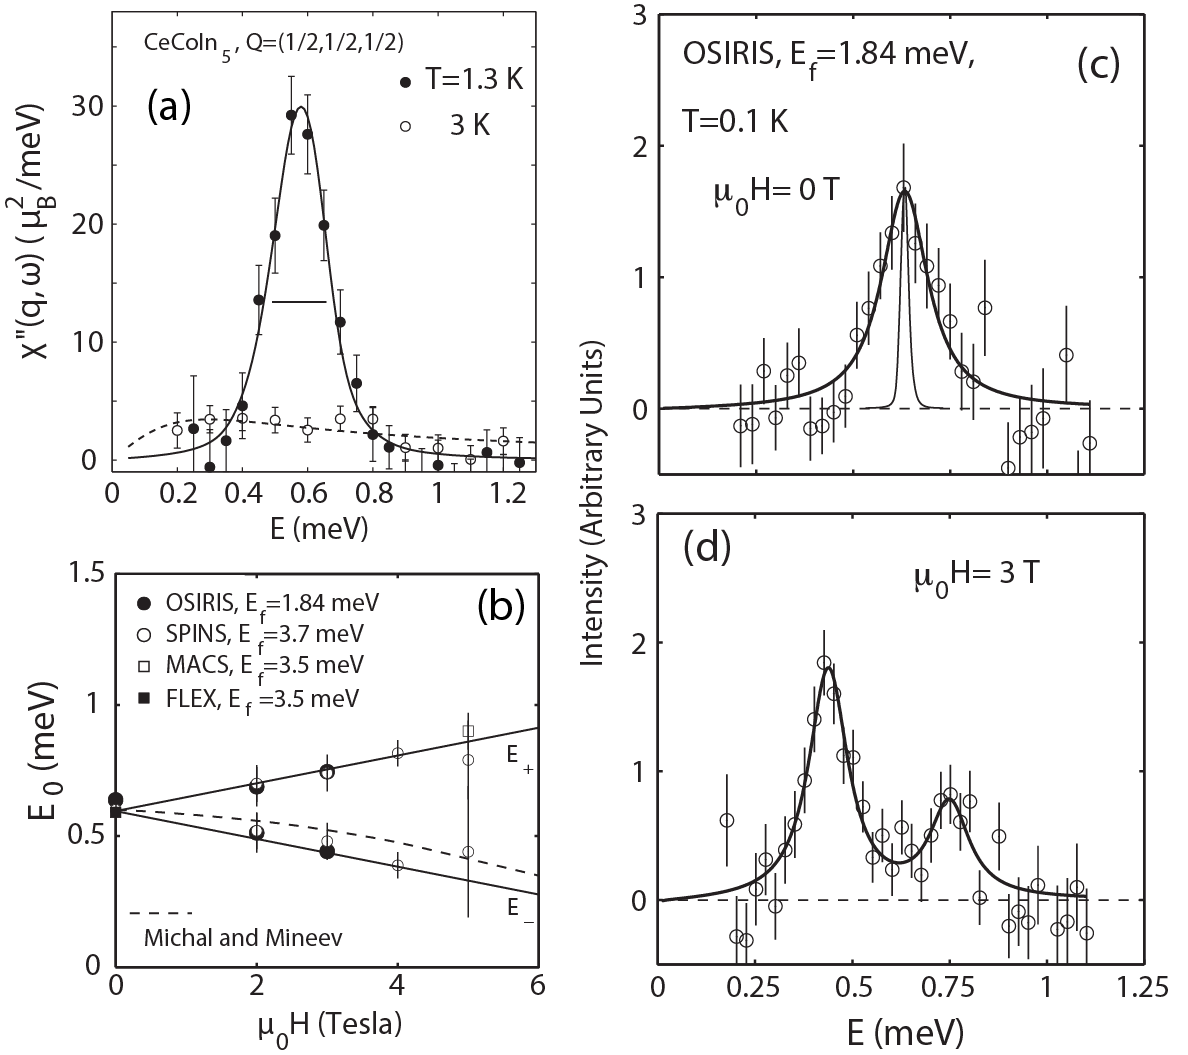
As discussed in recent review articles Fujita et al. (2012); Tranquada et al. (2014), an important feature of the spin excitations in copper oxide superconductors is the neutron spin resonance and hourglass like dispersion of the spin excitation spectra. An hourglass magnetic spectrum is also seen in an insulating, hole-doped antiferromagnet La5/3Sr1/3CoO4 Boothroyd et al. (2011). Figure 39(a) shows the spin excitation dispersions of different copper oxide superconductors away from the AF ordering wave vector , where is the nearest neighbor magnetic exchange coupling ( meV) Fujita et al. (2012); Tranquada et al. (2014). While the hourglass dispersion of spin excitations appears to be a ubiquitous feature of different families of hole-doped copper oxide superconductors, they are clearly absent in spin excitation spectra of electron-doped iron pnictides. For optimally hole-doped iron pnictides, spin excitations change from longitudinally to transversely elongated ellipses centered at on moving from below the resonance energy to above it Wang et al. (2013b). This is different from the hourglass dispersion seen in hole-doped copper oxides. Another important feature of the spin excitation spectra is the electron and hole-doping evolution of the local dynamic susceptibility. For hole-doped copper oxide superconductors, the strength of the high energy magnetic response near decreases with increasing doping level. To quantify this behavior, Stock et al. evaluated the hole doping dependence of the energy at which the local dynamic susceptibility falls below half of that for an undoped AF parent compound Stock et al. (2010). The outcome suggests that the hole-dependence of the magnetic energy scale corresponds very well with the pseudogap energy determined from electronic spectroscopies [Fig. 39(b)] Hüfner et al. (2008). These results indicate that AF spin excitations in copper oxides decreases dramatically with increasing hole doping. Although there are only limited data available for hole-doped iron pnictides Wang et al. (2013b), they show a similar trend as that of hole-doped copper oxides. More inelastic neutron scattering experiments on hole-doped iron pnictides are necessary in order to make a detailed comparison between spin excitations in iron and copper based high- superconductors.
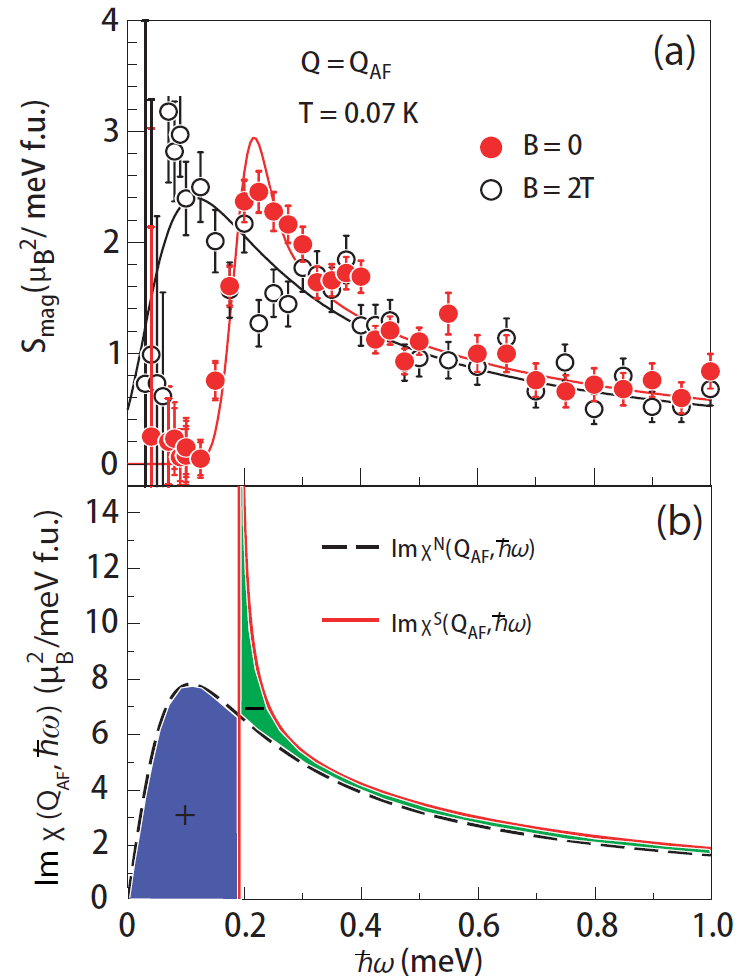
As discussed in Section H, recent advances in RIXS have allowed a direct study of spin excitations in copper and iron-based superconductors. However, the results obtained by RIXS for hole-doped iron pnictides disagree with those obtained by inelastic neutron scattering Zhou et al. (2013a); Wang et al. (2013b). RIXS measurements on copper oxide superconductors also find excitations that soften no more than 10% with doping, with negligible change in integrated intensity. While these results are very similar to those obtained on iron pnictides Zhou et al. (2013a), they are again in conflict with those of inelastic neutron scattering probing spin excitations near Tranquada et al. (2014). As the RIXS cross section includes both charge and spin excitations Ament et al. (2011), it is not known how to compare directly the RIXS intensity with that of the well-established magnetic cross section obtained from inelastic neutron scattering.
In the case of electron-doped copper oxide superconductors, recent RIXS experiments have confirmed that magnetic excitations harden across the antiferromagnetism and superconductivity boundary seen originally with neutron scattering experiments Wilson et al. (2006b); Fujita et al. (2006); Lee et al. (2013b). However, RIXS finds a negligible change in the integrated magnetic intensity as a function of electron doping at high energies, again in conflict with neutron scattering results on similar materials Wilson et al. (2006b); Fujita et al. (2006); Lee et al. (2013b). While one can directly compare spin waves measured in neutron scattering experiments with RIXS in the AF ordered phase of copper oxide and iron-based materials due to symmetry of the equivalent Brillouin zones (see dashed box near and magenta shaded box near in Fig. 3), there is no physical justification for assuming that the excitations measured by RIXS near the () point are the same as those near obtained by neutron scattering for a doped metallic sample Tranquada et al. (2014). Whereas the neutron scattering cross section is well understood, the RIXS cross section is complicated and the significance of the RIXS measurements is unclear at present. Only future RIXS and neutron scattering measurements performed on the same sample at the same region of the reciprocal space will shed new light to our understanding of the spin and electronic excitations as revealed by RIXS and determine their significance to high- superconductivity.
In addition to copper and iron based superconductors, unconventional superconductivity also includes heavy fermion superconductors Steglich et al. (1979); Stewart (2001); Gegenwart et al. (2008); v. Löhneysen et al. (2007). Compared with iron and copper-based superconductors, the parent compounds of heavy fermion superconductors are also long-range ordered antiferromagnets but with a magnetic exchange coupling energy scale much lower than that of the AF parents of copper oxide and iron-based superconductors. For example, in a recent study of spin waves in AF ordered CeRhIn5, the parent compound of the CeCoIn5 family of heavy Fermion superconductors Thompson and Fisk (2012), the dominant in-plane nearest neighbor magnetic exchange coupling is meV Das et al. (2014), much smaller than that of the AF parents of iron based superconductors (see Table II). In spite of the dramatically reduced energy scale, heavy Fermion superconductors still have some interesting features also seen in copper and iron-based superconductors. A case in point is the neutron spin resonance in heavy Fermion superconductors such as UPd2Al3 Sato et al. (2001) and CeCoIn5 Stock et al. (2008).
Figure 40(a) shows energy dependence of the spin excitations of CeCoIn5 below and above at Stock et al. (2008). While the normal state spin excitations are featureless within the probed energy range, superconductivity induces a sharp peak reminiscent of the resonance in iron and copper based superconductors. From neutron polarization analysis of the resonance discussed in Section F, we know that the mode in iron-based superconductors is isotropic, consistent with the singlet-to-triplet excitation of electron Cooper pairs Eschrig (2006). If this is indeed the case, application of a magnetic field should Zeeman split the resonance into three peaks arising from a single ground state to a triplet excited state Dai et al. (2000), where the central field independent peak is longitudinally polarized while the field dependent peaks are transversely polarized Ismer et al. (2007). Unfortunately, magnetic field experiments on copper oxide Dai et al. (2000) and iron-based superconductors Zhao et al. (2010); Wen et al. (2010); Li et al. (2011a) have been unable to determine the ground state of the resonance. Surprisingly, the application of a magnetic field on heavy Fermion superconductor CeCoIn5 splits the resonance into two peaks as shown in Figs. 40(b)-40(d) Stock et al. (2012). This would suggest that the resonance in CeCoIn5 is a doublet instead of a singlet-to-triplet excitation. In separate polarized inelastic neutron scattering experiments under a magnetic field, the double peak nature of the resonance was confirmed under a 2 T applied field Raymond et al. (2012). In addition, the resonance line shape is found to depend on the neutron polarization, suggesting that the resonance is a degenerate mode with three fluctuation channels: a Zeeman split contribution and an additional longitudinal mode Raymond et al. (2012). While these results on CeCoIn5 are interesting, they still have not established conclusively the doublet or singlet-to-triplet nature of the resonance.
Using established models to calculate the magnetic contributions to the superconducting condensation energy in copper oxide superconductors Scalapino and White (1998); Demler and Zhang (1998), one can in principle estimate the lowering of the magnetic exchange energy in YBa2Cu3O6+x family of materials using spin excitation spectra above and below Dai et al. (1999); Woo et al. (2006); Dahm et al. (2009). However, the large energy scale of the spin excitations in high- copper oxide superconductors means that it is difficult to obtain the overall spin excitation spectra in the low-temperature normal state using a magnetic field to eliminate superconductivity Dai et al. (1999); Woo et al. (2006); Dahm et al. (2009). This makes the estimation of the lowering of the magnetic exchange energy in the low-temperature state ambiguous Scalapino and White (1998); Demler and Zhang (1998). Since heavy Fermion superconductors generally have a much smaller energy scale, one can easily obtain the low-temperature normal state spin excitation spectra using a magnetic field to suppress superconductivity. Figure 41(a) shows the energy dependence of the spin excitation spectra in the low-temperature normal and superconducting states for CeCu2Si2 Stockert et al. (2011), which exhibits superconductivity below K Steglich et al. (1979). One can see the opening of a spin gap and clear enhancement in spin excitations above the gap. Using the energy dependence of the dynamic susceptibility in absolute units in the low-temperature normal and superconducting states [Fig. 41(b)], Stockert and co-workers estimated the lowering of the magnetic exchange energy in CeCu2Si2 and found it to be considerably larger than the superconducting condensation energy Stockert et al. (2011). Although the lowering of the magnetic exchange energy is also found to be much larger than the superconducting condensation energy in the superconducting iron pnictides Wang et al. (2013b) and chalcogenides Leiner et al. (2014), these experiments also suffer the problem of not being able to determine the overall spin excitation spectrum in the low-temperature normal state.
IV Theoretical descriptions of static AF order and spin excitations in iron-based superconductors
Shortly after the discovery of iron-based superconductors, band structure calculations predicted that the Fermi surfaces of parent compounds consist of two quasi-two-dimensional near-circular hole pockets centered around the zone center , and two quasi-two-dimensional elliptic electron pockets center around the (1,0) and (0,1) points in the orthorhombic unfolded Brillouin zone (Fig. 14) Mazin (2010); Hirschfeld et al. (2011). The sign reversed quasiparticle excitations between the hole and electron pockets (nesting) can give rise to the spin-density-wave order observed experimentally Dong et al. (2008); de la Cruz et al. (2008). In addition, the same quasiparticle excitations in doped superconductors are expected to induce a neutron spin resonance in the superconducting state, which is confirmed by experiments (see Section III. B) Korshunov and Eremin (2008); Maier and Scalapino (2008); Maier et al. (2009). Within this weak-coupling analysis, iron-based superconductors and their parents are assumed to be good metals made of itinerant electrons with spin-density-wave type AF order. Spin waves and spin excitations can then be calculated using RPA in a multiband Hubbard model with appropriate Fermi surfaces for hole and electron pockets Knolle and Eremin (2013). In this approach, the large in-plane effective magnetic exchange coupling anisotropy (Table II) in the spin waves of iron pnictides Zhao et al. (2009); Harriger et al. (2011) can be understood as due to the ellipticity of the electron pockets (Fig. 14), which induces frustration between the and wave vectors connecting the hole and electron pockets Knolle et al. (2010); Kaneshita and Tohyama (2010). In the underdoped regime where the static AF order coexists and competes with superconductivity Pratt et al. (2009); Christianson et al. (2009); Wang et al. (2010), spin excitations at are determined by the presence of the AF order and associated spin waves, while the excitations at wave vector are dominated by the superconductivity and formation of the resonance in the single domain sample Knolle et al. (2011). However, since most neutron scattering experiments in underdoped iron pnictides were carried out on twinned samples that cannot distinguish the wave vector from Pratt et al. (2009); Christianson et al. (2009); Wang et al. (2010), it is unclear how the resonance associated with superconductivity interacts with itinerant electrons contributing to the spin waves. In a systematic study of spin excitations in BaFe2-xNixAs2, the electron-doping evolution of the low-energy spin excitations was found to qualitatively agree with RPA calculations of the nested Fermi surfaces Luo et al. (2012b). However, the high-energy spin excitations are weakly electron-doping independent, and have values much different from that found by RPA calculations Liu et al. (2012a); Luo et al. (2013a); Wang et al. (2013b). These results suggest that the weak-coupling analysis based on purely itinerant electrons is insufficient to explain the entire spin excitation spectrum and its electron or hole doping evolution.
Although the weak-coupling approach using a Fermi surface nesting picture provides a nice framework to understand static AF order, spin excitations, and their connection with superconductivity in iron-based materials Mazin (2010); Hirschfeld et al. (2011), calculations show that the ordered moment in the AF iron pnictides is around 2 /Fe Ma and Lu (2008), much larger than the largest experimental value (0.9 /Fe, see Table I). Furthermore, the ordering wave vectors of the bi-collinear AF structure in iron chalcogenides shown in Fig. 2(c) do not match the nesting wave vector of the Fermi surfaces Subedi et al. (2008). In the strong coupling limit, all unpaired electrons, not just itinerant electrons near the Fermi surface, participate in forming magnetic order, much like the magnetic moment of Cu2+ in the insulating copper oxides Si and Abrahams (2008); Fang et al. (2008); Xu et al. (2008). Here, the AF ordered state of iron-based superconductors can be described by a local moment Heisenberg Hamiltonian with the nearest neighbors (-) and next nearest neighbor () exchange interactions (Fig. 4) Fang et al. (2008); Xu et al. (2008); Dai et al. (2009); Yildirim (2008); Moreo et al. (2009); Han et al. (2009); Yu et al. (2013). In this picture, the large in-plane magnetic exchange coupling anisotropy in the parent compounds of iron pnictides is understood in terms the presence of the biquadratic exchange coupling between the nearest spins in the AF ordered states, which can be mapped onto the - model with a specific relationship between - and - Wysocki et al. (2011); Yu et al. (2012). This means that the usual local moment Heisenberg Hamiltonian will be modified to , where and are the nearest and next nearest neighbor exchange couplings, respectively, and is the spin at site Wysocki et al. (2011); Yu et al. (2012). The calculated dynamical structure factor forms ellipses in momentum space around at low excitation energies. With increasing energy, the elliptic features expand towards the zone boundary and gradually split into two parts, forming a pattern around the wave vector consistent with neutron scattering experiments Zhao et al. (2009); Harriger et al. (2011); Wysocki et al. (2011); Yu et al. (2012).
By comparing the AF exchange interactions determined from neutron scattering in the parent compounds of iron-based superconductors with those of the superconducting gap functions in the corresponding superconducting materials observed by ARPES, it was argued that the key ingredients in determining the high- superconductivity of iron-based materials are the next nearest neighbor local AF exchange interactions in real space and a Fermi surface topology in reciprocal space that matches to the pairing form factor provided by AF interactions Hu and Ding (2012). From analysis of spin excitation spectra in hole and electron-doped iron pnictides and magnetic contributions to the superconducting condensation energy Scalapino (2012), we find that high- superconductivity is associated with materials having large magnetic exchange coupling and strong itinerant electron-spin excitation interactions Wang et al. (2013b), similar to the large Debye temperatures and strong electron-phonon interactions in high- BCS superconductors Bardeen et al. (1957). Finally, the strong-coupling approach predicts the presence of a quantum critical point separating a paramagnetic metallic phase from an AF phase phase in phosphorus doped iron pnictides Dai et al. (2009). Indeed, neutron scattering experiments on powder samples of CeFeAs1-xPxO suggest the presence of a quantum critical point near controlled by the pnictogen height away from the Fe-plane [Fig. 7(a)] de la Cruz et al. (2010). Similarly, thermodynamic and transport measurements on BaFe2(As1-xPx)2 have identified a quantum critical point near optimal superconductivity at [Fig. 6(d)] Shibauchi et al. (2014). However, recent neutron powder diffraction measurements on BaFe2(As1-xPx)2 suggest that structural quantum criticality cannot exist at compositions higher than due to the actual phase stability range Allred et al. (2014). It is therefore desirable to carry out neutron scattering and SR experiments on single crystals of BaFe2(As1-xPx)2 near to establish the nature of the AF phase transition with increasing P-doping.
While there are many phenomenological reasons for using the strong coupling approach to understand the electrical transport, spin and charge dynamical properties of iron pnictides and chalcogenides Fang et al. (2008); Xu et al. (2008); Dai et al. (2009); Yildirim (2008); Yu et al. (2013), such an approach is incompatible with some spin dynamical properties. For example, in a strict local moment Heisenberg Hamiltonian, single particle excitations or spin waves should only have transverse components and would not support longitudinal spin excitations in the AF ordered phase of iron pnictides as seen in polarized neutron scattering experiments [Fig. 29(f)] Wang et al. (2013a). Furthermore, the electron and hole-doping evolution of the low-energy spin excitations are consistent with the Fermi surface nesting predictions, but it is unclear whether the data is also compatible with a pure local moment Heisenberg Hamiltonian (see Section III. C). Finally, spin waves of iron chalcogenides are heavily damped at high-energies near the zone boundary and exhibit a number of anomalous properties difficult to understand within a local moment model Lipscombe et al. (2011); Zaliznyak et al. (2011).
Instead of a strong or weak coupling approach, the iron pnictides may be Hund’s metals where the interaction between the electrons is not strong enough to fully localize them to form a Mott insulator, but is sufficient so that the low energy quasiparticles have much enhanced mass Haule and Kotliar (2009). Here the electron correlation strength would be primarily controlled by the Hund’s coupling , which depends on the pnictogen heights and tends to align spins of all the electrons on a given Fe-atom, and hence enhances spin excitations without appreciably affecting the charge excitations Yin et al. (2011). This is different from the effect of large Coulomb repulsion in a Mott insulator, which hampers charge excitations in order to enhance spin fluctuations Lee et al. (2006). The electronic excitations in iron-based superconductors are neither fully itinerant nor fully localized, but have a dual nature that can be realistically described by a combination of DFT and DMFT Kotliar et al. (2006). This idea is similar to the picture where single electron spectral function is composed of coherent and incoherent parts representing electrons near (itinerant electrons) and far away (local moments) from the Fermi surface Abrahams and Si (2011).
Using the combined DFT and DMFT method, one can estimate the size of the ordered moment for different iron pnictides and find them to be close to the observed value Yin et al. (2011). The same method has also been used to calculate the spin wave spectra in BaFe2As2 and good agreement was found with neutron scattering experiments Park et al. (2011a); Yin et al. (2014). Finally, the combined DFT and DMFT method has been used to calculate the electron and hole-doping dependence of the spin excitation spectrum in absolute units for Ba1-xKxFe2As2 and BaFe2-xNixAs2 Wang et al. (2013b). Compared with RPA calculations based on the weak-coupling approach Hirschfeld et al. (2011), combining DFT and DMFT gives a more realistic estimation of the absolute intensity of the local dynamic susceptibility, and can quantitatively model the electron and hole-doping evolution of the spin excitations in absolute units Wang et al. (2013b). Furthermore, it can account for the pnictogen height dependence of the spin-wave spectra Zhang et al. (2014a).
The static AF order and spin excitations in iron-based materials can also be understood by hybrid models consisting of local moments on each Fe site and itinerant electrons from the degenerate and orbitals Kou et al. (2009); Yin et al. (2010). In this picture, the local moments interact with each other via and Heisenberg exchanges, and they are coupled to the itinerant electrons via Hund’s rule coupling. Since itinerant electrons are only associated with and orbitals that break the rotational symmetry of the underlying - lattice plane due to their different occupancies, these orbitals can form a Hamiltonian that drive the in-plane magnetic anisotropy, producing unfrustrated collinear AF order and lifting the degeneracy of the and magnetic states Lee et al. (2009); Krüger et al. (2009); Kou et al. (2009); Yin et al. (2010); Lv et al. (2010); Chen et al. (2010a). Here the magnetic anisotropy is due to purely electronic ferro-orbital order that spontaneously breaks the rotational symmetry of the underlying lattice and drives the observed magnetic and structural transitions without Fermi surface nesting or magnetic frustration Lee et al. (2009); Krüger et al. (2009). Using a fermionic representation of the local moments and a generalized RPA framework, one can calculate the spin wave spectra of BaFe2As2 and find that the outcome is consistent with spin excitations in the AF ordered and paramagnetic states obtained from inelastic neutron scattering Yang et al. (2010); Leong et al. (2014). In addition, the global phase diagram for the AF and superconducting states calculated from the hybrid model on the mean-field level is qualitatively consistent with experiments You et al. (2011). At high characteristic temperatures, electrons in more localized orbitals of the multiband system may first form short-ranged AF order. Upon cooling to lower temperatures, the electrons in more itinerant orbitals can be driven into a true static AF ordered or superconducting state via Hund’s coupling to the preformed localized AF state. This is analogous to the orbital-selective Mott transition, where itinerant and localized electrons in different orbitals may separate as independent degrees of freedom Kou et al. (2009); Lv et al. (2010); Yang et al. (2010); Leong et al. (2014); You et al. (2011).
V Summary and outlook
In this paper, we have reviewed recent progress of neutron scattering studies of the static AF order and spin dynamics in iron-based high temperature superconductors. Soon after the discovery of these materials in 2008 Kamihara et al. (2008), neutron diffraction measurements at the NIST center for neutron research and high flux isotope reactor at Oak Ridge National Laboratory have determined the AF order and crystalline structures of the parent and superconducting compounds de la Cruz et al. (2008); Huang et al. (2008a). These measurements have established the basis that superconductivity in iron-based materials arises from the suppression of static long-range ordered antiferromagnets, much like copper oxide superconductors Tranquada et al. (2014). When single crystals of the 122 family of iron pnictides and iron chalcogenides have become available, the advanced time-of-flight neutron spectrometers at spallation neutron sources at Oak Ridge National Laboratory and ISIS at Rutherford-Appleton Laboratory have allowed detailed mapping of the spin wave spectra throughout the Brillouin zone Diallo et al. (2009); Zhao et al. (2009). This first occurred only slightly more than one year after the discovery of the iron pnictide superconductors. In copper oxide superconductors Bednorz and Müller (1986), the first complete spin wave spectrum was measured 15 years after its discovery Coldea et al. (2001). Using the overall spin wave spectra in the AF ordered iron pnictides, one can fit the dispersion curves with a Heisenberg Hamiltonian, revealing the anisotropic in-plane effective magnetic exchange couplings. This has inspired much discussion on the microscopic origin of the effective magnetic anisotropy as described in Section IV.
Since high quality single crystals of electron and hole-doped BaFe2As2 are available, most of the elastic and inelastic neutron scattering experiments have been carried out on these materials. With elastic neutron scattering experiments, one can map out the electron and hole doping evolution of the structural and magnetic phase diagrams. For electron-doped materials obtained via Co and Ni substitution of Fe, the tetragonal-to-orthorhombic lattice distortion precedes the AF phase transition, and the static long-range order coexists/competes with superconductivity in the underdoped regime. However, the AF order becomes incommensurate with a short-range correlation length near optimal superconductivity, indicating that it is a spin-glass phase in the matrix of the superconducting phase, coexisting and competing with superconductivity Dioguardi et al. (2013); Lu et al. (2014b); Bernhard et al. (2012). NMR measurements on 1111 family of materials also suggest nanascale electronic inhomogeneity Lang et al. (2010). For hole-doped Ba1-xKxFe2As2 and Ba1-xNaxFe2As2, the structural and magnetic phase transitions are coupled at at all doping levels Avci et al. (2012, 2013, 2014). Near optimal superconductivity, there is a new magnetic phase within the tetragonal structure, possibly associated with a spin nematic phase, and the transition from AF order to superconductivity may also occur in the first order fashion Avci et al. (2013, 2014). Finally, although transport and NMR measurements suggest the presence of a quantum critical point near for isoelectronically doped BaFe2(As1-xPx)2 Shibauchi et al. (2014), neutron diffraction measurements have only mapped out the magnetic and structural phase diagram in the underdoped regime Allred et al. (2014), and much is not known about the evolution of AF order near optimal superconductivity.
Similar to neutron diffraction work, most of the inelastic neutron scattering studies of spin excitations in iron pnictides have been focused on electron-doped BaFe2As2. Compared with the undoped parent compounds, electron-doping appears to modify spin excitations below 80 meV while leaving high energy spin excitations mostly unchanged Luo et al. (2013a). However, hole-doping suppresses high-energy spin excitations and transfers the spectral weight to low-energies Wang et al. (2013b). In addition, the wave vector dependence of the low-energy spin excitations in iron pnictides appears to be controlled by the quasiparticle nesting between the hole and electron Fermi surfaces. These results are consistent with the notion that spin excitations in iron pnictides have both local and itinerant character with the electron correlations controlled by the pnictogen height and strength of the Hund’s coupling Haule and Kotliar (2009); Kou et al. (2009); Yin et al. (2010). The availability of large single crystals of iron chalcogenides Fe1+yTe1-xSex means that spin excitations in these materials have been carefully mapped out Lipscombe et al. (2011); Zaliznyak et al. (2011); Lumsden et al. (2010). In particular, application of the sum rules of neutron scattering indicate that the integrated spin excitation intensity of Fe1+xTe is inconsistent with an Fe2+ ground state expected in the presence of a strong crystalline electric field Stock et al. (2014), suggesting the importance of itinerant electrons even for the iron chalcogenides, which exhibit strong electron correlations and localized moments Yin et al. (2011).
Compared with electron-doped BaFe2As2, spin excitations in hole-doped Ba1-xKxFe2As2 and isoelectronically doped BaFe2As2-xPx iron pnictides have been much less studied Lee et al. (2011, 2013a); Zhang et al. (2011a); Wang et al. (2013b). Given the recent discovery of the possible spin nematic phase in the tetragonal phase Avci et al. (2014), it will be interesting to study the evolution of the overall spin excitations in hole and isoelectronically doped iron pnictides. In particular, since the electron pairing symmetry of the heavily hole-doped superconducting Ba1-xKxFe2As2 is still unclear Tafti et al. (2013); Ota et al. (2014), it is important to carry out temperature dependent measurements to study the effect of superconductivity on low-energy spin excitations. A determination of the wave vector and energy of the superconductivity-induced neutron spin resonance will put considerable constraint on the nature of the superconducting pairing state.
Although most neutron scattering work has focused on the 122 family of iron pnictides and iron chalcogenides, the 111 family, including Co-doped NaFeAs and LiFeAs, is equally interesting since these materials may be more correlated than the 122 family Yin et al. (2011). At present, spin waves throughout the Brillouin zone have been mapped out for NaFeAs Zhang et al. (2014a). It is important to determine how electron-doping affects the spin excitations and to compare the outcome with the pure LiFeAs and Co-doped LiFeAs. Similarly, it is important to study temperature and doping dependent spin excitations in Se-overdoped Fe1+yTe1-xSex and pure FeSe. The case of pure FeSe is particularly interesting as this is the system where the structural phase transition happens without static AF order Johnston (2010); Stewart (2011). A complete understanding of this material may reveal spin or orbital driven electronic nematic phase. Detailed experiments on other iron-based superconductors and associated materials are necessary to establish the common features of the magnetism in various materials and their connection to high- superconductivity. Neutron scattering, together with RIXS, SR, and NMR, can play a unique role in our quest to find the microscopic origin of high- superconductivity.
Acknowledgements.
The author expresses sincere appreciation to Xingye Lu and Yu Song for preparing the figures of the present manuscript. He is also in debt to David Tam, Yu Song, and Qimiao Si for a critical reading of the manuscript. The former and current graduate students/postdocs in the author’s group, including Shiliang Li, Clarina de la Cruz, Jun Zhao, Songxue Chi, Oliver Lipscombe, Leland Harriger, Miaoyin Wang, Mengshu Liu, Meng Wang, Xingye Lu, Huiqiang Luo, Chenglin Zhang, Scott Carr, and Yu Song, have played a key role in obtaining the neutron scattering results reported here. They continue to educate the author on the interesting physics in iron-based superconductors. The author is in debt to his colleagues G. F. Chen, Elbio Dagotto, Takeshi Egami, DongLai Feng, Kristjan Haule, Stephen Hayden, Jiangping Hu, Gabriel Kotliar, Jeff Lynn, Thomas Maier, Herb Mook, Andriy H. Nevidomskyy, Toby Perring, L.-P. Regnault, Qimiao Si, Yixi Su, Tomo Uemura, Nanlin Wang, Zhiping Yin, and Rong Yu for fruitful collaborations. The author also thanks Xianhui Chen, Hong Ding, M. H. Fang, , D.-H. Lee, Tao Xiang, Haihu Wen, Z. Y. Weng, X. J. Zhou, and friends in Beijing Forum for high- superconductivity for many helpful discussions over the years. The materials synthesis and neutron scattering efforts on the hole-doped 122 and 111 family of materials are supported by the U.S. DOE, Office of Basic Energy Sciences, under contract No. no. DE-SC0012311. The neutron scattering work on the electron-doped 122 family of materials is supported by U.S. NSF, DMR-1362219. The combination of RPA calculation and neutron scattering is supported by U.S. NSF, DMR-143606 and DMR-1308603. Part of the materials work at Rice University is supported by the Robert A. Welch Foundation Grants No. C-1839.References
- Abrahams and Si (2011) Abrahams, E., and Q. Si (2011), J. Phys.: Cond. Matt. 23, 223201.
- Allan et al. (2013) Allan, M. P., T.-M. Chuang, F. Massee, Y. Xie, N. Ni, S. L. Bud’ko, G. S. Boebinger, Q. Wang, D. S. Dessau, P. C. Canfield, M. S. Golden, and J. C. Davis (2013), Nat. Phys. 9, 220.
- Alloul et al. (2009) Alloul, H., J. Bobroff, M. Gabay, and P. J. Hirschfeld (2009), Rev. Mod. Phys. 81, 45.
- Allred et al. (2014) Allred, J. M., K. M. Taddei, D. E. Bugaris, S. Avci, D. Y. Chung, H. Claus, C. dela Cruz, M. G. Kanatzidis, S. Rosenkranz, R. Osborn, and O. Chmaissem (2014), Phys. Rev. B 90, 104513.
- Ament et al. (2011) Ament, L. J. P., M. van Veenendaal, T. P. Devereaux, J. P. Hill, and J. van den Brink (2011), Rev. Mod. Phys. 83, 705.
- Argyriou et al. (2010) Argyriou, D. N., A. Hiess, A. Akbari, I. Eremin, M. M. Korshunov, J. Hu, B. Qian, Z. Mao, Y. Qiu, C. Broholm, and W. Bao (2010), Phys. Rev. B 81, 220503.
- Armitage et al. (2010) Armitage, N. P., P. Fournier, and R. L. Greene (2010), Rev. Mod. Phys. 82, 2421.
- Aswathy et al. (2010) Aswathy, P. M., J. B. Anooja, P. M. Sarun, and U. Syamaprasad (2010), Supercond. Sci. Technol 23, 073001.
- Avci et al. (2013) Avci, S., J. M. Allred, O. Chmaissem, D. Y. Chung, S. Rosenkranz, J. A. Schlueter, H. Claus, A. Daoud-Aladine, D. D. Khalyavin, P. Manuel, A. Llobet, M. R. Suchomel, M. G. Kanatzidis, and R. Osborn (2013), Phys. Rev. B 88, 094510.
- Avci et al. (2014) Avci, S., O. Chmaissem, J. M. Allred, S. Rosenkranz, I. Eremin, A. V. Chubukov, D. E. Bugaris, D. Y. Chung, M. G. Kanatzidis, J.-P. Castellan, J. A. Schlueter, H. Claus, D. D. Khalyavin, P. Manuel, A. Daoud-Aladine, and R. Osborn (2014), Nat. Commun. 5, 3845.
- Avci et al. (2012) Avci, S., O. Chmaissem, D. Y. Chung, S. Rosenkranz, E. A. Goremychkin, J. P. Castellan, I. S. Todorov, J. A. Schlueter, H. Claus, A. Daoud-Aladine, D. D. Khalyavin, M. G. Kanatzidis, and R. Osborn (2012), Phys. Rev. B 85, 184507.
- Avci et al. (2011) Avci, S., O. Chmaissem, E. A. Goremychkin, S. Rosenkranz, J.-P. Castellan, D. Y. Chung, I. S. Todorov, J. A. Schlueter, H. Claus, M. G. Kanatzidis, A. Daoud-Aladine, D. Khalyavin, and R. Osborn (2011), Phys. Rev. B 83, 172503.
- Babkevich et al. (2010) Babkevich, P., M. Bendele, A. T. Boothroyd, K. Conder, S. N. Gvasaliya, R. Khasanov, E. Pomjakushina, and B. Roessli (2010), J. Phys.: Condens. Matter 22, 142202.
- Babkevich et al. (2011) Babkevich, P., B. Roessli, S. N. Gvasaliya, L.-P. Regnault, P. G. Freeman, E. Pomjakushina, K. Conder, and A. T. Boothroyd (2011), Phys. Rev. B 83, 180506(R).
- Balatsky et al. (2006) Balatsky, A. V., I. Vekhter, and J. X. Zhu (2006), Rev. Mod. Phys. 78, 373.
- Bao et al. (2011) Bao, W., Q. Z. Huang, G. F. Chen, M. A. Green, D. M. Wang, J. B. He, and Y. M. Qiu (2011), Chin. Phys. Lett. 28, 086104.
- Bao et al. (2009) Bao, W., Y. Qiu, Q. Huang, M. Green, P. Zajdel, M. Fitzsimmons, M. Zhernenkov, M. Fang, B. Qian, E. Vehstedt, J. Yang, H. Pham, L. Spinu, and Z. Mao (2009), Phys. Rev. Lett. 102, 247001.
- Bardeen et al. (1957) Bardeen, J., L. N. Cooper, and J. R. Schrieffer (1957), Phys. Rev. 108, 1175.
- Bednorz and Müller (1986) Bednorz, J. G., and K. A. Müller (1986), Z. Phys. B 64, 189.
- Bernhard et al. (2012) Bernhard, C., C. N. Wang, L. Nuccio, L. Schulz, O. Zaharko, J. Larsen, C. Aristizabal, M. Willis, A. J. Drew, G. D. Varma, T. Wolf, and C. Niedermayer (2012), Phys. Rev. B 86, 184509.
- Boothroyd et al. (2011) Boothroyd, A. T., P. Babkevich, D. Prabhakaran, and P. G. Freeman (2011), Nature 471, 341.
- Borisenko et al. (2010) Borisenko, S. V., V. B. Zabolotnyy, D. V. Evtushinsky, T. K. Kim, I. V. Morozov, A. N. Yaresko, A. A. Kordyuk, G. Behr, A. Vasiliev, R. Follath, and B. Büchner (2010), Phys. Rev. Lett. 105, 067002.
- Brand et al. (2014) Brand, J., A. Stunault, S. Wurmehl, L. Harnagea, B. Bruchner, M. Meven, and M. Braden (2014), Phys. Rev. B 89, 045141.
- Brown et al. (2010) Brown, P. J., T. Chatterji, A. Stunault, Y. Su, Y. Xiao, R. Mittal, T. Brückel, T. Wolf, and P. Adelmann (2010), Phys. Rev. B 82, 024421.
- Brydon et al. (2011) Brydon, P. M. R., M. Daghofer, C. Timm, and J. van den Brink (2011), Phys. Rev. B 83, 060501(R).
- Burrard-Lucas et al. (2013) Burrard-Lucas, M., D. G. Free, S. J. Sedlmaier, J. D. Wright, S. J. Cassidy, Y. Hara, A. J. Corkett, T. Lancaster, P. J. Baker, S. J. Blundell, and S. J. Clarke (2013), Nature Mater. 12, 15.
- Canfield and Bud’ko (2010) Canfield, P. C., and S. L. Bud’ko (2010), Annu. Rev. Condens. Matter Phys. 1, 27.
- Carr et al. (2014) Carr, S. V., D. Louca, J. Siewenie, Q. Huang, A. F. Wang, X. H. Chen, and P. C. Dai (2014), Phys. Rev. B 89, 134509.
- Castellan et al. (2011) Castellan, J.-P., S. Rosenkranz, E. A. Goremychkin, D. Y. Chung, I. S. Todorov, M. G. Kanatzidis, I. Eremin, J. Knolle, A. V. Chubukov, S. Maiti, M. R. Norman, F. Weber, H. Claus, T. Guidi, R. I. Bewley, and R. Osborn (2011), Phys. Rev. Lett. 107, 177003.
- Charnukha et al. (2012) Charnukha, A., A. Cvitkovic, T. Prokscha, D. Pr°ßopper, N. Ocelic, A. Suter, Z. Salman, E. Morenzoni, J. Deisenhofer, V. Tsurkan, A. Loidl, B. Keimer, and A. V. Boris (2012), Phys. Rev. Lett. 109, 017003.
- Chen et al. (2010a) Chen, C.-C., J. Maciejko, A. P. Sorini, B. Moritz, R. R. P. Singh, and T. P. Devereaux (2010a), Phys. Rev. B 82, 100504.
- Chen et al. (2010b) Chen, F., B. Zhou, Y. Zhang, J. Wei, H. W. Ou, J. F. Zhao, C. He, Q. Q. Ge, M. Arita, K. Shimada, H. Namatame, M. Taniguchi, Z. Y. Lu, J. P. Hu, X. Y. Cui, and D. L. Feng (2010b), Phys. Rev. B 81, 014526.
- Chen et al. (2014) Chen, X. H., P. C. Dai, D. L. Feng, T. Xiang, and F.-C. Zhang (2014), National Science Review 1, 371.
- Chen et al. (2008) Chen, Y., J. W. Lynn, J. Li, G. Li, G. F. Chen, J. L. Luo, N. L. Wang, P. C. Dai, C. de la Cruz, and H. A. Mook (2008), Phys. Rev. B 78, 064515.
- Chi et al. (2011) Chi, S. X., J. A. Rodriguez-Rivera, J. W. Lynn, C. L. Zhang, D. Phelan, D. K. Singh, R. Paul, and P. C. Dai (2011), Phys. Rev. B 84, 214407.
- Chi et al. (2009) Chi, S. X., A. Schneidewind, J. Zhao, L. W. Harriger, L. J. Li, Y. K. Luo, G. H. Cao, Z.-A. Xu, M. Loewenhaupt, J. P. Hu, and P. C. Dai (2009), Phys. Rev. Lett. 102, 107006.
- Chi et al. (2013) Chi, S. X., F. Ye, W. Bao, M. H. Fang, H. D. Wang, C. H. Dong, A. T. Savici, G. E. Granroth, M. B. Stone, and R. S. Fishman (2013), Phys. Rev. B 87, 100501.
- Christianson et al. (2008) Christianson, A. D., E. A. Goremychkin, R. Osborn, S. Rosenkranz, M. D. Lumsden, C. D. Malliakas, l. S. Todorov, H. Claus, D. Y. Chung, M. G. Kanatzidis, R. I. Bewley, and T. Guidi (2008), Nature (London) 456, 930.
- Christianson et al. (2009) Christianson, A. D., M. D. Lumsden, S. E. Nagler, G. J. MacDougall, M. A. McGuire, A. S. Sefat, R. Jin, B. C. Sales, and D. Mandrus (2009), Phys. Rev. Lett. 103, 087002.
- Chu et al. (2010) Chu, J. H., J. G. Analytis, K. D. Greve, P. L. McMahon, Z. Islam, Y. Yamamoto, and I. R. Fisher (2010), Science 329, 824.
- Chu et al. (2009) Chu, J.-H., J. G. Analytis, C. Kucharczyk, and I. R. Fisher (2009), Phys. Rev. B 79, 014506.
- Chubukov (2012) Chubukov, A. V. (2012), Annu. Rev. Condens. Matter Phys. 3, 13.
- Coldea et al. (2001) Coldea, R., S. M. Hayden, G. Aeppli, T. G. Perring, C. D. Frost, T. E. Mason, S.-W. Cheong, and Z. Fisk (2001), Phys. Rev. Lett. 86, 5377.
- de la Cruz et al. (2010) de la Cruz, C., W. Z. Hu, S. L. Li, Q. Huang, J. W. Lynn, M. A. Green, G. F. Chen, N. L. Wang, H. A. Mook, Q. Si, and P. C. Dai (2010), Phys. Rev. Lett. 104, 017204.
- de la Cruz et al. (2008) de la Cruz, C., Q. Huang, J. W. Lynn, J. Li, W. R. II, J. L. Zarestky, H. A. Mook, G. F. Chen, J. L. Luo, N. L. Wang, and P. C. Dai (2008), Nature (London) 453, 899.
- Dagotto (2013) Dagotto, E. (2013), Rev. Mod. Phys. 85, 849.
- Dahm et al. (2009) Dahm, T., V. Hinkov, S. V. Borisenko, A. A. Kordyuk, V. B. Zabolotnyy, J. Fink, B. Büchner, D. J. Scalapino, W. Hanke, and B. Keimer (2009), Nat. Phys. 5, 217.
- Dai et al. (2009) Dai, J., Q. Si, J. X. Zhu, and E. Abrahams (2009), Proc. Natl. Acad. Sci. U.S.A. 106, 4118.
- Dai et al. (2012) Dai, P. C., J. P. Hu, and E. Dagotto (2012), Nat. Phys. 8, 709.
- Dai et al. (2000) Dai, P. C., H. A. Mook, G. Aeppli, S. M. Hayden, and F. Doğan (2000), Nature (London) 406, 965.
- Dai et al. (1999) Dai, P. C., H. A. Mook, S. M. Hayden, G. Aeppli, T. G. Perring, R. D. Hunt, and F. Doğan (1999), Science 284, 1344.
- Das et al. (2014) Das, P., S.-Z. Lin, N. J. Ghimire, K. Huang, F. Ronning, E. D. Bauer, J. D. Thompson, C. D. Batista, G. Ehlers, and M. Janoschek (2014), arXiv: 1408.6585.
- Das and Balatsky (2011) Das, T., and A. V. Balatsky (2011), Phys. Rev. B 84, 014521.
- Demler and Zhang (1998) Demler, E., and S. C. Zhang (1998), Nature (London) 396, 733.
- Dhital et al. (2014) Dhital, C., T. Hogan, Z. Yamani, R. J. Birgeneau, W. Tian, M. Matsuda, A. S. Sefat, Z. Q. Wang, and S. D. Wilson (2014), Phys. Rev. B 89, 214404.
- Dhital et al. (2012) Dhital, C., Z. Yamani, W. Tian, J. Zeretsky, A. S. Sefat, Z. Q. Wang, R. J. Birgeneau, and S. D. Wilson (2012), Phys. Rev. Lett. 108, 087001.
- Diallo et al. (2009) Diallo, S. O., V. P. Antropov, T. G. Perring, C. Broholm, J. J. Pulikkotil, N. Ni, S. L. Bud’ko, P. C. Canfield, A. Kreyssig, A. I. Goldman, and R. J. McQueeney (2009), Phys. Rev. Lett. 102, 187206.
- Dioguardi et al. (2013) Dioguardi, A. P., J. Crocker, A. C. Shockley, C. H. Lin, K. R. Shirer, D. M. Nisson, M. M. Lawson, N. apRoberts Warren, P. C. Canfield, S. L. Bud’ko, S. Ran, and N. J. Curro (2013), Phys. Rev. Lett. 111, 207201.
- Dong et al. (2008) Dong, J., H. J. Zhang, G. Xu, Z. Li, G. Li, W. Z. Hu, D. Wu, G. F. Chen, X. Dai, J. L. Luo, Z. Fang, and N. L. Wang (2008), Europhy. Lett. 83, 27006.
- Duffy et al. (2000) Duffy, J. A., S. M. Hayden, Y. Maeno, Z. Mao, J. Kulda, and G. J. McIntyre (2000), Phys. Rev. Lett. 85, 5412.
- Eschrig (2006) Eschrig, M. (2006), Adv. Phys. 55, 47.
- Ewings et al. (2011) Ewings, R. A., T. G. Perring, J. Gillett, S. D. Das, S. E. Sebastian, A. E. Taylor, T. Guidi, and A. T. Boothroyd (2011), Phys. Rev. B 83, 214519.
- Fang et al. (2008) Fang, C., H. Yao, W.-F. Tsai, J. P. Hu, and S. A. Kivelson (2008), Phys. Rev. B 77, 224509.
- Fang et al. (2011) Fang, M. H., H. D. Wang, C. Dong, Z. J. Li, C.-M. Feng, J. Chen, and H. Q. Yuan (2011), Europhys. Lett. 94, 27009.
- Fawcett et al. (1994) Fawcett, E., H. L. Alberts, V. Y. Galkin, D. R. Noakes, and J. V. Yakhmi (1994), Rev. Mod. Phys. 66, 25.
- Fernandes et al. (2014) Fernandes, R. M., A. V. Chubukov, and J. Schmalian (2014), Nat. Phys. 10, 97.
- Fernandes et al. (2010) Fernandes, R. M., L. H. VanBebber, P. C. S. Bhattacharya, D. M. V. Keppens, M. A. McGuire, B. C. Sales, A. S. Sefat, and J. Schmalian (2010), Phys. Rev. Lett. 105, 157003.
- Fink et al. (2009) Fink, J., S. Thirupathaiah, R. Ovsyannikov, H. A. Durr, R. Follath, Y. Huang, S. de Jong, M. S. Golden, Y.-Z. Zhang, H. O. Jeschke, R. Valentí, C. Felser, S. D. Farahani, M. Rotter, and D. Johrendt (2009), Phys. Rev. B 79, 155118.
- Fisher et al. (2011) Fisher, I. R., L. Degiorgi, and Z. X. Shen (2011), Rep. Prog. Phys. 74, 124506.
- Fradkin and Kivelson (2012) Fradkin, E., and S. A. Kivelson (2012), Nat. Phys. 8, 864.
- Friemel et al. (2012a) Friemel, G., W. P. Liu, E. A. Goremychkin, Y. Liu, J. T. Park, O. Sobolev, C. T. Lin, B. Keimer, and D. S. Inosov (2012a), Europhys. Lett. 99, 67004.
- Friemel et al. (2012b) Friemel, G., J. T. Park, T. A. Maier, V. Tsurkan, Y. Li, J. Deisenhofer, H.-A. K. von Nidda, A. Loidl, A. Ivanov, B. Keimer, and D. S. Inosov (2012b), Phys. Rev. B 85, 140511(R).
- Fruchart et al. (1975) Fruchart, D., P. Convert, P. Wolfers, R. Madar, J. P. Senateur, and R. Fruchart (1975), Mater. Res. Bull. 10, 169.
- Fu et al. (2012) Fu, M., D. A. Torchetti, T. Imai, F. L. Ning, J.-Q. Yan, and A. S. Sefat (2012), Phys. Rev. Lett. 109, 247001.
- Fujita et al. (2012) Fujita, M., H. Hiraka, M. Matsuda, M. Matsuura, J. M. Tranquada, S. Wakimoto, G. Xu, and K. Yamada (2012), J. Phys. Soc. Jap. 81, 011007.
- Fujita et al. (2006) Fujita, M., M. Matsuda, B. Fåk, C. D. Frost, and K. Yamada (2006), J. Phys. Soc. Jpn. 75, 093704.
- Ge et al. (2013) Ge, Q. Q., Z. R. Ye, M. Xu, Y. Zhang, J. Jiang, B. P. Xie, Y. Song, C. L. Zhang, P. C. Dai, and D. L. Feng (2013), Phys. Rev. X 3, 011020.
- Gegenwart et al. (2008) Gegenwart, P., Q. Si, and F. Steglich (2008), Nat. Phys. 4, 186.
- Ghiringhelli et al. (2012) Ghiringhelli, G., M. L. Tacon, M. Minola, S. Blanco-Canosa, C. Mazzoli, N. B. Brookes, G. M. D. Luca, A. Frano, D. G. Hawthorn, F. He, T. Loew, M. M. Sala, D. C. Peets, M. Salluzzo, E. Schierle, R. Sutarto, G. A. Sawatzky, E. Weschke, B. Keimer, and L. Braicovich (2012), Science 337, 821.
- Goldman et al. (2008) Goldman, A. I., D. N. Argyriou, B. Ouladdiaf, T. Chatterji, A. Kreyssig, S. Nandi, N. Ni, S. L. Bud’ko, P. C. Canfield, and R. J. McQueeney (2008), Phys. Rev. B 78, 100506(R).
- Goldman et al. (2009) Goldman, A. I., A. Kreyssig, K. Prokes, D. K. Pratt, D. N. Argyriou, J. W. Lynn, S. Nandt, S. A. Kimber, Y. Chen, Y. B. Lee, G. Samolyuk, J. Leao, S. J. Poulton, S. L. Bud’ko, N. Ni, P. C. Canfield, B. N. Harmon, and R. J. McQueeney (2009), Phys. Rev. B 79, 024513.
- Graser et al. (2010) Graser, S., A. F. Kemper, T. A. Maier, H.-P. Cheng, P. J. Hirschfeld, and D. J. Scalapino (2010), Phys. Rev. B 81, 214503.
- Gretarsson et al. (2011) Gretarsson, H., A. Lupascu, J. H. Kim, D. Casa, T. Gog, W. Wu, S. R. Julian, Z. J. Xu, J. S. Wen, G. D. Gu, R. H. Yuan, Z. G. Chen, N.-L. Wang, S. Khim, K. H. Kim, M. Ishikado, I. Jarrige, S. Shamoto, J.-H. Chu, I. R. Fisher, and Y.-J. Kim (2011), Phys. Rev. B 84, 100509(R).
- Gretarsson et al. (2013) Gretarsson, H., S. R. Saha, T. Drye, J. Paglione, J. H. Kim, D. Casa, T. Gog, W. Wu, S. R. Julian, and Y.-J. Kim (2013), Phys. Rev. Lett. 110, 047003.
- Guo et al. (2010) Guo, J. G., S. F. Jin, G. Wang, S. C. Wang, K. H. Zhu, T. T. Zhou, M. He, and X. L. Chen (2010), Phys. Rev. B 82, 180520(R).
- Hamilton (1957) Hamilton, W. C. (1957), Acta Cryst. 10, 629.
- Han et al. (2009) Han, M. J., Q. Yin, W. E. Pickett, and S. Y. Savrasov (2009), Phys. Rev. Lett. 102, 107003.
- Harriger et al. (2012) Harriger, L. W., O. J. Lipscombe, C. L. Zhang, H. Q. Luo, M. Wang, K. Marty, M. D. Lumsden, and P. C. Dai (2012), Phys. Rev. B 85, 054511.
- Harriger et al. (2011) Harriger, L. W., H. Q. Luo, M. S. Liu, T. G. Perring, C. Frost, J. P. Hu, M. R. Norman, and P. C. Dai (2011), Phys. Rev. B 84, 054544.
- Haule and Kotliar (2009) Haule, K., and G. Kotliar (2009), New J. Phys. 11, 025021.
- Haule et al. (2008) Haule, K., J. H. Shim, and G. Kotliar (2008), Phys. Rev. Lett. 100, 226402.
- Headings et al. (2010) Headings, N. S., S. M. Hayden, R. Coldea, and T. G. Perring (2010), Phys. Rev. Lett. 105, 247001.
- Hiraishi et al. (2014) Hiraishi, M., S. Iimura, K. M. Kojima, J. Yamaura, H. Hiraka, K. Ikeda, P. Miao, Y. Ishikawa, S. Torii, M. Miyazaki, I. Yamauchi, A. Koda, K. Ishii, M. Yoshida, J. Mizuki, R. Kadono, R. Kumai, T. Kamiyama, T. Otomo, Y. Murakami, S. Matsuishi, and H. Hosono (2014), Nat. Phys. 10, 300.
- Hirschfeld et al. (2011) Hirschfeld, P. J., M. M. Korshunov, and I. I. Mazin (2011), Rep. Prog. Phys. 74, 124508.
- Hsu et al. (2008) Hsu, F. C., J. Y. Luo, K. W. Yeh, T. K. Chen, T. W. Huang, P. M. Wu, Y. C. Lee, Y. L. Huang, Y. Y. Chu, D. C. Yan, and M. K. Wu (2008), Proc. Natl. Acad. Sci. U.S.A. 105, 14262.
- Hu and Ding (2012) Hu, J. P., and H. Ding (2012), Sci. Rep. 2, 381.
- Hu et al. (2012) Hu, J. P., B. Xu, W. M. Liu, N. N. Hao, and Y. P. Wang (2012), Phys. Rev. B 85, 144403.
- Huang et al. (2008a) Huang, Q., Y. Qiu, W. Bao, M. A. Green, J. W. Lynn, Y. C. Gasparovic, T. Wu, G. Wu, and X. H. Chen (2008a), Phys. Rev. Lett. 101, 257003.
- Huang et al. (2008b) Huang, Q., J. Zhao, J. Lynn, G. Chen, J. Lou, N. Wang, and P. C. Dai (2008b), Phys. Rev. B 78, 054529.
- Hüfner et al. (2008) Hüfner, S., M. A. Hossain, A. Damascelli, and G. A. Sawatzky (2008), Rep. Prog. Phys. 71, 062501.
- Inosov et al. (2013) Inosov, D. S., G. Friemel, J. T. Park, A. C. Walters, Y. Texier, Y. Laplace, J. Bobroff, V. Hinkov, D. L. Sun, Y. Liu, R. Khasanov, K. Sedlak, P. Bourges, Y. Sidis, A. Ivanov, C. T. Lin, T. Keller, and B. Keimer (2013), Phys. Rev. B 87, 224425.
- Inosov et al. (2010) Inosov, D. S., J. T. Park, P. Bourges, D. L. Sun, Y. Sidis, A. Schneidewind, K. Hradil, D. Haug, C. T. Lin, B. Keimer, and V. Hinkov (2010), Nat. Phys. 6, 178.
- Inosov et al. (2011) Inosov, D. S., J. T. Park, A. Charnukha, Y. Li, A. V. Boris, B. Keimer, and V. Hinkov (2011), Phys. Rev. B 83, 214520.
- Ishida et al. (2013) Ishida, S., M. Nakajima, T. Liang, K. Kihou, C. H. Lee, A. Iyo, H. Eisaki, T. Kakeshita, Y. Tomioka, T. Ito, and S. Uchida (2013), Phys. Rev. Lett. 110, 207001.
- Ishikado et al. (2009) Ishikado, M., R. Kajimoto, S. Shamoto, M. Arai, A. Iyo, K. Miyazawa, P. M. Shirage, H. Kito, H. Eisaki, S. W. Kim, H. Hosono, T. Guidi, R. Bewley, and S. M. Bennington (2009), J. Phys. Soc. Jpn. 78, 043705.
- Ishikado et al. (2011) Ishikado, M., Y. Nagai, K. Kodama, R. Kajimoto, M. Nakamura, Y. Inamura, S. Wakimoto, H. Nakamura, M. Machida, K. Suzuki, H. Usui, K. Kuroki, A. Iyo, H. Eisaki, M. Arai, and S. Shamoto (2011), Phys. Rev. B 84, 144517.
- Ismer et al. (2007) Ismer, J. P., I. Eremin, E. Rossi, and D. K. Morr (2007), Phys. Rev. Lett. 99, 047005.
- Jayasekara et al. (2013) Jayasekara, W., Y. Lee, A. Pandey, G. S. Tucker, A. Sapkota, J. Lamsal, S. Calder, D. L. Abernathy, J. L. Niedziela, B. N. Harmon, A. Kreyssig, D. Vaknin, D. C. Johnston, A. I. Goldman, and R. J. McQueeney (2013), Phys. Rev. Lett. 111, 157001.
- Jesche et al. (2008) Jesche, A., N. Caroca-Canales, H. Rosner, H. Borrmann, A. Ormeci, D. Kasinathan, H. Klauss, H. Luetkens, R. Khasanov, A. Amato, A. Hoser, K. Kaneko, C. Krellner, and C. Geibel (2008), Phys. Rev. B 78, 180504.
- Jiang et al. (2009) Jiang, S., H. Xing, G. F. Xuan, C. Wang, Z. Ren, C. M. Feng, J. H. Dai, Z.-A. Xu, and G. H. Cao (2009), J. Phys.: Condens. Matter 21, 382203.
- Johnston (2010) Johnston, D. C. (2010), Adv. in Phys. 59, 803.
- Johnston et al. (2011) Johnston, D. C., R. J. McQueeney, B. Lake, A. Honecker, M. E. Zhitomirsky, R. Nath, Y. Furukawa, V. P. Antropov, and Y. Singh (2011), Phys. Rev. B 84, 094445.
- Kamihara et al. (2006) Kamihara, Y., H. Hiramatsu, M. Hirano, R. Kawamura, H. Yanagi, T. Kamiya, and H. Hosono (2006), J. Am. Chem. Soc. 128, 10012.
- Kamihara et al. (2008) Kamihara, Y., T. Watanabe, M. Hirano, and H. Hosono (2008), J. Am. Chem. Soc. 130, 3296.
- Kaneko et al. (2008) Kaneko, K., A. Hoser, N. Caroca-Canales, A. Jesche, C. Krellner, O. Stockert, and C. Geibel (2008), Phys. Rev. B 78, 212502.
- Kaneshita and Tohyama (2010) Kaneshita, E., and T. Tohyama (2010), Phys. Rev. B 82, 094441.
- Kastner et al. (1998) Kastner, M. A., R. J. Birgeneau, G. Shirane, and Y. Endoh (1998), Rev. Mod. Phys. 70, 897.
- Kim et al. (2010) Kim, M. G., A. Kreyssig, A. Thaler, D. K. Pratt, W. Tian, J. L. Zarestky, M. A. Green, S. L. Bud’ko, P. C. Canfield, R. J. McQueeney, and A. I. Goldman (2010), Phys. Rev. B 82, 22053(R).
- Kim et al. (2011) Kim, M. G., D. K. Pratt, G. E. Rustan, W. Tian, J. L. Zarestky, A. Thaler, S. L. Bud’ko, P. C. Canfield, R. J. McQueeney, A. Kreyssig, and A. I. Goldman (2011), Phys. Rev. B 83, 054514.
- Kimber et al. (2008) Kimber, S. A. J., D. N. Argyriou, F. Yokaichiya, K. Habicht, S. Gerischer, T. Hansen, T. Chatterji, R. Klingeler, C. Hess, G. Behr, A. Kondrat, and B. Büchner (2008), Phys. Rev. B 78, 140503.
- Kivelson et al. (2003) Kivelson, S. A., I. P. Bindloss, E. Fradkin, V. Oganesyan, J. M. Tranquada, A. Kapitulnik, and C. Howald (2003), Rev. Mod. Phys. 75, 1201.
- Knolle and Eremin (2013) Knolle, J., and I. Eremin (2013), In Iron-based superconductors: materials, properties, and mechanisms, Chapter 9, page 431, edited by N.-L. Wang, H. Hosono, and P. C. Dai (Pan Stanfod Publishing Pte, Ltd. Singapore ISBN 978-981-4303-22-4).
- Knolle et al. (2010) Knolle, J., I. Eremin, A. V. Chubukov, and R. Moessner (2010), Phys. Rev. B 81, 140506(R).
- Knolle et al. (2011) Knolle, J., I. Eremin, J. Schmalian, and R. Moessner (2011), Phys. Rev. B 84, 180510(R).
- Korshunov and Eremin (2008) Korshunov, M. M., and I. Eremin (2008), Phys. Rev. B 78, 140509(R).
- Kotliar et al. (2006) Kotliar, G., S. Y. Savrasov, K. Haule, V. S. Oudovenko, O. Parcollet, and C. A. Marianetti (2006), Rev. Mod. Phys. 78, 865.
- Kou et al. (2009) Kou, S.-P., T. Li, and Z.-Y. Weng (2009), Europhys. Lett. 88, 17010.
- Kreyssig et al. (2008) Kreyssig, A., M. A. Green, Y. B. Lee, G. D. Samolyuk, P. Zajdel, J. W. Lynn, S. L. Bud’ko, M. S. Torikachvili, N. Ni, S. Nandi, J. Leao, S. J. Poulton, D. N. Argyriou, B. N. Harmon, P. C. Canfield, R. J. McQueeney, and A. I. Goldman (2008), Phys. Rev. B 78, 184517.
- Kreyssig et al. (2010) Kreyssig, A., M. G. Kim, S. Nandi, D. K. Pratt, W. Tian, J. L. Zarestky, N. Ni, A. Thaler, S. L. Bud’ko, P. C. Canfield, R. J. McQueeney, and A. I. Goldman (2010), Phys. Rev. B 81, 134512.
- Krüger et al. (2009) Krüger, F., S. Kumar, J. Zaanen, and J. van den Brink (2009), Phys. Rev. B 79, 054504.
- Krzton-Maziopa et al. (2012) Krzton-Maziopa, A., E. V. Pomjakushina, V. Y. Pomjakushin, F. von Rohr, A. Schilling, and K. Conder (2012), J. Phys.: Condens. Matter 24, 382202.
- Ksenofontov et al. (2011) Ksenofontov, V., G. Wortmann, S. A. Medvedev, V. Tsurkan, J. Deisenhofer, A. Loidl, and C. Felser (2011), Phys. Rev. B 84, 180508.
- Kuroki et al. (2008) Kuroki, K., S. Onari, R. Arita, H. Usui, Y. Tanaka, H. Kontani, and H. Aoki (2008), Phys. Rev. Lett. 101, 087004.
- Lamsal et al. (2013) Lamsal, J., G. S. Tucker, T. W. Heitmann, A. Kreyssig, A. Jesche, A. Pandey, W. Tian, R. J. McQueeney, D. C. Johnston, and A. I. Goldman (2013), Phys. Rev. B 87, 144418.
- Lang et al. (2010) Lang, G., H.-J. Grafe, D. Paar, F. Hammerath, K. Manthey, G. Behr, J. Werner, and B. Büchner (2010), Phys. Rev. Lett. 104, 097001.
- Lee et al. (2009) Lee, C. C., W. G. Yin, and W. Ku (2009), Phys. Rev. Lett. 103, 267001.
- Lee et al. (2011) Lee, C. H., K. Kihou, H. Kawano-Furukawa, T. Saito, A. Iyo, H. Eisaki, H. Fukazawa, Y. Kohori, K. Suzuki, H. Usui, K. Kuroki, and K. Yamada (2011), Phys. Rev. Lett. 106, 067003.
- Lee et al. (2013a) Lee, C. H., P. Steffens, N. Qureshi, M. Nakajima, K. Kihou, A. Iyo, H. Eisaki, and M. Braden (2013a), Phys. Rev. Lett. 111, 167002.
- Lee et al. (2006) Lee, P. A., N. Nagaosa, and X. G. Wen (2006), Rev. Mod. Phys. 78, 17.
- Lee et al. (2010) Lee, S.-H., G. Xu, W. Ku, J. S. Wen, C. C. Lee, N. Katayama, Z. J. Xu, S. Ji, Z. W. Lin, G. D. Gu, H.-B. Yang, P. D. Johnson, Z.-H. Pan, T. Valla, M. Fujita, T. J. Sato, S. Chang, K. Yamada, and J. M. Tranquada (2010), Phys. Rev. B 81, 220502.
- Lee et al. (2013b) Lee, W. S., J. J. Lee, E. A. Nowadnick, S. Gerber, W. Tabis, S. W. Huang, V. N. Strocov, E. M. Motoyama, G. Yu, B. Moritz, H. Y. Huang, R. P. Wang, Y. B. Huang, W. B. Wu, C. T. Chen, D. J. Huang, M. Greven, T. Schmitt, Z. X. Shen, and T. P. Devereaux (2013b), arXiv: 1308.4740.
- Leiner et al. (2014) Leiner, J., V. Thampy, A. D. Christianson, D. L. Abernathy, M. B. Stone, M. D. Lumsden, A. S. Sefat, B. C. Sales, J. Hu, Z. Q. Mao, W. Bao, and C. Broholm (2014), Phys. Rev. B 90, 100501(R).
- Leliévre-Berna et al. (2005) Leliévre-Berna, E., E. Bourgeat-Lami, P. Fouilloux, B. Geffray, Y. Gibert, K. Kakurai, N. Kernavanois, B. Longuet, F. Mantegezza, M. Nakamura, S. Pujol, L.-P. Regnault, F. Tasset, M. Takeda, M. Thomas, and X. Tonon (2005), Physica B 356, 131.
- Leong et al. (2014) Leong, Z. D., W.-C. Lee, W. Lv, and P. Phillips (2014), Phys. Rev. B 90, 125158.
- Lester et al. (2009) Lester, C., J.-H. Chu, J. G. Analytis, S. C. Capelli, A. S. Erickson, C. L. Condron, M. F. Toney, I. R. Fisher, and S. M. Hayden (2009), Phys. Rev. B 79, 144523.
- Lester et al. (2010) Lester, C., J. H. Chu, J. G. Analytis, T. G. Perring, I. R. Fisher, and S. M. Hayden (2010), Phys. Rev. B 82, 064505.
- Lester et al. (2011) Lester, C., J.-H. Chu, J. G. Analytis, A. Stunault, I. R. Fisher, and S. M. Hayden (2011), Phys. Rev. B 84, 134514.
- Li et al. (2009a) Li, L. J., Y. K. Luo, Q. B. Wang, H. Chen, Z. Ren, Q. Tao, Y. K. Li, X. Lin, M. He, Z. W. Zhu, G. H. Cao, and Z.-A. Xu (2009a), New J. Phys. 11, 025008.
- Li et al. (2009b) Li, S. L., Y. Chen, S. Chang, J. W. Lynn, L. J. Li, Y. K. Luo, G. H. Cao, Z. A. Xu, and P. C. Dai (2009b), Phys. Rev. B 79, 174527.
- Li et al. (2009c) Li, S. L., C. de la Cruz, Q. Huang, G. F. Chen, T.-L. Xia, J. L. Luo, N. L. Wang, and P. C. Dai (2009c), Phys. Rev. B 80, 020504(R).
- Li et al. (2009d) Li, S. L., C. de la Cruz, Q. Huang, Y. Chen, J. W. Lynn, J. Hu, Y.-L. Huang, F.-C. Hsu, K.-W. Yeh, M.-K. Wu, and P. C. Dai (2009d), Phys. Rev. B 79, 054503.
- Li et al. (2011a) Li, S. L., X. Y. Lu, M. Wang, H.-Q. Luo, M. Y. Wang, C. L. Zhang, E. Faulhaber, L. P. Regnault, S. Chang, and P. C. Dai (2011a), Phys. Rev. B 84, 024518.
- Li et al. (2010) Li, S. L., C. L. Zhang, M. Wang, H.-Q. Luo, X. Y. Lu, E. Faulhaber, A. Schneidewind, P. Link, J. P. Hu, T. Xiang, and P. C. Dai (2010), Phys. Rev. Lett. 105, 157002.
- Li et al. (2011b) Li, W., H. Ding, P. Deng, K. Chang, C. L. Song, K. He, L. L. Wang, X. C. Ma, J. P. Hu, X. Chen, and Q. K. Xue (2011b), Nat. Phys. 8, 126.
- Lipscombe et al. (2011) Lipscombe, O. J., G. F. Chen, C. Fang, T. G. Perring, D. L. Abernathy, A. D. Christianson, T. Egami, N. L. Wang, J. P. Hu, and P. C. Dai (2011), Phys. Rev. Lett. 106, 057004.
- Lipscombe et al. (2010) Lipscombe, O. J., L. W. Harriger, P. G. Freeman, M. Enderle, C. L. Zhang, M. Y. Wang, T. Egami, J. P. Hu, T. Xiang, M. R. Norman, and P. C. Dai (2010), Phys. Rev. B 82, 064515.
- Lipscombe et al. (2007) Lipscombe, O. J., S. M. Hayden, B. Vignolle, D. F. McMorrow, and T. G. Perring (2007), Phys. Rev. Lett. 99, 067002.
- Liu et al. (2012a) Liu, M. S., L. W. Harriger, H. Q. Luo, M. Wang, R. A. Ewings, T. Guidi, H. Park, K. Haule, G. Kotliar, M. Hayden, and P. C. Dai (2012a), Nat. Phys. 8, 376.
- Liu et al. (2012b) Liu, M. S., C. Lester, J. Kulda, X. Y. Lu, H. Q. Luo, M. Wang, S. M. Hayden, and P. C. Dai (2012b), Phys. Rev. B 85, 214516.
- Liu et al. (2010) Liu, T. J., J. Hu, B. Qian, D. Fobes, W. B. Z. Q. Mao, M. Reehuis, S. A. J. Kimber, K. Proke, S. Matas, D. N. Argyriou, A. Hiess, A. Rotaru, H. Pham, L. Spinu, Y. Qiu, V. Thampy, A. T. Savici, J. A. Rodriguez, and C. Broholm (2010), Nat. Mater. 9, 718.
- Liu et al. (2011) Liu, Z.-H., P. Richard, K. Nakayama, G.-F. Chen, S. Dong, J.-B. He, D.-M. Wang, T.-L. Xia, K. Umezawa, T. Kawahara, S. Souma, T. Sato, T. Takahashi, T. Qian, Y. B. Huang, N. Xu, Y. B. Shi, H. Ding, and S.-C. Wang (2011), Phys. Rev. B 84, 064519.
- v. Löhneysen et al. (2007) v. Löhneysen, H., A. Rosch, M. Vojta, and P. Wölfle (2007), Rev. Mod. Phys. 79, 1015.
- Lu et al. (2013) Lu, X. Y., H. Gretarsson, R. Zhang, X. R. Liu, H. Q. Luo, W. Tian, M. Laver, Z. Yamani, Y.-J. Kim, A. H. Nevidomskyy, Q. Si, and P. C. Dai (2013), Phys. Rev. Lett. 110, 257001.
- Lu et al. (2014a) Lu, X. Y., J. T. Park, R. Zhang, H. Q. Luo, A. H. Nevidomskyy, Q. Si, and P. C. Dai (2014a), Science 345, 657.
- Lu et al. (2014b) Lu, X. Y., D. W. Tam, C. L. Zhang, H. Q. Luo, M. Wang, R. Zhang, L. W. Harriger, T. Keller, B. Keimer, L.-P. Regnault, T. A. Maier, and P. C. Dai (2014b), Phys. Rev. B 90, 024509.
- Lumsden and Christianson (2010) Lumsden, M. D., and A. D. Christianson (2010), J. Phys.: Condens. Matter 22, 203203.
- Lumsden et al. (2010) Lumsden, M. D., A. D. Christianson, E. A. Goremychkin, S. E. Nagler, H. A. Mook, M. B. Stone, D. L. Abernathy, T. Guidi, G. J. MacDougall, C. de la Cruz, M. A. M. A. S. Sefat, B. C. Sales, and D. Mandrus (2010), Nat. Phys. 6, 182.
- Lumsden et al. (2009) Lumsden, M. D., A. D. Christianson, D. Parshall, M. B. Stone, S. E. Nagler, G. J. MacDougall, H. A. Mook, K. Lokshin, T. Egami, D. L. Abernathy, E. A. Goremychkin, R. Osborn, M. A. McGuire, A. S. Sefat, R. Jin, B. C. Sales, and D. Mandrus (2009), Phys. Rev. Lett. 102, 107005.
- Luo et al. (2013a) Luo, H. Q., X. Y. Lu, R. Zhang, M. Wang, E. A. Goremychkin, D. T. Adroja, S. Danilkin, G. C. Deng, Z. Yamani, and P. C. Dai (2013a), Phys. Rev. B 88, 144516.
- Luo et al. (2013b) Luo, H. Q., M. Wang, C. L. Zhang, X. Y. Lu, L.-P. Regnault, R. Zhang, S. L. Li, J. P. Hu, and P. C. Dai (2013b), Phys. Rev. Lett. 111, 107006.
- Luo et al. (2012a) Luo, H. Q., Z. Yamani, Y. C. Chen, X. Y. Lu, M. Wang, S. L. Li, T. A. Maier, S. Danilkin, D. T. Adroja, and P. C. Dai (2012a), Phys. Rev. B 86, 024508.
- Luo et al. (2012b) Luo, H. Q., R. Zhang, M. Laver, Z. Yamani, M. Wang, X. Y. Lu, M. Y. Wang, Y. C. Chen, S. L. Li, S. Chang, J. W. Lynn, and P. C. Dai (2012b), Phys. Rev. Lett. 108, 247002.
- Luo et al. (2010) Luo, Y. K., Y. K. Li, S. Jiang, J. H. Dai, G. H. Cao, and Z.-A. Xu (2010), Phys. Rev. B 81, 134422.
- Lv et al. (2010) Lv, W., F. Krüger, and P. Phillips (2010), Phys. Rev. B 82, 045125.
- Lv et al. (2014) Lv, W. C., A. Moreo, and E. Dagotto (2014), Phys. Rev. B 89, 104510.
- Lv et al. (2009) Lv, W. C., J. S. Wu, and P. Phillips (2009), Phys. Rev. B 80, 224506.
- Lynn and Dai (2009) Lynn, J. W., and P. C. Dai (2009), Physica C 469, 469.
- Ma and Lu (2008) Ma, F., and Z.-Y. Lu (2008), Phys. Rev. B 78, 033111.
- Mackenzie and Maeno (2003) Mackenzie, A. P., and Y. Maeno (2003), Rev. Mod. Phys. 75, 657.
- Maier et al. (2011) Maier, T. A., S. Graser, P. J. Hirschfeld, and D. J. Scalapino (2011), Phys. Rev. B 83, 100515(R).
- Maier et al. (2009) Maier, T. A., S. Graser, D. J. Scalapino, and P. Hirschfeld (2009), Phys. Rev. B 79, 134520.
- Maier and Scalapino (2008) Maier, T. A., and D. J. Scalapino (2008), Phys. Rev. B 78, 020514(R).
- Mannella (2014) Mannella, N. (2014), J. Phys.: Condens. Matter 26, 473202.
- Marty et al. (2011) Marty, K., A. D. Christianson, C. H. Wang, M. Matsuda, H. Cao, L. H. VanBebber, J. L. Zarestky, D. J. Singh, A. S. Sefat, and M. D. Lumsden (2011), Phys. Rev. B 83, 060509 (R).
- Matan et al. (2009) Matan, K., R. Morinaga, K. Iida, and T. J. Sato (2009), Phys. Rev. B 79, 054526.
- Mathias et al. (1958) Mathias, B. T., H. Suhl, and E. Corenzwit (1958), Phys. Rev. Lett. 1, 92.
- May et al. (2012) May, A. F., M. A. McGuire, H. B. Cao, I. Sergueev, C. Cantoni, B. C. Chakoumakos, D. S. Parker, and B. C. Sales (2012), Phys. Rev. Lett. 109, 077003.
- Mazin (2010) Mazin, I. I. (2010), Nature 464, 183.
- Mazin et al. (2008) Mazin, I. I., D. J. Singh, M. D. Johannes, and M. H. Du (2008), Phys. Rev. Lett. 101, 057003.
- McGuire et al. (2008) McGuire, M., A. Christianson, A. Sefat, B. Sales, M. Lumsden, R. Jin, E. Payzant, D. Mandrus, Y. Luan, V. Keppens, V. Varadarajan, J. Brill, R. Hermann, M. T. Sougrati, F. Grandjean, and G. Long (2008), Phys. Rev. B 78, 094517.
- McQueeney et al. (2008) McQueeney, R. J., S. O. Diallo, V. P. Antropov, G. D. Samolyuk, C. Broholm, N. Ni, S. Nandi, M. Yethiraj, J. L. Zarestky, J. J. Pulikkotil, A. Kreyssig, M. D. Lumsden, B. N. Harmon, P. C. Canfield, and A. I. Goldman (2008), Phys. Rev. Lett. 101, 227205.
- Mook et al. (2010) Mook, H. A., M. D. Lumsden, A. D. Christianson, S. E. Nagler, B. C. Sales, R. Y. Jin, M. A. McGuire, A. S. Sefat, D. Mandrus, T. Egami, and C. de la Cruz (2010), Phys. Rev. Lett. 104, 187002.
- Mook et al. (1993) Mook, H. A., M. Yethiraj, G. Aeppli, T. E. Mason, and T. Armstrong (1993), phys. Rev. Lett. 70, 3490.
- Moon et al. (1969) Moon, R. M., T. Riste, and W. C. Koehler (1969), Phys. Rev. 181, 920.
- Moreo et al. (2009) Moreo, A., M. Daghofer, J. A. Riera, and E. Dagotto (2009), Phys. Rev. B 79, 134502.
- Mou et al. (2011) Mou, D., S. Liu, X. Jia, J. He, Y. Peng, L. Zhao, L. Yu, G. Liu, S. He, X. Dong, J. Zhang, H. Wang, C. Dong, M. Fang, X. Wang, Q. Peng, Z. Wang, S. Zhang, F. Yang, Z. Xu, C. Chen, and X. J. Zhou (2011), Phys. Rev. Lett. 106, 107001.
- Nakayama et al. (2010) Nakayama, K., T. Sato, P. Richard, T. Kawahara, Y. Sekiba, T. Qian, G. F. Chen, J. L. Luo, N. L. Wang, H. Ding, and T. Takahashi (2010), Phys. Rev. Lett. 105, 197001.
- Nandi et al. (2010) Nandi, S., M. G. Kim, A. Kreyssig, R. M. Fernandes, D. K. Pratt, A. Thaler, N. Ni, S. L. Budko, P. C. Canfield, J. Schmalian, R. J. McQueeney, and A. I. Goldman (2010), Phys. Rev. Lett. 104, 057006.
- Ning et al. (2008) Ning, F. L., K. Ahilan, T. Imai, A. S. Sefat, R. Jin, M. A. McGuire, B. C. Sales, and D. Mandrus (2008), J. Phys. Soc. Jpn. 77, 103705.
- Ning et al. (2009) Ning, F. L., K. Ahilan, T. Imai, A. S. Sefat, R. Jin, M. A. Mcquire, B. C. Sales, and D. Mandrus (2009), J. Phys. Soc. Jpn. 78, 013711.
- Ning et al. (2010) Ning, F. L., K. Ahilan, T. Imai, A. S. Sefat, M. A. McGuire, B. C. Sales, D. Mandrus, P. Cheng, B. Shen, and H.-H. Wen (2010), Phys. Rev. Lett. 104, 037001.
- Nomura et al. (2008) Nomura, T., S. W. Kim, Y. Kamihara, M. Hirano, P. V. Sushko, K. Kato, M. Takata, A. L. Shluger, and H. Hosono (2008), Supercond. Sci. Technol. 21, 125028.
- Oh et al. (2011) Oh, S., A. M. Mounce, S. Mukhopadhyay, W. P. Halperin, A. B. Vorontsov, S. L. Bud’ko, P. C. Canfield, Y. Furukawa, A. P. Reyes, and P. L. Kuhns (2011), Phys. Rev. B 83, 214501.
- Ota et al. (2014) Ota, Y., K. Okazaki, Y. Kotani, T. Shimojima, W. Malaeb, S. Watanabe, C.-T. Chen, K. Kihou, C. H. Lee, A. Iyo, H. Eisaki, T. Saito, H. Fukazawa, Y. Kohori, and S. Shin (2014), Phys. Rev. B 89, 081103(R).
- Paglione and Greene (2010) Paglione, J., and R. L. Greene (2010), Nat. Phys. 6, 645.
- Park et al. (2011a) Park, H., K. Haule, and G. Kotliar (2011a), Phys. Rev. Lett. 107, 137007.
- Park et al. (2011b) Park, J. T., G. Friemel, Y. Li, J.-H. Kim, V. Tsurkan, J. Deisenhofer, H.-A. K. von Nidda, A. Loidl, A. Ivanov, B. Keimer, and D. S. Inosov (2011b), Phys. Rev. Lett. 107, 177005.
- Park et al. (2012) Park, J. T., G. Friemel, T. Loew, V. Hinkov, Y. Li, B. H. Min, D. L. Sun, A. Ivanov, A. Piovano, C. T. Lin, B. Keimer, Y. S. Kwon, and D. S. Inosov (2012), Phys. Rev. B 86, 024437.
- Park et al. (2010) Park, J. T., D. S. Inosov, A. Yaresko, S. Graser, D. L. Sun, P. Bourges, Y. Sidis, Y. Li, J. H. Kim, D. Haug, A. Ivanov, K. Hradil, A. Schneidewind, P. Link, E. Faulhaber, I. Glavatskyy, C. T. Lin, B. Keimer, and V. Hinkov (2010), Phys. Rev. B 82, 134503.
- Parker et al. (2010) Parker, D. R., M. J. P. Smith, T. Lancaster, A. J. Steele, I. Franke, P. J. Baker, F. L. Pratt, M. J. Pitcher, S. J. Blundell, and S. J. Clarke (2010), Phys. Rev. Lett. 104, 057007.
- Pitcher et al. (2008) Pitcher, M. J., D. R. Parker, P. Adamson, S. J. C. Herkelrath, A. T. Boothroyd, R. M. Ibberson, M. Brunelli, and S. J. Clarke (2008), Chem. Commun. 45, 5918.
- Plumb et al. (2014) Plumb, K. W., A. T. Savici, G. E. Granroth, F. C. Chou, and Y.-J. Kim (2014), Phys. Rev. B 89, 180410(R).
- Pramanik et al. (2011) Pramanik, A. K., M. Abdel-Hafiez, S. Aswartham, A. U. B. Wolter, S. Wurmehl, V. Kataev, and B. Büchner (2011), Phys. Rev. B 84, 064525.
- Pratt et al. (2011) Pratt, D. K., M. G. Kim, A. Kreyssig, Y. B. Lee, G. S. Tucker, W. T. A. Thaler, J. L. Zarestky, S. L. Bud’ko, P. C. Canfield, B. N. Harmon, A. I. Goldman, and R. J. McQueeney (2011), Phys. Rev. Lett. 106, 257001.
- Pratt et al. (2009) Pratt, D. K., W. Tian, A. Kreyssig, J. L. Zarestky, S. Nandi, N. Ni, S. L. Bud’ko, P. C. Canfield, A. I. Goldman, and R. J. McQueeney (2009), Phys. Rev. Lett. 103, 087001.
- Qazilbash et al. (2009) Qazilbash, M. M., J. J. Hamlin, R. E. Baumbach, L. Zhang, D. J. Singh, M. B. Maple, and D. N. Basov (2009), Nat. Phys. 5, 709.
- Qian et al. (2011) Qian, T., X.-P. Wang, W.-C. Jin, P. Zhang, P. Richard, G. Xu, X. Dai, Z. Fang, J.-G. Guo, X.-L. Chen, and H. Ding (2011), Phys. Rev. Lett. 106, 187001.
- Qiu et al. (2008) Qiu, Y. M., W. Bao, Q. Huang, T. Yildirim, J. M. Simmons, M. A. Green, J. W. Lynn, Y. C. Gasparovic, J. Li, T. Wu, G. Wu, and X. H. Chen (2008), Phys. Rev. Lett. 101, 257002.
- Qiu et al. (2009) Qiu, Y. M., W. Bao, Y. Zhao, C. Broholm, V. Stanev, Z. Tesanovic, Y. C. Gasparovic, S. Chang, J. Hu, B. Qian, M. H. Fang, and Z. Q. Mao (2009), Phys. Rev. Lett. 103, 067008.
- Quirinale et al. (2013) Quirinale, D. G., V. K. Anand, M. G. Kim, A. Pandey, A. Huq, P. W. Stephens, T. W. Heitmann, A. Kreyssig, R. J. McQueeney, D. C. Johnston, and A. I. Goldman (2013), Phys. Rev. B 88, 174420.
- Qureshi et al. (2010) Qureshi, N., Y. Drees, J. Werner, S. Wurmehl, C. Hess, R. Klingeler, B. Büchner, M. T. Fernández-Díaz, and M. Braden (2010), Phys. Rev. B 10, 184521.
- Qureshi et al. (2014a) Qureshi, N., C. H. Lee, K. Kihou, K. Schmalzl, P. Steffens, and M. Braden (2014a), Phys. Rev. B 90, 100502(R).
- Qureshi et al. (2012a) Qureshi, N., P. Steffens, Y. Drees, A. C. Komarek, D. Lamago, Y. Sidis, L. Harnagea, H.-J. Grafe, S. Wurmehl, B. Büchner, and M. Braden (2012a), Phys. Rev. Lett. 108, 117001.
- Qureshi et al. (2014b) Qureshi, N., P. Steffens, D. Lamago, Y. Sidis, O. Sobolev, R. A. Ewings, L. Harnagea, S. Wurmehl, B. Büchner, and M. Braden (2014b), Phys. Rev. B 90, 144503.
- Qureshi et al. (2012b) Qureshi, N., P. Steffens, S. Wurmehl, S. Aswartham, B. Bchner, and M. Braden (2012b), Phys. Rev. B 86, 060410(R).
- Ramazanoglu et al. (2013) Ramazanoglu, M., J. Lamsal, G. S. Tucker, J.-Q. Yan, S. Calder, T. Guidi, T. Perring, R. W. McCallum, T. A. Lograsso, A. Kreyssig, A. I. Goldman, and R. J. McQueeney (2013), Phys. Rev. B 87, 140509(R).
- Raymond et al. (2012) Raymond, S., K. Kaneko, A. Hiess, P. Steffens, and G. Lapertot (2012), Phys. Rev. Lett. 109, 237210.
- Ricci et al. (2011) Ricci, A., N. Poccia, G. Campi, B. Joseph, G. Arrighetti, L. Barba, M. Reynolds, M. Burghammer, H. Takeya, Y. Mizuguchi, Y. Takano, M. Colapietro, N. L. Saini, and A. Bianconi (2011), Phys. Rev. B 84, 060511.
- Richard et al. (2011) Richard, P., T. Sato, K. Nakayama, T. Takahashi, and H. Ding (2011), Rep. Prog. Phys. 74, 124512.
- Rodriguez et al. (2013) Rodriguez, E. E., D. A. Sokolov, C. Stock, M. A. Green, O. Sobolev, J. A. Rodriguez-Rivera, H. Cao, and A. Daoud-Aladine (2013), Phys. Rev. B 88, 165110.
- Rodriguez et al. (2011) Rodriguez, E. E., C. Stock, P. Zajdel, K. L. Krycka, C. F. Majkrzak, P. Zavalij, and M. A. Green (2011), Phys. Rev. B 84, 064403.
- Rodriguez et al. (2010) Rodriguez, E. E., P. Zavalij, P.-Y. Hsieh, and M. A. Green (2010), J. Am. Chem. Soc. 132, 10006.
- Rossat-Mignod et al. (1991) Rossat-Mignod, J., L. P. Regnault, C. Vettier, P. Bourges, P. Burlet, J. Bossy, J. Y. Henry, and G. Lapertot (1991), Physica C 185, 86.
- Rotter et al. (2008a) Rotter, M., M. Tegel, and D. Johrendt (2008a), Phys. Rev. Lett. 101, 107006.
- Rotter et al. (2008b) Rotter, M., M. Tegel, I. Schellenberg, W. Hermes, R. Pöttgen, and D. Johrendt (2008b), Phys. Rev. B 78, 020503(R).
- Rowe et al. (2012) Rowe, W., J. Knolle, I. Eremin, and P. J. Hirschfeld (2012), Phys. Rev. B 86, 134513.
- Rueff and Shukla (2010) Rueff, J.-P., and A. Shukla (2010), Phys. Mod. Phys. 82, 847.
- Sadovskii (2008) Sadovskii, M. V. (2008), Physics Uspekhi 51, 1201.
- Sato et al. (2001) Sato, N. K., N. Aso, K. Miyake, R. Shiina, P. Thalmeier, G. Varelogiannis, C. Geibel, F. Steglich, P. Fulde, and T. Komatsubara (2001), Nature (London) 410, 340.
- Scalapino (2012) Scalapino, D. J. (2012), Rev. Mod. Phys. 84, 1383.
- Scalapino and White (1998) Scalapino, D. J., and S. R. White (1998), Phys. Rev. B 58, 8222.
- Sefat et al. (2008) Sefat, A. S., R. Jin, M. A. McGuire, B. C. Sales, D. J. Singh, and D. Mandrus (2008), Phys. Rev. Lett. 101, 117004.
- Sefat et al. (2009) Sefat, A. S., D. J. Singh, L. H. V. Bebber, Y. Mozharivskyj, M. A. McGuire, R. Jin, B. C. Sales, V. Keppens, and D. Mandrus (2009), Phys. Rev. B 79, 224524.
- Shamoto et al. (2010) Shamoto, S., M. Ishikado, A. D. Christianson, M. D. Lumsden, S. Wakimoto, K. Kodama, A. Iyo, and M. Arai (2010), Phys. Rev. B 82, 172508.
- Shermadini et al. (2012) Shermadini, Z., H. Luetkens, R. Khasanov, A. Krzton-Maziopa, K. Conder, E. Pomjakushina, H.-H. Klauss, and A. Amato (2012), Phys. Rev. B 85, 100501(R).
- Shibauchi et al. (2014) Shibauchi, T., A. Carrington, and Y. Matsuda (2014), Annu. Rev. Condens. Matter Phys. 5, 113.
- Shoemaker et al. (2012) Shoemaker, D. P., D. Y. Chung, H. Claus, M. C. Francisco, S. Avci, A. Llobet, and M. G. Kanatzidis (2012), Phys. Rev. B 86, 184511.
- Shull and Wedgewood (1966) Shull, C. G., and F. A. Wedgewood (1966), Phys. Rev. Lett. 16, 513.
- Si and Abrahams (2008) Si, Q., and E. Abrahams (2008), Phys. Rev. Lett. 101, 076401.
- Sidis et al. (2000) Sidis, Y., P. Bourges, H. F. Fong, B. Keimer, L. P. Regnault, J. Bossy, A. Ivanov, B. Hennion, P. Gautier-Picard, G. Collin, D. L. Millius, and I. A. Aksay (2000), Phys. Rev. Lett. 84, 5900.
- Simonson et al. (2012) Simonson, J. W., Z. P. Yin, M. Pezzoli, J. Guo, J. Liu, K. Post, A. Efimenko, N. Hollmann, Z. Hu, H.-J. Lin, C.-T. Chen, C. Marques, V. Levya, G. Smith, J. W. Lynn, L. L. Sun, G. Kotliar, D. N. Basov, L. H. Tjeng, and M. C. Aronsen (2012), Proc. Natl. Acad. Sci. U.S.A. 109, E1815.
- Singh et al. (2009) Singh, Y., M. A. Green, Q. Huang, A. Kreyssig, R. J. McQueeney, D. C. Johnston, and A. I. Goldman (2009), Phys. Rev. B 80, 100403(R).
- Soh et al. (2013) Soh, J. H., G. S. Tucker, D. K. Pratt, D. L. Abernathy, M. B. Stone, S. Ran, S. L. Bud’ko, P. C. Canfield, A. Kreyssig, R. J. McQueeney, and A. I. Goldman (2013), Phys. Rev. Lett. 111, 227002.
- Song et al. (2013a) Song, Y., S. V. Carr, X. Y. Lu, C. L. Zhang, Z. C. Sims, N. F. Luttrell, S. Chi, Y. Zhao, J. W. Lynn, and P. C. Dai (2013a), Phys. Rev. B 87, 184511.
- Song et al. (2013b) Song, Y., L.-P. Regnault, C. L. Zhang, G. T. Tan, S. V. Carr, S. X. Chi, A. D. Christianson, T. Xiang, and P. C. Dai (2013b), Phys. Rev. B 88, 134512.
- Speller et al. (2012) Speller, S. C., T. B. Britton, G. M. Hughes, A. Krzton-Maziopa, E. Pomjakushina, K. Conder, A. T. Boothroyd, and C. R. M. Grovenor (2012), Supercond. Sci. Technol. 25, 084023.
- Steffens et al. (2013) Steffens, P., C. H. Lee, N. Qureshi, K. Kihou, A. Iyo, H. Eisaki, and M. Braden (2013), Phys. Rev. Lett. 110, 137001.
- Steglich et al. (1979) Steglich, F., J. Aarts, C. D. Bredl, W. Lieke, D. Meschede, W. Franz, and H. Schafer (1979), Phys. Rev. Lett. 43, 1892.
- Stewart (2001) Stewart, G. R. (2001), Rev. Mod. Phys. 73, 797.
- Stewart (2011) Stewart, G. R. (2011), Rev. Mod. Phys. 83, 1589.
- Stock et al. (2008) Stock, C., C. Broholm, J. Hudis, H. J. Kang, and C. Petrovic (2008), Phys. Rev. Lett. 100, 087001.
- Stock et al. (2012) Stock, C., C. Broholm, Y. Zhao, F. Demmel, H. J. Kang, K. C. Rule, and C. Petrovic (2012), Phys. Rev. Lett. 109, 167207.
- Stock et al. (2010) Stock, C., R. A. Cowley, W. J. L. Buyers, C. D. Frost, J. W. Taylor, D. Peets, R. Liang, D. Bonn, and W. N. Hardy (2010), Phys. Rev. B 82, 174505.
- Stock et al. (2011) Stock, C., E. E. Rodriguez, M. A. Green, P. Zavalij, and J. A. Rodriguez-Rivera (2011), Phys. Rev. B 84, 045124.
- Stock et al. (2014) Stock, C., E. E. Rodriguez, O. Sobolev, J. A. Rodriguez-Rivera, R. A. Ewings, J. W. Taylor, A. D. Christianson, and M. A. Green (2014), Phys. Rev. B 90, 121113(R).
- Stockert et al. (2011) Stockert, O., J. Arndt, E. Faulhaber, C. Geibel, H. S. Jeevan, S. Kirchner, M. Loewenhaupt, K. Schmalzl, W. Schmidt, Q. Si, and F. Steglich (2011), Nat. Phys. 7, 119.
- Subedi et al. (2008) Subedi, A., L. J. Zhang, D. J. Singh, and M. H. Du (2008), Phys. Rev. B 78, 134514.
- Suchaneck et al. (2010) Suchaneck, A., V. Hinkov, D. Haug, L. Schulz, C. Bernhard, A. Ivanov, K. Hradil, C. T. Lin, P. Bourges, B. Keimer, and Y. Sidis (2010), Phys. Rev. Lett. 105, 037207.
- Tacon et al. (2011) Tacon, M. L., G. Ghiringhelli, J. Chaloupka, M. M. Sala, V. Hinkov, M. W. Haverkort, M. Minola, M. Bakr, K. J. Zhou, S. Blanco-Canosa, C. Monney, Y. T. Song, G. L. Sun, C. T. Lin, G. M. D. Luca, M. Salluzzo, G. Khaliullin, T. Schmitt, L. Braicovich, and B. Keimer (2011), Nat. Phys. 7, 725.
- Tafti et al. (2013) Tafti, F. F., A. Juneau-Fecteau, M.-È. Delage, S. R. de Cotret, J.-P. Reid, A. F. Wang, X.-G. Luo, X. H. Chen, N. Doiron-Leyraud, and L. Taillefer (2013), Nat. Phys. 9, 349.
- Tan et al. (2013) Tan, G. T., P. Zheng, X. C. Wang, Y. C. Chen, X. T. Zhang, J. L. Luo, T. Netherton, Y. Song, P. C. Dai, C. L. Zhang, and S. L. Li (2013), Phys. Rev. B 87, 144512.
- Tanatar et al. (2010) Tanatar, M. A., E. C. Blomberg, A. Kreyssig, M. G. Kim, N. Ni, A. Thaler, S. L. Bud’ko, P. C. Canfield, A. I. Goldman, I. I. Mazin, and R. Prozorov (2010), Phys. Rev. B 81, 184508.
- Tanatar et al. (2012) Tanatar, M. A., N. Spyrison, K. Cho, E. C. Blomberg, G. T. Tan, P. C. Dai, C. L. Zhang, and R. Prozorov (2012), Phys. Rev. B 85, 014510.
- Tapp et al. (2008) Tapp, J. H., Z. J. Tang, B. Lv, K. Sasmal, B. Lorenz, P. C. W. Chu, and A. M. Guloy (2008), Phys. Rev. B 78, 060505(R).
- Taylor et al. (2012) Taylor, A. E., R. A. Ewings, T. G. Perring, J. S. White, P. Babkevich, A. Krzton-Maziopa, E. Pomjakushina, K. Conder, and A. T. Boothroyd (2012), Phys. Rev. B 86, 094528.
- Taylor et al. (2011) Taylor, A. E., M. J. Pitcher, R. A. Ewings, T. G. Perring, S. J. Clarke, and A. T. Boothroyd (2011), Phys. Rev. B 83, 220514(R).
- Taylor et al. (2013) Taylor, A. E., S. J. Sedlmaier, S. J. Cassidy, E. A. Goremychkin, R. A. Ewings, T. G. Perring, S. J. Clarke, and A. T. Boothroyd (2013), Phys. Rev. B 87, 220508(R).
- Texier et al. (2012) Texier, Y., J. Deisenhofer, V. Tsurkan, A. Loidl, D. S. Inosov, G. Friemel, and J. Bobroff (2012), Phys. Rev. Lett. 108, 237002.
- Thaler et al. (2011) Thaler, A., H. Hodovanets, M. S. Torikachvili, S. Ran, A. Kracher, W. Straszheim, J. Q. Yan, E. Mun, and P. C. Canfield (2011), Phys. Rev. B 84, 144528.
- Thaler et al. (2010) Thaler, A., N. Ni, A. Kracher, J. Q. Yan, S. L. Bud’ko, and P. C. Canfield (2010), Phys. Rev. B 82, 014534.
- Thompson and Fisk (2012) Thompson, J. D., and Z. Fisk (2012), J. Phys. Soc. Jpn. 81, 011002.
- Tranquada et al. (1988) Tranquada, J. M., D. E. Cox, W. Kunnmann, H. Moudden, G. Shirane, M. Suenaga, P. Zolliker, D. Vaknin, S. K. Sinha, M. S. Alvarez, A. J. Jacobson, and D. C. Johnston (1988), Phys. Rev. Lett. 60, 156.
- Tranquada et al. (2014) Tranquada, J. M., G. Xu, and I. A. Zaliznyak (2014), J. Mag. Magn. Matr. 350, 148.
- Tucker et al. (2012a) Tucker, G. S., R. M. Fernandes, H.-F. Li, V. Thampy, N. Ni, D. L. Abernathy, S. L. Bud’ko, P. C. Canfield, D. Vaknin, J. Schmalian, and R. J. McQueeney (2012a), Phys. Rev. B 86, 024505.
- Tucker et al. (2012b) Tucker, G. S., D. K. Pratt, M. G. Kim, S. Ran, A. Thaler, G. E. Granroth, K. Marty, W. Tian, J. L. Zarestky, M. D. Lumsden, S. L. Bud’ko, P. C. Canfield, A. Kreyssig, A. I. Goldman, and R. J. McQueeney (2012b), Phys. Rev. B 86, 020503(R).
- Uemura (2009) Uemura, Y. J. (2009), Nat. Matter. 8, 253.
- Vaknin et al. (1987) Vaknin, D., S. K. Sinha, D. E. Moncton, D. C. Johnston, J. M. Newsam, C. R. Safinya, and J. H. E. King (1987), Phys. Rev. Lett. 58.
- Vilmercati et al. (2012) Vilmercati, P., A. Fedorov, F. Bondino, F. Offi, G. Panaccione, P. Lacovig, L. Simonelli, M. A. McGuire, A. S. M. Sefat, D. Mandrus, B. C. Sales, T. Egami, W. Ku, and N. Mannella (2012), Phys. Rev. B 85, 220503(R).
- Vorontsov et al. (2009) Vorontsov, A. B., M. G. Vavilov, and A. V. Chubukov (2009), Phys. Rev. B 79, 060508(R).
- Wakimoto et al. (2010) Wakimoto, S., K. Kodama, M. Ishikado, M. Matsuda, R. Kajimoto, M. Arai, K. Kakurai, F. Esaka, A. Iyo, H. Kito, H. Eisaki, and S. Shamoto (2010), J. Phys. Soc. Jpn. 79, 074715.
- Wakimoto et al. (2007) Wakimoto, S., K. Yamada, J. M. Tranquada, C. D. Frost, R. J. Birgeneau, and H. Zhang (2007), Phys. Rev. Lett. 98, 247003.
- Wang et al. (2013a) Wang, C., R. Zhang, F. Wang, H. Q. Luo, L. P. Regnault, P. C. Dai, and Y. Li (2013a), Phys. Rev. X 3, 041036.
- Wang and Lee (2011) Wang, F., and D. H. Lee (2011), Science 332, 200.
- Wang et al. (2011a) Wang, F., F. Yang, M. Gao, Z.-Y. Lu, T. Xiang, and D.-H. Lee (2011a), Europhy. Lett. 93, 57003.
- Wang et al. (2014) Wang, M., W. Tian, P. Valdivia, S. X. Chi, E. Bourrret-Courchesne, P. C. Dai, and R. J. Birgeneau (2014), Phys. Rev. B 90, 125148.
- Wang et al. (2012a) Wang, M., M. Wang, H. Miao, S. V. Carr, D. L. Abernathy, M. B. Stone, X. C. Wang, L. Xing, C. Q. Jin, X. T. Zhang, H. Ding, and P. C. Dai (2012a), Phys. Rev. B 86, 144511.
- Wang et al. (2011b) Wang, M., M. Y. Wang, G. N. Li, Q. Huang, C. H. Li, G. T. Tan, C. L. Zhang, H. B. Cao, W. Tian, Y. Zhao, Y. C. Chen, X. Y. Lu, B. Sheng, H. Q. Luo, S. L. Li, M. H. Fang, J. L. Zarestky, W. Ratcliff, M. D. Lumsden, J. W. Lynn, and P. C. Dai (2011b), Phys. Rev. B 84, 094504.
- Wang et al. (2013b) Wang, M., C. L. Zhang, X. Y. Lu, G. T. Tan, H. Q. Luo, Y. Song, M. Y. Wang, X. T. Zhang, E. A. Goremychkin, T. G. Perring, T. A. Maier, Z. P. Yin, K. Haule, G. Kotliar, and P. C. Dai (2013b), Nat. Commun. 4, 2874.
- Wang et al. (2011c) Wang, M. Y., C. Fang, D. X. Yao, G. T. Tan, L. W. Harriger, Y. Song, T. Netherton, C. L. Zhang, M. Wang, M. B. Stone, W. Tian, J. P. Hu, and P. C. Dai (2011c), Nat. Commun. 2, 580.
- Wang et al. (2012b) Wang, M. Y., C. Li, D. L. Abernathy, Y. Song, S. V. Carr, X. Lu, S. Li, Z. Yamani, J. Hu, T. Xiang, and P. C. Dai (2012b), Phys. Rev. B 86, 024502.
- Wang et al. (2011d) Wang, M. Y., H. Q. Luo, M. Wang, S. X. Chi, J. A. Rodriguez-Rivera, D. Singh, S. Chang, J. W. Lynn, and P. C. Dai (2011d), Phys. Rev. B 83, 094516.
- Wang et al. (2010) Wang, M. Y., H. Q. Luo, J. Zhao, C. L. Zhang, M. Wang, K. Marty, S. X.Chi, J. W. Lynn, A. Schneidewind, S. L. Li, and P. C. Dai (2010), Phys. Rev. B 81, 174524.
- Wang et al. (2008) Wang, X. C., Q. Q. Liu, Y. X. Lv, W. B. Gao, L. X. Yang, R. C. Yu, F. Y. Li, and C. Q. Jin (2008), Solid State Commun. 148, 538.
- Wang et al. (2012c) Wang, Z. W., Z. Wang, Y. J. Song, C. Ma, Y. Cai, Z. Chen, H. F. Tian, H. X. Yang, G. F. Chen, and J. Q. Li (2012c), J. Phys. Chem. C 116, 17847.
- Wen et al. (2013) Wen, J., S. Li, Z. Xu, C. Zhang, M. Matsuda, O. Sobolev, J. T. Park, A. D. Christianson, E. Bourret-Courchesne, Q. Li, G. Gu, D.-H. Lee, J. M. Tranquada, G. Xu, and R. J. Birgeneau (2013), Phys. Rev. B 88, 144509.
- Wen et al. (2011) Wen, J. S., G. Y. Xu, G. D. Gu, J. M. Tranquada, and R. J. Birgeneau (2011), Rep. Prog. Phys. 74, 124503.
- Wen et al. (2010) Wen, J. S., G. Y. Xu, Z. J. Xu, Z. W. Lin, Q. Li, Y. Chen, S. X. Chi, G. D. Gu, and J. M. Tranquada (2010), Phys. Rev. B 81, 100513(R).
- Wilson et al. (2006a) Wilson, S. D., P. C. Dai, S. L. Li, S. X. Chi, H. J. Kang, and J. W. Lynn (2006a), Nature (London) 442, 59.
- Wilson et al. (2006b) Wilson, S. D., S. L. Li, H. Woo, P. C. Dai, H. A. Mook, C. D. Frost, S. Komiya, and Y. Ando (2006b), Phys. Rev. Lett. 96, 157001.
- Wollan and Koehler (1955) Wollan, E. O., and W. C. Koehler (1955), Phys. Rev. 100, 545.
- Woo et al. (2006) Woo, H., P. C. Dai, S. M. Hayden, H. A. Mook, T. Dahm, D. J. Scalapino, T. G. Perring, and F. Doğan (2006), Nat. Phys. 2, 600.
- Wysocki et al. (2011) Wysocki, A. L., K. D. Belashchenko, and V. P. Antropov (2011), Nat. Phys. 7, 485.
- Xiao et al. (2013) Xiao, Y., S. Nandi, Y. Su, S. Price, H.-F. Li, Z. Fu, W. Jin, A. Piovano, A. Ivanov, K. Schmalzl, W. Schmidt, T. Chatterji, T. Wolf, and T. Brückel (2013), Phys. Rev. B 87, 140408.
- Xu et al. (2008) Xu, C. K., M. Müller, and S. Sachdev (2008), Phys. Rev. B 78, 020501 (R).
- Xu et al. (2013a) Xu, G. Y., Z. J. Xu, and J. M. Tranquada (2013a), Rev. Sci. Instrum. 84, 083906.
- Xu et al. (2013b) Xu, N., P. Richard, A. van Roekeghem, P. Zhang, H. Miao, W.-L. Zhang, T. Qian, M. Ferrero, A. S. Sefat, S. Biermann, and H. Ding (2013b), Phys. Rev. X 3, 011006.
- Xu et al. (2012) Xu, Z., J. Wen, Y. Zhao, M. Matsuda, W. Ku, X. Liu, G. Gu, D.-H. Lee, R. J. Birgeneau, J. M. Tranquada, and G. Xu (2012), Phys. Rev. Lett. 109, 227002.
- Xu et al. (2010) Xu, Z. J., J. S. Wen, G. Y. Xu, Q. Jie, Z. W. Lin, Q. Li, S. X. Chi, D. K. Singh, G. D. Gu, and J. M. Tranquada (2010), Phys. Rev. B 82, 104525.
- Yang et al. (2010) Yang, F., S.-P. Kou, and Z.-Y. Weng (2010), Phys. Rev. B 81, 245130.
- Ye et al. (2011) Ye, F., S. X.Chi, W. Bao, X. F. Wang, J. J. Ying, X. H. Chen, H. D. Wang, C. H. Dong, and M. H. Fang (2011), Phys. Rev. Lett. 107, 137003.
- Yi et al. (2011) Yi, M., D. Lu, J.-H. Chu, J. G. Analytis, A. P. Sorini, A. F. Kemper, B. Moritz, S.-K. Mo, R. G. Moore, M. Hashimoto, W.-S. Lee, Z. Hussain, T. P. Devereaux, I. R. Fisher, and Z.-X. Shen (2011), Proc. Natl. Acad. Sci. U.S.A. 108, 6878.
- Yildirim (2008) Yildirim, T. (2008), Phys. Rev. Lett. 101, 057010.
- Yin et al. (2010) Yin, W.-G., C.-C. Lee, and W. Ku (2010), Phys. Rev. Lett. 105, 107004.
- Yin et al. (2011) Yin, Z. P., K. Haule, and G. Kotliar (2011), Nat. Mater. 10, 932.
- Yin et al. (2014) Yin, Z. P., K. Haule, and G. Kotliar (2014), Nat. Phys. 10, 845.
- Ying et al. (2012) Ying, T. P., X. L. Chen, G. Wang, S. F. Jin, T. T. Zhou, X. F. Lai, H. Zhang, and W. Y. Wang (2012), Sci. Rep. 2, 426.
- Yoshizawa et al. (2012) Yoshizawa, M., D. Kimura, T. Chiba, S. Simayi, Y. Nakanishi, K. Kihou, C.-H. Lee, A. Iyo, H. Eisaki, M. Nakajima, and S. Uchida (2012), J. Phys. Soc. Jpn. 81, 024604.
- You et al. (2011) You, Y.-Z., F. Yang, S.-P. Kou, and Z.-Y. Weng (2011), Phys. Rev. B 84, 054527.
- Yu et al. (2009) Yu, G., Y. Li, E. M. Motoyama, and M. Greven (2009), Nat. Phys. 5, 873.
- Yu et al. (2013) Yu, R., Q. Si, P. Goswami, and E. Abrahams (2013), J. Phys.: Conf. Ser. 449, 12025.
- Yu et al. (2012) Yu, R., Z. Wang, P. Goswami, A. H. Nevidomskyy, Q. Si, and E. Abrahams (2012), Phys. Rev. B 86, 085148.
- Yu et al. (2014) Yu, R., J. X. Zhu, and Q. Si (2014), Phys. Rev. B 89, 024509.
- Zaliznyak et al. (2011) Zaliznyak, I. A., Z. J. Xu, J. M. Tranquada, G. D. Gu, A. M. Tsvelik, and M. B. Stone (2011), Phys. Rev. Lett. 107, 216403.
- Zhang et al. (2014a) Zhang, C. L., L. W. Harriger, Z. P. Yin, W. C. Lv, M. Y. Wang, G. T. Tan, Y. Song, D. L. Abernathy, W. Tian, T. Egami, K. Haule, G. Kotliar, and P. C. Dai (2014a), Phys. Rev. Lett. 122, 217202.
- Zhang et al. (2013a) Zhang, C. L., H.-F. Li, Y. Song, Y. X. Su, G. T. Tan, T. Netherton, C. Redding, S. V. Carr, O. Sobolev, A. Schneidewind, E. Faulhaber, L. W. Harriger, S. L. Li, X. Y. Lu, D.-X. Yao, T. Das, A. V. Balatsky, T. Brückel, J. W. Lynn, and P. C. Dai (2013a), Phys. Rev. B 88, 064504.
- Zhang et al. (2013b) Zhang, C. L., M. S. Liu, Y. X. Su, L.-P. Regnault, M. Wang, G. T. Tan, T. Brückel, T. Egami, and P. C. Dai (2013b), Phys. Rev. B 87, 081101(R).
- Zhang et al. (2014b) Zhang, C. L., Y. Song, L.-P. Regnault, Y. X. Su, M. Enderle, J. Kulda, G. T. Tan, Z. C. Sims, T. Egami, Q. Si, and P. C. Dai (2014b), Phys. Rev. B 90, 140502(R).
- Zhang et al. (2011a) Zhang, C. L., M. Wang, H. Q. Luo, M. Y. Wang, M. S. Liu, J. Zhao, D. L. Abernathy, T. A. Maier, K. Marty, M. D. Lumsden, S. X. Chi, S. Chang, J. A. Rodriguez-Rivera, J. W. Lynn, T. Xiang, J. P. Hu, and P. C. Dai (2011a), Sci. Rep. 1, 115.
- Zhang et al. (2013c) Zhang, C. L., R. Yu, Y. X. Su, Y. Song, M. Y. Wang, G. T. Tan, T. Egami, J. A. Fernandez-Baca, E. Faulhaber, Q. M. Si, and P. C. Dai (2013c), Phys. Rev. Lett. 111, 207002.
- Zhang et al. (2010) Zhang, J. H., R. Sknepnek, and J. Schmalian (2010), Phys. Rev. B 82, 134527.
- Zhang et al. (2013d) Zhang, Q., W. Tian, H. F. Li, J.-W. Kim, J. Q. Yan, R. W. McCallum, T. A. Lograsso, J. L. Zarestky, S. L. Bud’ko, R. J. McQueeney, and D. Vaknin (2013d), Phys. Rev. B 88, 174517.
- Zhang et al. (2012) Zhang, Y., C. He, Z. R. Ye, J. Jiang, F. Chen, M. Xu, Q. Q. Ge, B. P. Xie, J. Wei, M. Aeschlimann, X. Y. Cui, M. Shi, J. P. Hu, and D. L. Feng (2012), Phys. Rev. B 85, 085121.
- Zhang et al. (2011b) Zhang, Y., L. X. Yang, M. Xu, Z. R. Ye, F. Chen, C. He, H. C. Xu, J. Jiang, B. P. Xie, J. J. Ying, X. F. Wang, X. H. Chen, J. P. Hu, M. Matsunami, S. Kimura, and D. L. Feng (2011b), Nat. Mater. 10, 273.
- Zhao et al. (2009) Zhao, J., D. T. Adroja, D.-X. Yao, R. Bewley, S. L. Li, X. F. Wang, G. Wu, X. H. Chen, J. P. Hu, and P. C. Dai (2009), Nat. Phys. 5, 555.
- Zhao et al. (2012) Zhao, J., H. B. Cao, E. Bourret-Courchesne, D. H. Lee, and R. J. Birgeneau (2012), Phys. Rev. Lett. 109, 267003.
- Zhao et al. (2008a) Zhao, J., D.-X, Yao, S. L. Li, T. Hong, Y. Chen, S. Chang, W. R. II, J. W. Lynn, H. A. Mook, G. F. Chen, J. L. Luo, N. L. Wang, E. W. Carlson, J. P. Hu, and P. C. Dai (2008a), Phys. Rev. Lett. 101, 167203.
- Zhao et al. (2008b) Zhao, J., Q. Huang, C. de la Cruz, S. Li, J. W. Lynn, Y. Chen, M. A. Green, G. F. Chen, G. Li, Z. Li, J. L. Luo, N. L. Wang, and P. C. Dai (2008b), Nat. Matr. 7, 953.
- Zhao et al. (2008c) Zhao, J., Q. Huang, C. de la Cruz, J. Lynn, M. Lumsden, Z. A. Ren, J. Yang, X. Shen, X. Dong, Z. Zhao, and P. C. Dai (2008c), Phys. Rev. B 78, 132504.
- Zhao et al. (2008d) Zhao, J., W. Ratcliff-II, J. W. Lynn, G. Chen, J. L. Luo, N. Wang, J. Hu, and P. C. Dai (2008d), Phys. Rev. B 78, 140504(R).
- Zhao et al. (2010) Zhao, J., L. P. Regnault, C. L. Zhang, M. Y. Wang, Z. C. Li, F. Zhou, Z. X. Zhao, C. Fang, J. P. Hu, and P. C. Dai (2010), Phys. Rev. B 81, 180505(R).
- Zhao et al. (2013) Zhao, J., C. R. Rotundu, K. Marty, M. Matsuda, Y. Zhao, C. Setty, E. Bourret-Courchesne, J. P. Hu, and R. J. Birgeneau (2013), Phys. Rev. Lett. 110, 147003.
- Zhao et al. (2014) Zhao, J., Y. Shen, R. J. Birgeneau, M. Gao, Z.-Y. Lu, D.-H. Lee, X. Lu, H. Xiang, D. Abernathy, and Y. Zhao (2014), Phys. Rev. Lett. 112, 177002.
- Zhou et al. (2013a) Zhou, K.-J., Y.-B. Huang, C. Monney, X. Dai, V. N. Strocov, N. L. Wang, Z.-G. Chen, C. L. Zhang, P. C. Dai, L. Patthey, J. van den Brink, H. Ding, and T. Schmitt (2013a), Nat. Commun. 4, 1470.
- Zhou et al. (2013b) Zhou, R., Z. Li, J. Yang, D. L. Sun, C. T. Lin, and G.-Q. Zheng (2013b), Nat. Commun. 4, 2265.