High-precision multi-band time-series photometry of exoplanets Qatar-1 b and TrES-5 b
Abstract
We present an analysis of the Qatar-1 and TrES-5 transiting exoplanetary systems, which contain Jupiter-like planets on short-period orbits around K-dwarf stars. Our data comprise a total of 20 transit light curves obtained using five medium-class telescopes, operated using the defocussing technique. The average precision we reach in all our data is mmag for Qatar-1 () and mmag for TrES-5 (). We use these data to refine the orbital ephemeris, photometric parameters, and measured physical properties of the two systems. One transit event for each object was observed simultaneously in three passbands () using the BUSCA imager. The QES survey light curve of Qatar-1 has a clear sinusoidal variation on a period of d, implying significant starspot activity. We searched for starspot crossing events in our light curves, but did not find clear evidence in any of the new datasets. The planet in the Qatar-1 system did not transit the active latitudes on the surfaces of its host star. Under the assumption that corresponds to the rotation period of Qatar-1 A, the rotational velocity of this star is very close to the value found from observations of the Rossiter-McLaughlin effect. The low projected orbital obliquity found in this system thus implies a low absolute orbital obliquity, which is also a necessary condition for the transit chord of the planet to avoid active latitudes on the stellar surface.
keywords:
stars: planetary systems — planets and satellites: fundamental parameters, detection - techniques: photometric.Accepted ??. Received ??; in original form ??
1 Introduction
| Telescope | Date | Start (UT) | End (UT) | Frames (No) | Exp (sec) | Filter | Airmass | Moon (%) | Apertures (px) | RMS () |
|---|---|---|---|---|---|---|---|---|---|---|
| Qatar-1: | ||||||||||
| CAHA 1.23m | 2011.08.25 | 23:55 | 03:36 | 158 | 60 | Cousins R | 1.201.76 | 12.8 | 9,25,35 | 12.6 |
| CAHA 2.2m | 2011.08.25 | 23:46 | 04:39 | 115 | 60 | Gunn g | 1.192.20 | 12.8 | 16.5,64.9,78.3 | 10.5 |
| CAHA 2.2m | 2011.08.25 | 23:46 | 04:39 | 117 | 60 | Gunn r | 1.192.20 | 12.8 | 17,36.1,70 | 7.4 |
| CAHA 2.2m | 2011.08.25 | 23:46 | 04:39 | 118 | 60 | Gunn i | 1.192.20 | 12.8 | 13.2,38.9,61.9 | 9.6 |
| CAHA 1.23m | 2012.07.21 | 20:32 | 00:34 | 112 | 120 | Cousins R | 1.331.13 | 8.0 | 7.9,31.9,45 | 7.1 |
| CAHA 1.23m | 2012.09.11 | 00:27 | 03:48 | 78 | 120 | Cousins R | 1.362.20 | 27.1 | 19.9,38.9,53 | 7.5 |
| CAHA 1.23m | 2013.06.14 | 20:48 | 00:30 | 95 | 120 | Cousins R | 1.731.19 | 19.3 | 12.2,41,50.2 | 8.8 |
| CAHA 1.23m | 2013.07.28 | 20:17 | 01:05 | 156 | 120 | Cousins R | 1.311.16 | 59.1 | 25.8,39,61 | 7.3 |
| CAHA 1.23m | 2014.04.19 | 01:40 | 04:38 | 109 | 160 | Cousins R | 1.611.17 | 80.1 | 19,29,50 | 25.6 |
| CAHA 1.23m | 2014.06.04 | 20:42 | 02:57 | 138 | 150 | Cousins R | 1.971.13 | 12.9 | 20,30,50 | 7.7 |
| TUG100 | 2014.06.04 | 21:39 | 01:42 | 98 | 120 | Cousins R | 1.691.16 | 12.9 | 20,30,35 | 14.0 |
| CAHA 1.23m | 2014.09.07 | 23:57 | 04:37 | 135 | 96-135 | Cousins R | 1.252.32 | 98.2 | 22,40,60 | 11.8 |
| TrES-5: | ||||||||||
| CAHA 2.2m | 2011.08.26 | 20:55 | 00:55 | 95 | 60 | Gunn-g | 1.021.57 | 7.0 | 10.2,45.4,56.5 | 12.3 |
| CAHA 2.2m | 2011.08.26 | 20:55 | 00:55 | 88 | 60 | Gunn-r | 1.021.57 | 7.0 | 17.3,42.1, 55.6 | 8.5 |
| CAHA 2.2m | 2011.08.26 | 20:55 | 00:55 | 91 | 60 | Gunn-i | 1.021.57 | 7.0 | 10,28,39.1 | 12.1 |
| CAHA 1.23m | 2012.09.10 | 19:21 | 23:36 | 77 | 170 | Cousins R | 1.111.21 | 29.0 | 16,40.1,54.8 | 8.5 |
| CAHA 1.23m | 2013.06.15 | 00:42 | 03:50 | 65 | 125 | Cousins R | 1.141.11 | 44.9 | 12,38,55.3 | 9.0 |
| CAHA 1.23m | 2013.07.30 | 23:10 | 04:03 | 128 | 120 | Cousins I | 1.081.47 | 38.2 | 13.7,27.8,46 | 11.3 |
| Cassini 1.52m | 2013.09.14 | 21:19 | 02:59 | 139 | 180 | Gunn r | 1.082.09 | 78.2 | 9.8,22.6,38.7 | 13.0 |
| INT 2.5m | 2013.09.14 | 21:04 | 22:22 | 37 | 120 | Cousins I | 1.051.17 | 72.4 | 18,28,50 | 4.1 |
Ground-based photometric surveys have found a large number of transiting planets, possessing a huge diversity in their physical and orbital properties. The precise
characterisation of these objects is a challenge as it requires high-quality data, both photometric and spectroscopic. The main limitation to our understanding of most
transiting planets is due to the quality of the transit light curve, which is critical in determining the properties of both the planets and their host stars
(Southworth, 2008, 2009).
In this work we present follow-up photometry of two transiting planets orbiting cool stars – Qatar-1 b and TrES-5 b – aimed at improving measurements of their physical
properties but also investigating the spot activity of their host stars. Our new data allow a significant improvement in our understanding of both systems, and, in the case of
TrES-5, form the basis of the first study of the system since the discovery paper.
Qatar-1 b was discovered by Alsubai et al. (2011), and was the first planet found by the Qatar Exoplanet Survey (QES), an exoplanet transit survey focused on hot Jupiters and hot
Neptunes via the transit method (Alsubai et al., 2013). The transiting planet TrES-5 b was discovered shortly afterwards (Mandushev et al., 2011) using observations by the TrES survey
(Alonso et al., 2004). The Qatar-1 and TrES-5 systems are notably similar in terms of orbital period (1.4–1.5 d), host star effective temperature (4800–5200 K) and metallicity
(), and the planetary radius (1.2) and equilibrium temperature (1400–1500 K). Qatar-1 has subsequently been studied by Covino et al. (2013), who found a
sky-propjected orbital obliquity consistent with axial alignment, and by von Essen et al. (2013), who found indications of transit timing variations (TTVs) in this system. No studies
of TrES-5 have been published since its discovery paper (Mandushev et al., 2011).
The possibility to observe occulted starspots during planetary-transit events opens new opportunities in the understanding of stars in general and planetary systems in
particular. Those spots which are occulted by the planet manifest themselves as a small increase in flux during transit, which can be modelled to obtain the spot size, position
and temperature (e.g. Mancini et al., 2014). Multiple observations of the same spot during different transits can yield the orbital obliquity of the system
(Nutzman et al., 2011; Sanchis-Ojeda et al., 2011) to a significantly higher precision than achievable via the Rossiter-McLaughlin effect (Tregloan-Reed et al., 2013). The wavelength
dependence of the amplitude of the unocculted starspots can mimic changes in the apparent radius of transiting planets as a function of wavelength (Pont et al., 2013; Oshagh et al., 2014).
In this work we present high-precision photometric observations of Qatar-1 and TrES-5, and use them to get more accurate measurements of the physical parameters of the systems.
Some of our data were obtained in multiple passbands simultaneously, but we find no evidence for spot crossings in these data. We do, however, find strong evidence that the
Qatar-1 A is a spotted star from the long-term light curve of the system.
2 Observations and data reduction
Our observations were obtained using five medium-size telescopes equipped with imaging instruments, and operated out of focus (see Southworth et al. 2009). A summary of the observations is given in Table 1. The data were reduced using the defot pipeline from Southworth et al. (2009, 2014). This pipeline was used to debias and flat-field the data, then perform aperture photometry on the target and all possible comparison stars. The radii of the software apertures (target, inner sky, outer sky) for each dataset were chosen to give the lowest scatter in the final light curve. The final light curve was constructed by calculating differential magnitudes versus a weighted set of comparison stars. The weights were optimised simultaneously with the coefficients of a low-order polynomial of magnitude versus time, in order to rectify the light curve to zero differential magnitude and minimise the scatter of the data obtained outside transit.
A total of 11 transits were observed using the 1.23 m telescope at Centro Astronómico Hispano-Alemán (CAHA). This uses a pixel CCD camera with a plate scale of 0.32′′ px-1 and has a field of view with the default filters. Ten of the transits were obtained through a Cousins filter and the last through a Cousins filter. The first three transits were already presented in the study by Covino et al. (2013) but were re-reduced for the current work.
One transit each of Qatar-1 and TrES-5 was observed using the CAHA 2.2 m telescope equipped with the BUSCA instrument. This obtains CCD images of a 5.8′ diameter field of view simultaneously in four optical passbands, split by dichroic elements. Each of the four CCDs has pixels and is operated using 22 binning. For both transits we obtained useful data in the Thuan-Gunn , and passbands. The data taken through the Strömgren filter were discarded due to high scatter: both objects are comparatively faint ( for Qatar-1 and for TrES-5) and cool so have very low flux levels in this passband.
One transit of Qatar-1 was monitored with the 1.0 m telescope (T100) at TÜBİTAK National Observatory (TUG) in Turkey, equipped with a pixel CCD with a field of view of . The transit was observed through a Cousins filter.
One transit of TrES-5 was obtained using the 2.5 m Isaac Newton Telescope (INT) at La Palma, Spain, and the Wide Field Camera (WFC). This is a mosaic of four CCDs of which we used only CCD4, to avoid possible systematic errors and calibration issues resulting from the use of multiple CCDs in the mosaic. This CCD has pixels, giving a field of view of , and a Cousins filter was selected.
Finally, a transit of TrES-5 was observed using the Cassini 1.52 m telescope at Bologna Astronomical Observatory, Loiano, Italy. The BFOSC instrument was used in imaging mode, with a Thuan-Gunn filter. The pixels CCD provided a field of view of at 0.58′′ per pixel.
3 Transit analysis
Each transit light curve was modelled with the jktebop code to extract measurements of its photometric parameters. The object size parameters in jktebop are the fractional radii of the star and the planet ( and ), which are the ratios between the true radii and the semimajor axis (). The fitted parameters were the sum of the fractional radii (), the ratio of the radii (), the orbital inclination (), and a reference time of mid-transit. We assumed an orbital eccentricity of zero for both objects based on previous studies (Covino et al., 2013; Mandushev et al., 2011). Limb darkening was applied using the quadratic law, with coefficients taken from Claret (2004b). We used Monte Carlo simulations to perform the error analysis for each transit fit. The errors were propagated following Alonso et al. (2008) and Mislis et al. (2010).
3.1 Qatar-1
| Date | Inclination (∘) | (BJD/TDB) | ||||
|---|---|---|---|---|---|---|
| 2011.08.25 | ||||||
| 2011.08.25 | ||||||
| 2011.08.25 | ||||||
| 2011.08.25 | ||||||
| 2012.07.21 | ||||||
| 2012.09.11 | ||||||
| 2013.06.14 | ||||||
| 2013.07.28 | ||||||
| 2014.04.19 | ||||||
| 2014.06.04 | ||||||
| 2014.06.04 | ||||||
| 2014.09.07 | ||||||
| Weighted mean |
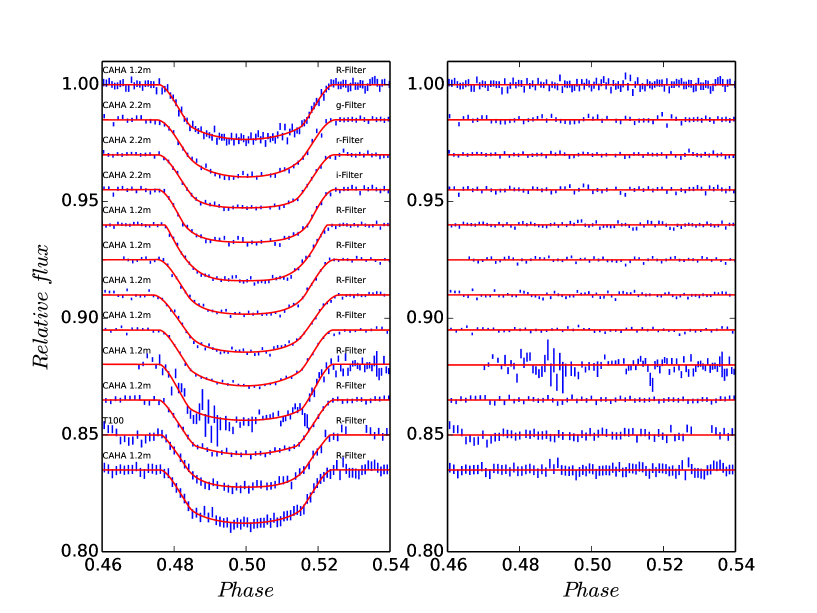
For Qatar-1, we collected 12 light curves in total (see Fig. 1). We fit each of the datasets individually, obtaining the parameter values given in Table 2. The parameter values in Table 2 were combined into weighted means for the determination of the physical properties of the system (see below). We then fitted the values with a straight line versus cycle number to determine the orbital ephemeris. The uncertainties were obtained using 1000 Monte Carlo simulations. The resulting ephemeris is:
| (1) |
where is the transit mid-time, is the cycle number and the bracketed quantities give the uncertainty in the final digit of the preceding number. All times in our analysis were converted to Barycentric Julian Day (BJD/TDB).
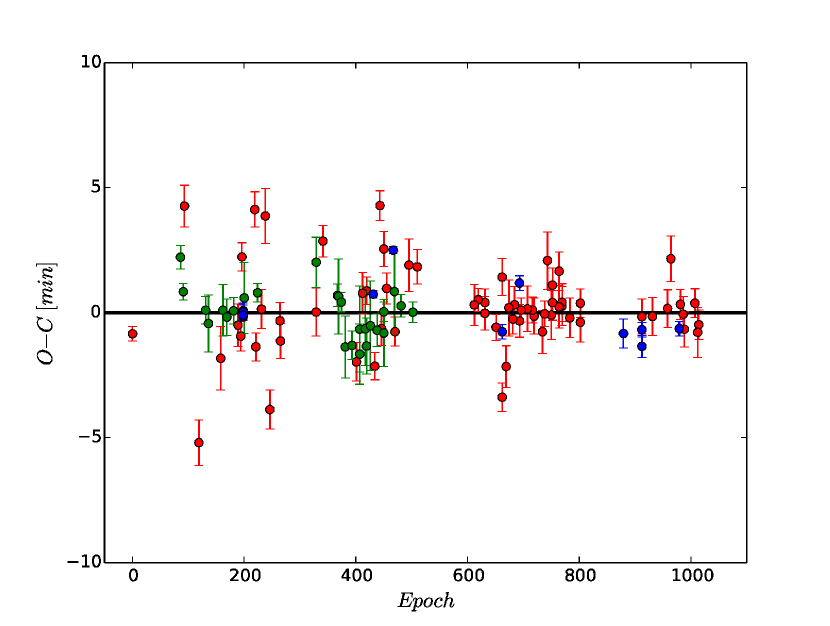
We supplemented our values with data from the literature and searched for TTVs. We included timings from the ETD amateur database111http://var2.astro.cz/ETD/ with quality higher than 3. We fit a linear function to and then removed the linear trend. Fig. 2 shows the results ( diagram) overplotted with the best linear fit. The value is 31.4, which is very high. This implies that the data cannot be explained by a simple linear fit, but still the amplitude of our O-C residuals are smaller ( minutes) than von Essen et al. (2013) ( minutes), Covino et al. (2013) ( minutes) or ETD ( minutes). von Essen et al. (2013) found evidence for TTVs in Qatar-1 but we need further and more precise data in order to analyse this scenario in detail.
3.2 Multi-band photometry of Qatar-1
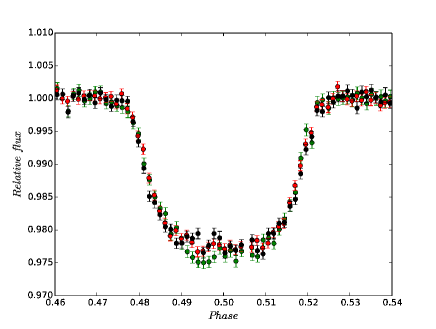
The BUSCA light curves were obtained simultaneously in three filters using the same telescope and instrument, so are useful for investigating the possible presence of starspots. Fig. 3 shows the three light curves overplotted. Whilst there are suggestions of starspots in the and data, these are close to the level of the noise so their existence is not proven. This transit was also monitored using the CAHA 1.23 m telescope (first dataset in Fig. 1), and these data do not confirm the presence of any starspots.
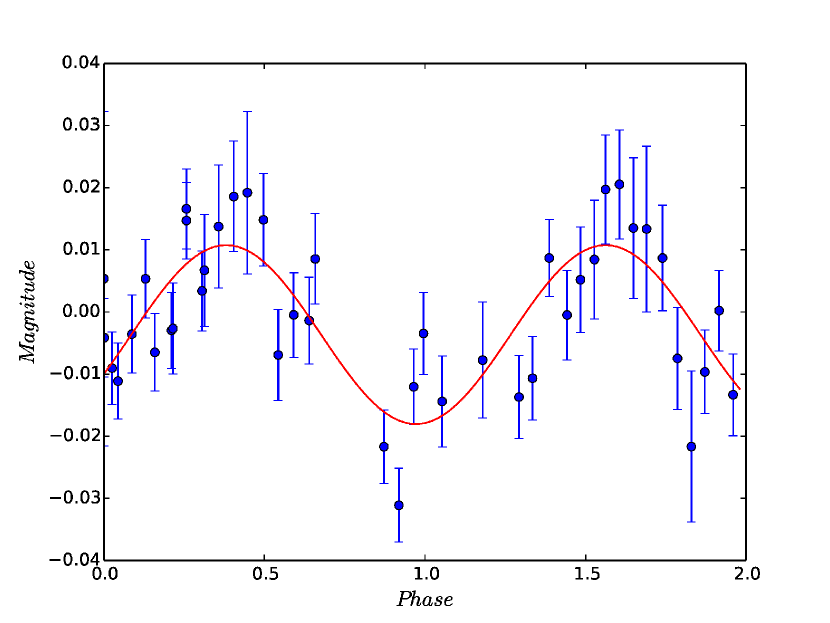
Whilst we have no clear detection of starspots via occultation during transit, spots are a common phenomenon on the surfaces of K-type dwarfs. They can cause brightness modulation at the rotational period (and/or its submultiples) of the star. We used the discovery light curves from QES (Alsubai et al., 2011), which span 380 days, to search for stellar variability. A Lomb-Scargle periodogram of the data shows a clear detection of sinusoidal modulation at a period of d (Fig. 4), which we take to be the rotational period of the star. The implied stellar rotation velocity of km s-1 is fully consistent with the value of km s-1 found by Covino et al. (2013) from the Rossiter-McLaughlin effect. This in turn indicates that the inclination of the stellar rotation axis, , is close to 90∘, so the true orbital obliquity of the system is close to the measured value of the projected orbital obliquity found by Covino et al. (2013).
3.3 TrES-5b
| Date | Inclination (∘) | (BJD/TDB) | ||||
|---|---|---|---|---|---|---|
| 2011.08.26 | ||||||
| 2011.08.26 | ||||||
| 2011.08.26 | ||||||
| 2012.09.10 | ||||||
| 2013.06.15 | ||||||
| 2013.07.30 | ||||||
| 2013.09.14 | ||||||
| 2013.09.14 | ||||||
| Weighted mean |
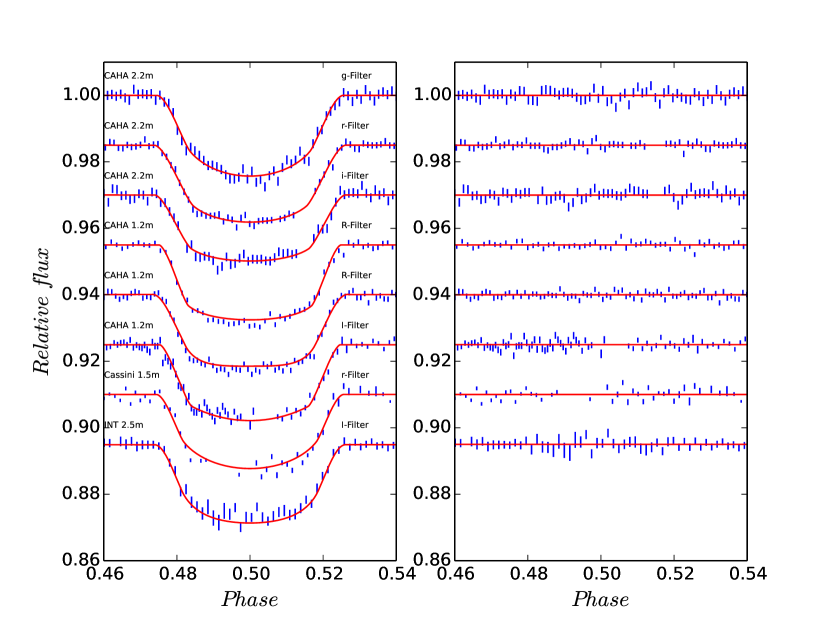
The analysis of our eight light curves of TrES-5 followed the same steps as for Qatar-1 above. The best-fitting photometric parameters are given in Table 3 and the best fits are plotted in Fig. 5. The parameter values in Table 3 were combined into weighted means for the determination of the physical properties of the system (see below). The resulting orbital ephemeris is:
| (2) |
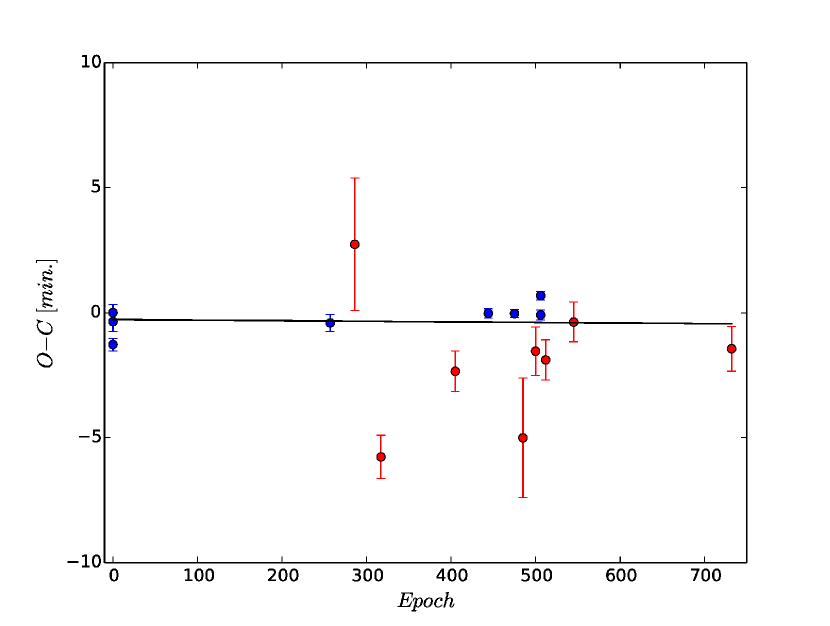
As with Qatar-1, we added measurements from the ETD database (again using only those with qualities higher than 3) and formed the diagram (Fig. 6). The best-fitting ephemeris has , which a factor of ten lower than that for Qatar-1. This indicates either that the linear ephemeris is a poor representation of the data or that the errorbars of many of the values are underestimated. As with Qatar-1, further data are needed to investigate this situation and to provide clear evidence (or otherwise) of the presence of TTVs in this system.
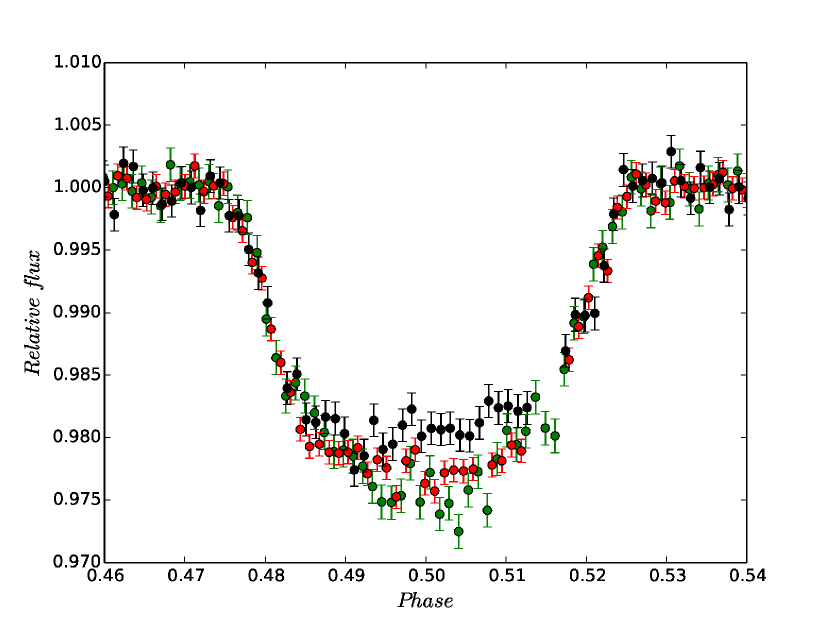
The multi-band data from BUSCA are shown in Fig. 7, and contain no clear evidence of starspot occultations. The data during totality (between 2nd and 3rd contact) are rather noisy so are not good indicators of the presence of starspots. This is at least partly due to the relative faintness of TrES-5 (), at least for a 2-m class telescope equipped with an instrument containing many optical elements.
4 Physical properties
References: (1) Covino et al. (2013), (2) Mandushev et al. (2011).
| Source | Qatar-1 | Ref | TrES-5 | Ref | ||
|---|---|---|---|---|---|---|
| (K) | 4910 | 100 | 1 | 5171 | 36 | 2 |
| (dex) | 0.20 | 0.10 | 1 | 0.20 | 0.10 | 2 |
| ( m s-1) | 265.7 | 3.5 | 1 | 339.8 | 10.4 | 2 |
| Quantity | Symbol | Unit | Qatar-1 | TrES-5 | ||||
| Stellar mass | 0.818 | 0.047 | 0.050 | 0.901 | 0.029 | 0.008 | ||
| Stellar radius | 0.796 | 0.016 | 0.017 | 0.868 | 0.013 | 0.002 | ||
| Stellar surface gravity | c.g.s. | 4.549 | 0.011 | 0.009 | 4.517 | 0.012 | 0.001 | |
| Stellar density | ||||||||
| Planet mass | 1.293 | 0.052 | 0.054 | 1.790 | 0.067 | 0.010 | ||
| Planet radius | 1.142 | 0.026 | 0.024 | 1.194 | 0.015 | 0.003 | ||
| Planet surface gravity | m s-2 | |||||||
| Planet density | 0.811 | 0.036 | 0.017 | 0.983 | 0.039 | 0.003 | ||
| Equilibrium temperature | K | |||||||
| Safronov number | 0.0640 | 0.0017 | 0.0014 | 0.0817 | 0.0028 | 0.002 | ||
| Orbital semimajor axis | au | 0.02313 | 0.00044 | 0.00048 | 0.02459 | 0.00026 | 0.0007 | |
| Age (gyrochronology) | Gyr | |||||||
We determined the physical properties of the two systems from the light curve fits (the weighted means in Tables 2 and 3), from the spectroscopic measurements of host star’s atmospheric properties, and from the tabulated predictions of five different sets of theoretical stellar evolutionary models. The values of , and in Tables 2 and 3 were combined according to their weighted mean, inflating the resulting errorbars to enforce for each quantity. The spectroscopic measurements of the stellar effective temperature (), metallicity and orbital velocity amplitude () were taken from published studies and are summarised in Table 4. Tabulated predictions were obtained from the Claret (2004a), Y2 (Demarque et al., 2004), Teramo (Pietrinferni et al., 2004), VRSS (VandenBerg et al., 2006) and DSEP (Dotter et al., 2008) stellar models.
For each target we began by estimating a value for the velocity amplitude of the planet, , allowing us to calculate a set of physical properties for the system using standard formulae. The value of was then iteratively refined to maximise the agreement between the observed and predicted , and the measured and predicted . Finally, the full procedure was undertaken using each of the five sets of stellar model predictions. For both objects we assumed a circular orbit, based on the conclusions of Covino et al. (2013) and Mandushev et al. (2011). We used the set of physical constants given by Southworth (2011).
The uncertainties on the input parameters were propagated through the analysis using a perturbation approach, and added in quadrature to give the final random error. A systematic errorbar was also estimated based on the interagreement between the results obtained using each of the five different model sets. Table 5 gives our final physical properties, random errorbars for all quantities, and systematic errorbars for those results which depend on stellar theory.
Also, only for Qatar-1A, we were able to calculate the stellar rotation period. Thus, we can use gyrochronology model to estimate stellar the age of Qatar-1b host star. Using the model from Barnes (2007) and stellar rotation period 23.697 days and B-V=1.06, we estimate the age of Qatar-1A Gyr.
Our final results for Qatar-1 are in good agreement with published studies (Alsubai et al., 2011; Covino et al., 2013), and yield a significant improvement in precision. In the case of TrES-5 we agree with the findings of Mandushev et al. (2011) but do not obtain significantly smaller errorbars. This is because we account for systematic errors whereas Mandushev et al. (2011) do not, and also because the errors estimated by Mandushev et al. (2011) appear to be too small (for example they claim that the orbital inclination is degrees, a level of precision not normally achieved even with Kepler or Hubble Space Telescope light curves). Our results are therefore to be preferred to those of Mandushev et al. (2011) because they are based on a larger and more precise dataset, and because our errorbars have been more robustly calculated.
5 Results and Conclusions
We present extensive optical photometry of transit events in two extrasolar planetary systems with K-dwarf host stars. Our data comprise 12 light curves of Qatar-1 and eight light curves of TrES-5. These data include simultaneous observations in three passbands of one transit for each object. We use thse data to search for starspot crossing events during transit, with a negative result. We do, however, measure the rotational period of d for Qatar-1 A from the survey photometry in its discovery paper, showing that this does display spot activity. The corresponding rotational velocity is close to the value measured from an observation of the Rossiter-McLaughlin effect in this system, so its low projected orbital obliquity also implies a low true orbital obliquity. The lack of observed spot crossings may be due to the planets crossing latitudes of the stars which show low spot activity, i.e. the planetary chords miss the active latitudes of the stellar surfaces.
We use our data to measure the photometric parameters of both systems. When combined with published spectroscopic quantities, these yield precise measurements of the full physical properties of the systems. Qatar-1 and TrES-5 have notable similarities in their respective stellar properties, and planetary equilibrium temperature, radius and density. Our results also yield refined measurements of the orbital ephemerides of the systems.
Acknowledgments
This publication is supported by NPRP grant X-019-1-006 from the Qatar National Research Fund (a member of Qatar Foundation). The statements made herein are solely the responsibility of the authors.
Based on observations obtained with the 1.52-m Cassini telescope at the OAB Observatory in Loiano (Italy), and with the 1.23-m and 2.2m telescopes at the Centro Astronòmico
Hispano Alemàn (CAHA) at Calar Alto (Spain), jointly operated by the Max-Planck Institut for Astronomy and the Instituto de Astrofìsica de Andalucìa (CSIC).
We thank to TÜBİTAK for the partial support in using T100 telescope with project number 12CT100-378. OB acknowledges the support by the research fund of Ankara
University (BAP) through the project 13B4240006.
References
- Alonso et al. (2004) Alonso R., et al., 2004, ApJ, 613, L153
- Alonso et al. (2008) Alonso R., et al.,2008, A&A, 487, L5
- Alsubai et al. (2011) Alsubai K. A., et al., 2011, MNRAS, 417, 709
- Alsubai et al. (2013) Alsubai K. A., et al., 2013, AcA, 63, 465
- Barnes (2007) Barnes S., 2007, ApJ, 669, 1167B
- Claret (2004a) Claret A., 2004, A&A, 424, 919
- Claret (2004b) Claret A., 2004, A&A, 428, 1001
- Covino et al. (2013) Covino E., et al., 2013, A&A, 554, A28
- Demarque et al. (2004) Demarque P., et al., 2004, ApJS, 155, 667
- Dotter et al. (2008) Dotter A., et al., 2008, ApJS, 178, 89
- Mancini et al. (2014) Mancini L., et al. 2014, MNRAS, 443, 2391
- Mandushev et al. (2011) Mandushev G., et al., 2011, ApJ, 741, 114
- Mislis et al. (2010) Mislis D., et al., 2010, A&A, 510, A107
- Nutzman et al. (2011) Nutzman P. A., Fabrycky D. C., Fortney J. J., 2011, ApJ, 740, L10
- Oshagh et al. (2014) Oshagh M., et al., 2014, A&A, 568, A99
- Pietrinferni et al. (2004) Pietrinferni A., et al., 2004, ApJ, 612, 168
- Pont et al. (2013) Pont F., et al., 2013, MNRAS, 432, 2917
- Sanchis-Ojeda et al. (2011) Sanchis-Ojeda R., et al., 2011, ApJ, 733, 127
- Southworth (2008) Southworth J., 2008, MNRAS, 386, 1644
- Southworth (2009) Southworth J., 2009, MNRAS, 394, 272
- Southworth (2010) Southworth J., 2010, MNRAS, 408, 1689
- Southworth (2011) Southworth J., 2011, MNRAS, 417, 2166
- Southworth et al. (2009) Southworth J., et al., 2009, MNRAS, 396, 1023
- Southworth et al. (2014) Southworth J., et al., 2014, MNRAS, 444, 776
- Tregloan-Reed et al. (2013) Tregloan-Reed J., Southworth J., Tappert C., 2013, MNRAS, 428, 3671
- VandenBerg et al. (2006) VandenBerg D. A., Bergbusch P., Dowler P., 2006, ApJS, 162, 375
- von Essen et al. (2013) von Essen C., Schröter S., Agol E., Schmitt J. H. M. M., 2013, A&A, 555, A92