Measuring Star-formation Rate and Far-Infrared Color in High-redshift Galaxies
Using the CO (76) and [N ii] 205 Lines⋆⋆\star⋆⋆\star
Based on Herschel observations.
Herschel is an ESA space observatory with science
instruments provided by European-led Principal Investigator consortia
and with important participation from NASA.
Abstract
To better characterize the global star formation (SF) activity in a galaxy, one needs to know not only the star formation rate (SFR) but also the rest-frame, far-infrared (FIR) color (e.g., the 60-to-100 color, ] of the dust emission. The latter probes the average intensity of the dust heating radiation field and scales statistically with the effective SFR surface density in star-forming galaxies including (ultra-)luminous infrared galaxies [(U)LIRGs]. To this end, we exploit here a new spectroscopic approach involving only two emission lines: CO (76) at 372 and [N ii] at 205 ([N ii]205μm). For local (U)LIRGs, the ratios of the CO (76) luminosity () to the total infrared luminosity (; 81000) are fairly tightly distributed (to within 0.12 dex) and show little dependence on . This makes a good SFR tracer, which is less contaminated by active galactic nuclei (AGN) than and may also be much less sensitive to metallicity than . Furthermore, the logarithmic [N ii]205μm/CO (76) luminosity ratio is fairly steeply (at a slope of ) correlated with , with a modest scatter (0.23 dex). This makes it a useful estimator on with an implied uncertainty of 0.15 [or 4 K in the dust temperature () in the case of a graybody emission with K and a dust emissivity index ]. Our locally calibrated SFR and estimators are shown to be consistent with the published data of (U)LIRGs of up to 6.5.
Subject headings:
galaxies: active — galaxies: ISM — galaxies: star formation — infrared: galaxies — ISM: molecules — submillimeter: galaxies1. INTRODUCTION
Luminous infrared galaxies (LIRGs: with an 8-1000 ; Sanders & Mirabel 1996), including ultra-luminous ones (ULIRGs, ), dominate the cosmic star formation (SF) at (e.g., Le Flóch et al. 2005). For to 3, these galaxies are mixtures of two populations based on their prevalent “SF mode”: (a) mergers dominated by nuclear starburst with warm far-infrared (FIR) colors and a high SF efficiency (SFE) similar to that in local ULIRGs, and (b) gas-rich disk galaxies with disk SF and SFE comparable to local spirals (e.g., Daddi et al. 2010); more ULIRGs belong to the latter “main-sequence” (MS) population (e.g., Elbaz et al. 2011). However, the current perception that the typical spectral energy distribution (SED) of the dust emission in the high-, MS galaxy population is merely a “scaled-up” SED of local normal galaxies remains unproven: if the size of the effective SF region in a galaxy is fixed, an increasing implies a higher effective SFR surface density (), which is known to lead to a warmer 60-to-100 color, , (thus, the shape of the SED) for both normal galaxies and (U)LIRGs (Chanial et al. 2007; Liu et al. 2015; also see §3.2). As demonstrated by Rujopakarn et al. (2011), the high- (U)LIRGs from the MS population are comparable in size to the local star-forming galaxies, but with a much higher . In general, probes the average intensity of the dust heating radiation field (e.g., Draine & Li 2007), and both SFR and should be measured in order to more fully characterize the SF activity in galaxies.
The conventional way to do so is to obtain a full dust SED from which both the SFR (from ) and can be deduced. For high- galaxies, this usually requires multiple photometric measurements covering a wide wavelength range, as illustrated in the recent studies on 3 galaxies at -6 (Riechers et al. 2013; Gilli et al. 2014; Rawle et al. 2014). Furthermore, as increases, accurate continuum photometry becomes tougher due to relatively bright background. A promising alternative is to measure SFR and using spectral lines in the FIR/sub-mm. A recent spectroscopic survey with the Herschel Space Observatory (Herschel) on a large sample of LIRGs from the Great Observatories All-Sky LIRG Survey (GOALS; Armus et al. 2009) revealed a remarkable one-to-one relation between the luminosity summed over the CO rotational transitions in the mid- regime () and (Lu et al. 2014; hereafter Paper I). Here we exploit the scenario of using only the CO (76) line luminosity, , as a SFR tracer. Furthermore, we show that, for the local (U)LIRGs, the [N ii] 205 line (hereafter simply as [N ii]) to CO (76) flux ratio is fairly steeply correlated with with a modest scatter. As a result, it can serve as a useful estimator on .
In the remainder of this Letter, we describe the galaxy samples and data used in §2, present our analysis and results in §3, and compare our results to the existing observations of distant galaxies in §4.
2. Data Samples
2.1. Local LIRGs
Paper I described a Herschel spectroscopic survey of a flux-limited set of 125 LIRGs from GOALS using the Spectral and Photometric Imaging REceiver (SPIRE; Griffin et al. 2010). While the detailed data will be presented elsewhere (Lu et al., in preparation), the measured CO and [N ii] fluxes based on the point-source flux calibration, as described in Paper I and Zhao et al. (2013), are used here. The fluxes of the [C ii] line at 158 (hereafter as [C ii]) for our galaxies were taken from Díaz-Santos et al. (2013), obtained with the Herschel Photodetector Array Camera and Spectrometer (PACS; Poglitsch et al. 2010). These are also point-source calibrated fluxes, approaching the total flux for sources with a [C ii] extent not too extended relative to the PACS beam of 12″(full width at half maximum or FWHM).
For each GOALS galaxy, the [Ne v] 14.3 to [Ne ii] 12.8 line ratio (hereafter [Ne v]/[Ne ii]) or its upper limit is available in Inami et al. (2013). Five galaxies in our GOALS/SPIRE sample have [Ne v]/[Ne ii] , for which the AGN contribution to the total bolometric luminosity is likely greater than 50% (Farrah et al. 2007).
2.2. Local ULIRGs
Containing only 7 ULIRGs, our GOALS/SPIRE sample covers mainly LIRGs, particularly lower luminosity ones. We also obtained from the Herschel archive and reduced in the same way the SPIRE spectroscopic observations of 28 ULIRGs (i.e., the local ULIRG sample), which extend our coverage to 10. These observations were performed in the program “OT1-dfarrah-1” (PI: D. Farrah). For many of these galaxies, the [C ii] fluxes are available from Farrah et al. (2013). Only one galaxy in this sample has [Ne v]/[Ne ii] (Farrah et al. 2007).
2.3. Local Dwarf Galaxies
Our GOALS/SPIRE sample also includes one blue compact dwarf, Haro 11, with a metallicity , where (Asplund et al. 2009). We obtained archival SPIRE spectra on 3 additional dwarfs: NGC 4214 ( 0.36 ; obsid 1342256082; Madden et al. 2013), IC 10 (0.29 ; 1342246982) and He 2-10 (0.54 ; 1342245083) (PI: V. Lebouteiller). The metallicity values were taken from Rémy-Ruyer et al. (2013). Both IC 10 and NGC 4214 are extended and their SPIRE observations were pointed at the brightest H II region. We extracted a CO (76) flux from the point-source calibrated spectrum of the central detector. The corresponding and were derived by convolving the SPIRE beam of CO (76) with the corresponding PACS images (Rémy-Ruyer et al. 2013) and used to calculate the FIR luminosity (; Helou et al. 1985) after inferring from a matching FIR model SED from Dale et al. (2001). He 2-10 is infrared compact (Bendo et al. 2012). Its SPIRE observation is a map. We therefore extracted from the map a point-source spectrum at the location of the peak brightness using the task “specPointSourceExtractor” in the Herschel Interactive Processing Environment software (HIPE). The extracted spectrum was further corrected for an optimized source extent of 18″(Gaussian FWHM) using the HIPE semi-extended source correction tool (Wu et al. 2013) before extracting our CO (76) and [N ii] fluxes. Finally, the total [C ii] flux of He 2-10 was taken from Cormier et al. (2015).
3. Analysis
3.1. CO (76) as a SFR Tracer
We used the PACS 70 continuum images of Chu et al. (in preparation) to further select our GOALS galaxies that are not too extended with respect to the SPIRE beam, which measures (FWHM) 35″ and 17″ for CO (76) and [N ii], respectively, in order to use the point-source calibrated fluxes. For each galaxy, we calculated , the fractional 70 flux within a Gaussian beam of FWHM . The CO (76) and [N ii] analyses here are further limited to those GOALS galaxies satisfying (102 galaxies; the average value of ) and (98 galaxies; the average value ), respectively. These were chosen so that at least 75% of the GOALS galaxies in the coldest FIR color () or smallest () bin meet the criterion, and that any systematic effect from the possible aperture flux loss is significantly smaller than the sample scatter in the flux ratios dealt with here.
In Fig. 1 we plot both / and / as a function of for the local galaxies. The AGNs with [Ne v]/[Ne ii] are further circled. For IC 10 and NGC 4214, we could only obtain their . As a result, they are only shown in Fig. 1b.
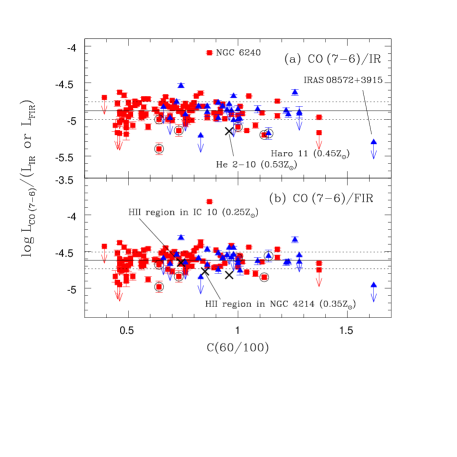
NGC 6240 is a rare outlier with additional gas heating likely from shocks unrelated to the ongoing SF (see Paper I). The AGNs in Fig. 1 have a lower CO/IR ratio on average. This is more apparent in CO (76)/IR than in CO (76)/FIR, consistent with that the lower CO/IR ratio in an AGN is mostly due to the AGN “contamination” to (see Paper I). In this sense, CO (76) is a “cleaner” SFR tracer than .
A galactic CO spectral line energy distribution (SLED) generally consists of up to 3 distinct gas components, which dominate the SLED at the low (i.e., ), mid (5 to 10) and high () regimes, respectively; the mid- component is directly related to the ongoing SF (see Paper I; Xu et al. 2015). On either side (in ) of this SF-driven component, the “contamination” from one of the other gas components increases. We found that CO (76) traces better than any other mid- CO line. For example, the CO (65)/IR ratios from our sample show a small anti-correlation with , implying a systematic ratio variation of 0.29 dex over .
The average CO (76)/IR ratio in Fig. 1 (i.e., the solid line) can be used to derive a SFR from using the SFR- calibration from Kennicutt (1998). Eq. (1) gives the results, with the quoted uncertainty being the sample standard deviation ( dex). Since dex when the total flux of all the mid- CO lines was used (see Paper I), it is 5% less accurate when using the CO (76) line alone to predict .
Many local dwarf galaxies with are relatively faint in CO (10), with a CO (10)/IR ratio being 1-2 orders of magnitude less than that for normal spirals (e.g., Schruba et al. 2012). This is usually attributed to a more severe CO dissociation by UV photons because of a lower dust opacity. Nevertheless, the mid- CO line emission arises from dense molecular clouds; possible UV self-shielding (Lee et al. 1996) implies that CO (76)/IR should not be as severely dependent on metallicity as CO (1-0)/IR. In Fig. 1, both Haro 11 and He 2-10 appear to have somewhat lower flux ratios of CO (76) to IR or FIR. On the other hand, the bright H II regions in IC 10 and NGC 4214 are not much different from the (U)LIRGs in terms of the CO (76)/FIR ratio. Therefore, the low-metallicity dwarf galaxies examined here show only a moderately lower CO (76)/FIR ratio on average, but still within 2 of the average ratio for the (U)LIRGs.
3.2. [C ii]/CO (76), [N ii]/CO (76) and
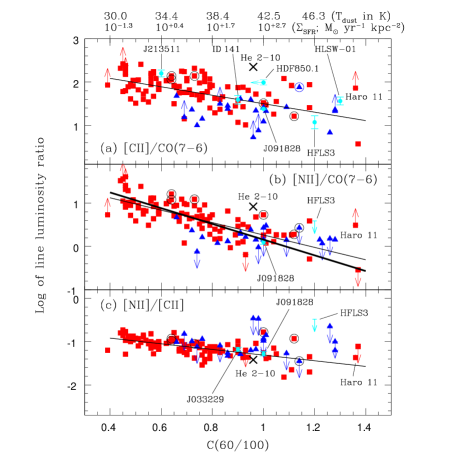
In Fig. 2 we plot the [C ii]/CO (76), [N ii]/CO (76) and [N ii]/[C ii] luminosity ratios as a function of for the local (U)LIRGs. All the plots span 2.3 dex vertically for direct comparison. The dust temperature, , and marks at the top of the plots were derived respectively from assuming a dust emissivity index of and from eq. (2), which represents a least-squares bisector (Isobe et al. 1990) result on a sample of 175 local star-forming galaxies [including 66 (U)LIRGs] in Liu et al. (2015) with -based and . As in Chanial et al. (2007), both the normal galaxies and (U)LIRGs in this sample follow a single trend continuously. However, the r.m.s. scatter at a given is still significant, up to 0.9 dex. Moreover, eq. (2) is calibrated up to .
| (2) |
The data trends in Fig. 2 remain unchanged if or replaces . All the three line ratios are anti-correlated with . Eqs. (3) to (5) give the results from a vertical linear regression (i.e., the thin solid lines in Fig. 2) using the local (U)LIRG detections in each plot (after excluding the AGNs, but including NGC 6240 that behaves “normal” here). The resulting with respect to the fit are 0.30, 0.23 and 0.15 dex, respectively. If we had further limited the GOALS galaxies to a subset of 69 galaxies with , the resulting fit would be similar. As demonstrated in Zhao et al. (2013), at a given , the scatter in the [N ii]/FIR [thus, [N ii]/CO (76)] flux ratios for SF-dominated galaxies is largely driven by the hardness of the underlying radiation field. The reduced scatter in the [N ii]/[C ii] ratios suggests that a major part of the scatter in the [C ii]/CO (76) ratios should also be driven by the radiation hardness.
| (3) | |||||
| (4) | |||||
| (5) | |||||
| Galaxy | Type | CO (76)/FIRa,b | [C ii]/CO (76)a | [N ii]/CO (76)a | [N ii]/[C ii]a | Referencesd | ||
|---|---|---|---|---|---|---|---|---|
| (1) | (2) | (3) | (4) | (5) | (6) | (7) | (8) | (9) |
| IRAS F10214+4724 | 2.286 | QSO | -5.00(0.10) | (1,1,-,-,-) | ||||
| SMM J213511-0102 | 2.32 | SMG | -4.81(0.02) | 2.20(0.08) | 0.6 | (2,2,3,-,3) | ||
| SMM J16365+4057 | 2.383 | SMG | -4.19(0.04) | (2,2,-,-,-) | ||||
| SMM J16358+4105 | 2.452 | SMG | -4.36(0.06) | (2,2,-,-,-) | ||||
| SMM J04431+0210 | 2.509 | SMG | -5.10(0.11) | (2,2,-,-,-) | ||||
| Cloverleaf | 2.558 | QSO | -4.20(0.07) | (1,1,-,-,-) | ||||
| SMM J14011+0252 | 2.565 | SMG | -4.77(0.06) | (1,1,-,-,-) | ||||
| VCV J1409+5628 | 2.583 | QSO | -4.95(0.08) | (1,1,-,-,-) | ||||
| AMS12 | 2.767 | QSO | -4.99(0.05) | (2,2,-,-,-) | ||||
| RX J0911+0551 | 2.796 | QSO | -4.68(0.03) | (2,2,-,-,-) | ||||
| HLSW-01 | 2.957 | SMG | -4.52(0.05) | 1.56(0.09) | 1.3 | (2,2,4,-,4) | ||
| MM18423+5938 | 3.930 | SMG | -4.87(0.05) | 0.53(0.02) | (2,2,-,2,-) | |||
| SMM J123711+6222 | 4.055 | SMG | -4.71(0.05) | 0.9 | (2,5,-,-,6) | |||
| ID 141 | 4.243 | SMG | -4.73(0.04) | 1.59(0.10) | 0.9 | (2,2,7,-,7) | ||
| BR 1202-0725 (N) | 4.69 | SMG | -4.12(0.05) | 1.05(0.08) | 0.50(n/a) | -0.44(n/a) | (2,8,9,10,-) | |
| BR 1202-0725 (S) | 4.69 | QSO | -4.60(0.04) | 1.00(0.07) | 0.04(n/a) | -0.79(n/a) | (2,8,9,10,-) | |
| LESS J033229-2756 | 4.755 | SMG | -1.18(0.05) | 0.9 | (-,-,11,2,12) | |||
| HDF850.1 | 5.183 | SMG | -4.74(0.06) | 1.99(0.06) | 1.0 | (2,13,14,-,14) | ||
| HLS J091828+5142 | 5.243 | SMG | -4.46(0.02) | 1.38(0.02) | 0.10(0.05) | -1.28(0.05) | 1.0 | (15,15,15,15,15) |
| HFLS3 | 6.34 | SMG | -4.34(0.10) | 1.07(0.15) | 0.59(n/a) | -0.48(n/a) | 1.2 | (16,16,16,16,16) |
| SDSS J1148+5251 | 6.419 | QSO | -4.61(0.05) | 1.16(0.06) | 0.13(n/a) | -1.03(n/a) | (2,2,17,17,-) |
A useful application of Fig. 2 at high is to infer by measuring two of the three lines. Given its steeper correlation with and modest sample scatter (0.23 dex), the [N ii]/CO (76) ratio is the preferred one. While eq. (4) is suitable for inferring the [N ii]/CO (76) ratio from a measured , the reverse inference normally requires a regression of on [N ii]/CO (76), of which the slope might be biased somewhat due to the selection effect that, at the low end, our LIRG luminosity cutoff may have left out some FIR-colder galaxies at a fixed [N ii]/CO (76) ratio. As a compromise, the thick solid line in Fig. 2b or eq. (6) gives the least-squares bisector result as our favored estimator for .
| (6) | |||||
The resulting scatter in relative to the fit is 0.15, equivalent to an accuracy of 4 K in in the case of a graybody emission with K and a dust emissivity index . However, it should be noted that eqs. (3)-(5) are applicable only for , below which the [N ii]/IR trend flattens out (Zhao et al. 2013). Fig. 2 also hints that either a strong AGN or a low metallicity might enhance [N ii]/CO (76) and/or [C ii]/CO (76). While more data are needed to confirm these possible systematics, it has been known that a low metallicity tends to increase [C ii]/FIR (e.g., Madden et al. 1997)

4. Application to High- Galaxies
Table 1 lists the high- galaxies with either a CO (76) flux or both [C ii] and [N ii] observations in the literature. They consist of 14 sub-mm selected galaxies (SMGs) and 7 quasars (QSOs). The line luminosities in solar units were derived using the formulae in Solomon & Vanden Bout (2005).
There is a considerable uncertainty as to whether an IR luminosity given in the literature for a high- galaxy is or . When this distinction is not clear, the IR luminosity was usually either derived from a FIR-radio correlation or scaled from a sub-mm flux density (see Carilli & Walter 2013), and is therefore closer to than . We therefore compare in Fig. 3 the CO (76)/FIR ratios between the local (U)LIRGs from Fig. 1 and the high- sample. Considering the small sample size and the fact that the high- galaxies likely have a much larger error in their , we focus on the sample average. The / averages are (), () and () for the high- QSOs, SMGs and the local (U)LIRGs (excluding NGC 6240), respectively. A Student’s t-test, allowing for unequal variances (Press et al. 1992, p. 617), showed an 80% (23%) confidence for the local (U)LIRGs and the high- SMGs (QSOs) to share the same average CO (76)/FIR ratio. The high- QSOs as a class have a lower average ratio than either the high- SMGs or the local (U)LIRGs. This is consistent with the sample selections, i.e., the QSOs should have stronger AGNs on average than the SMGs. On the other hand, six out of the 7 high- QSOs possess the / ratios comparable to those of the 6 local AGNs. This also suggests that the high- galaxies with the lowest CO/FIR ratios are likely caused by the AGN rather than by a low metallicity.
In Fig. 2 we also plotted those high- galaxies with available in Table 1. They all appear to be consistent with the trends defined by the local (U)LIRGs, with an overall agreement within 1 when only the detections are considered. There are 3 galaxies in Table 1 with at least two of the 3 line ratios measured, but not . In every case, the line ratios are consistent with each other within the context of Fig. 2.
Hodge et al. (2015) measured M⊙ yr-1 kpc-2 in J 123711+6222, comparable to the predicted 165 M⊙ yr-1 kpc-2 from our eq. (2). For HFLS3 [], the measured 0.731.15 M⊙ yr-1 kpc-2 (Riechers et al. 2013). Eq. (2) is calibrated only up to , at which it predicts a mean M⊙ yr-1 kpc-2.
Our work here offers a simple, empirical method of using just two spectral lines, CO (76) and [N ii]205μm, to measure both SFR and in (U)LIRGs. Both lines suffer little dust extinction and are among the brightest FIR/sub-mm cooling lines, making this method particularly suited for probing the SF activity in high- galaxies. With a modern interferometric facility such as the Atacama Large Millimeter Array, both lines become observable at . Thus, this technique enables the simultaneous study of the physical conditions (e.g., size) of the ionized and dense molecular gas (e.g., Xu et al. 2015) as well as the SF activity across a wide redshift range.
References
- (1) Armus, L., Mazzarella, J. M., Evans, A. S., et al. 2009, PASP, 121, 559
- (2) Asplund, M., Grevesse, N., Sauval, A. J., & Scott, P. 2009, ARA&A, 47, 481
- (3) Bendo, G. J., Galliano, F., & Madden, S. C. 2012, MNRAS, 423, 197
- (4) Carilli, C. L., Daddi, E., Riechers, D., et al. 2010, ApJ, 714, 1407
- (5) Carilli, C. L., Riechers, D., Walter, F., Maiolino, R., Wagg, J., Lentati, L., McMahon, R., & Wolfe, A. 2013, ApJ, 763, 120
- (6) Carilli, C. L., & Walter, F. 2013, ARA&A, 51, 105
- (7) Chanial, P., Flores, H., Guiderdoni, B, Elbaz, D., Hammer, F., & Vigroux, L. 2007, A&A, 462, 81
- (8) Cormier, D., Madden, S. C., Lebouteiller, V., et al. 2015, A&A (accepted) (arXiv:1502.03131)
- (9) Cox, P., Krips, M., Neri, R., et al. 2011, ApJ, 740, 63
- (10) Daddi, E., Elbaz, D., Walter, F., et al. 2010, ApJ, 714, L118
- (11) Dale, D., Helou, G., Contursi, A., Silbermann, N., & Kolhatkar, S. 2001, ApJ, 549, 215
- (12) De Breuck, C., Williams, R. J., Swinbank, M., et al. 2014, A&A, 565, A59
- (13) Decarli, R., Walter, F., Carilli, C., et al. 2014a, ApJ, 782, 17
- (14) Decarli, R., Walter, F., Carilli, C., et al. 2014b, ApJ, 782, 78
- (15) Díaz-Santos, T., Armus, L., Charmandaris, V., et al. 2013, ApJ, 774, 68
- (16) Draine, B. T. & Li, A. 2007, ApJ, 657, 810
- (17) Elbaz, D., Dickinson, M., Hwang, H. S., et al. 2011, A&A, 533, A119
- (18) Farrah, D., Bernard-Salas, J., Spoon, H. W. W., et al. 2007, ApJ, 667, 149
- (19) Farrah, D., Lebouteiller, V., Spoon, H. W. W., et al. 2013, ApJ, 776, 38
- (20) Gilli, R., Norman, C., Vignali, C., et al. 2014, A&A, 562, 67
- (21) Griffin, M. J., Abergel, A., Abreu, A., et al. 2010, A&A, 518, L3
- (22) Helou, G., Soifer, B. T., Rowan-Robinson, M. 1985, ApJ, 298, L7
- (23) Hodge, J. A., Riechers, D., Decarli, R., Walter, F., Carilli, C. L., Daddi, E., & Dannerbauer, H. 2015, ApJ, 798, 18
- (24) Inami, H., Armus, L., Charmandaris, V., et al. 2013, ApJ, 777, 156
- (25) Isobe, T., Feigelson, E. D., Akritas, M. G., & Babu, G. J. 1990, ApJ, 364, 104
- (26) Ivison, R. J., Swinbank, A. M., Swinyard, B., et al. 2010, A&A, 518, L35
- (27) Kennicutt, R. C., Jr. 1998, ARA&A, 36, 189
- (28) Le Flóch, E., Papovich, C., Dole, H., et al. 2005, ApJ, 632, 169
- (29) Lee, H.-H., Herbst, E., Pineau des Forêts, G., Roueff, E., & Le Bourlot, J. 1996, A&A, 311, 690
- (30) Liu, L., Gao, Y., & Greve, T. R. 2015, ApJ (accepted) (arXiv:1502.08001)
- (31) Lu, N., Zhao, Y., Xu, C. K., et al. 2014, ApJ, 787, L23 (Paper I)
- (32) Madden, S. C., Poglitsch, A., Geis, N., Stacey, G. J., & Townes, C. H. 1997, ApJ, 483, 200
- (33) Madden, S. C., Rémy-Ruyer, A., Galametz, M., et al. 2013, PASP, 125, 600
- (34) Magdis, G. E., Rigopoulou, D., Hopwood, R., et al. 2014, ApJ, 796, 63
- (35) Poglitsch, A., Waelkens, C., Geis, N., et al. 2010, A&A, 518, L2
- (36) Press, W. H., Teukolsky, S. A., Vetterling, W. T., & Flannery, B. P. 1992, Numerical Recipes in C (2nd ed.; Cambridge, UK: University Press)
- (37) Rawle, T. D., Egami, E., Bussmann, R. S., et al. 2014, ApJ, 783, 59
- (38) Rémy-Ruyer, A., Madden, S. C., Galliano, F., et al. 2013, A&A, 557, A95
- (39) Riechers, D. A., Bradford, C. M., Clements, D. L., et al. 2013, Nature, 496, 329
- (40) Rujopakarn, W., Rieke, G. H., Eisenstein, D. J., & Juneau, S. 2011, ApJ, 726, 93
- (41) Sanders, D. B., & Mirabel, I. F. 1996, ARA&A, 34, 749
- (42) Schruba, A., Leroy, A. K., Walter, F., et al. 2012, AJ, 143, 138
- (43) Salomé, P., Guélin, M., Downes, D., Cox, P., Guilloteau, S., Omont, A., Gavazzi, R., & Neri, R. 2012, A&A, 545, 57
- (44) Solomon, P. M., & Vanden Bout, P. A. 2005, ARA&A, 43, 677
- (45) Tan, Q., Daddi, E., Magdis, G., et al. 2014, A&A, 569, A98
- (46) Walter, F., Weiß, A., Riechers, D. A., Carilli, C. L., Bertoldi, F., Cox, P., & Menten, K. M. 2009, ApJ, 691, L1
- (47) Walter, F., Decarli, R., Carilli, C., et al. 2012, Nature, 486, 233
- (48) Wu, R., Polehampton, E. T., Etxaluze, M., et al. 2013, A&A, 556, A116
- (49) Xu, C. K., Cao, C., Lu, N., et al. 2015, ApJ, 799, 11
- (50) Zhao, Y., Lu, N., Xu, C. K., et al. 2013, ApJ, 765, L13