11email: r.hesper@astro.rug.nl 22institutetext: SRON Netherlands Institute for Space Research, Postbus 800, 9700 AV Groningen, The Netherlands
22email: a.m.baryshev@sron.nl 33institutetext: Department of Electrical Engineering, Universidad de Chile, Av. Tupper 2007, Santiago, Chile
33email: pmena@ing.uchile.cl 44institutetext: Kavli Institute of Nanoscience, Delft University of Technology, Lorentzweg 1, 2628 CJ Delft, The Netherlands
44email: t.m.klapwijk@tudelft.nl 55institutetext: Leiden Observatory, Leiden University, PO Box 9500, 2300 RA, Leiden, The Netherlands
55email: kempen@strw.leidenuniv.nl 66institutetext: Joint ALMA Offices, Av. Alonso de Córdova 3107, Vitacura - Santiago, Chile 77institutetext: Mecon Engineering BV, Koopmanslaan 25, 7005 BK Doetinchem, The Netherlands 88institutetext: NOVA, J.H. Oort Building, P.O. Box 9513, 2300 RA Leiden, The Netherlands 99institutetext: ESO, Karl-Schwarzschild-Straße 2, 85748 Garching, Germany
The ALMA Band 9 receiver
Abstract
Aims. We describe the design, construction, and characterization of the Band 9 heterodyne receivers (600–720 GHz) for the Atacama Large Millimeter/submillimeter Array (ALMA). First-light Band 9 data, obtained during ALMA commissioning and science verification phases, are presented as well.
Methods. The ALMA Band 9 receiver units (so-called “cartridges”), which are installed in the telescope’s front end, have been designed to detect and down-convert two orthogonal linear polarization components of the light collected by the ALMA antennas. The light entering the front end is refocused with a compact arrangement of mirrors, which is fully contained within the cartridge. The arrangement contains a grid to separate the polarizations and two beam splitters to combine each resulting beam with a local oscillator signal. The combined beams are fed into independent double-sideband mixers, each with a corrugated feedhorn coupling the radiation by way of a waveguide with backshort cavity into an impedance-tuned superconductor-insulator-superconductor (SIS) junction that performs the heterodyne down-conversion. Finally, the generated intermediate frequency (IF) signals are amplified by cryogenic and room-temperature HEMT amplifiers and exported to the telescope’s IF back end for further processing and, finally, correlation.
Results. The receivers have been constructed and tested in the laboratory and they show an excellent performance, complying with ALMA requirements. Performance statistics on all 73 Band 9 receivers are reported. Importantly, two different tunnel-barrier technologies (necessitating different tuning circuits) for the SIS junctions have been used, namely conventional AlOx barriers and the more recent high-current-density AlN barriers. On-sky characterization and tests of the performance of the Band 9 cartridges are presented using commissioning data. Continuum and line images of the low-mass protobinary IRAS 16293-2422 are presented which were obtained as part of the ALMA science verification program. An 8 GHz wide Band 9 spectrum extracted over a 0.3”0.3” region near source B, containing more than 100 emission lines, illustrates the quality of the data.
Key Words.:
instrumentation: detectors – methods: laboratory – methods: observational – submillimeter: general1 Introduction
The Atacama Large Millimeter/submillimeter Array (ALMA) is the largest millimeter and sub-millimeter astronomical facility ever built (Wootten & Thompson 2009). When fully operational, it will consist of 66 movable antennas (54 with a 12-meter dish and 12 with a 7-meter dish). Every antenna of the array holds a cryostat (front end) located near the secondary focus with room for ten different dual-polarization heterodyne receivers to cover the atmospheric transmission windows between 31 GHz and 950 GHz. At the time of writing, ALMA is already operational at about 75 percent of its full capacity, using over 50 antennas. The first generation of front ends delivered to the ALMA site are populated with receivers for Band 3 (89–116 GHz), Band 6 (211–275 GHz), Band 7 (275–370 GHz), and Band 9 (602–720 GHz). Other receivers are either close to full installation at the observatory (Bands 4, 8, and 10), in construction (Band 5), or under development (Bands 1 and 2).
Physically, the receivers are built as independent units called “cartridges”, presenting a uniform mechanical, thermal, and electronic interface to the telescope’s front end. Since many components needed for such high-performance receivers are not available off the shelf, the cartridge concept enabled the assembly of independent collaborative teams consisting of instrument scientists and experts on superconducting devices, extremely low-noise amplifiers, and local oscillators, making them jointly responsible for optimization and delivery of a particular frequency band. For instance, each assigned atmospheric transmission band leads to different solutions for the superconducting tunnel devices used in the mixers of all but the two lowest bands. For Band 9, the superconducting technology was developed in close collaboration between the Kavli Institute of Nanoscience at Delft and the NOVA group at the University of Groningen, where the latter also carried out the rest of the cartridge design, assembly, and radio frequency (RF) testing. The cartridge concept has proven to be very practical for rapid upgrading and maintenance, and it is now also used outside of the ALMA context (Sugimoto et al. 2004).
The receivers for the different ALMA bands are spatially distributed within the focal plane (Carter et al. 2004) so that the telescope needs to be repointed when another frequency band is selected. Owing to the physical size of the telescope beam, Bands 1–4 have reflective optical elements external to the cryogenic front end. For Bands 5–10 all coupling and polarization splitting optics are located within the cryostat. A water vapor radiometer is located outside the front end to measure the atmospheric water vapor content above each of the ALMA antennas for individual phase correction (Nikolic et al. 2013). A robotic arm with a two-temperature calibrator device, solar filter, and quarter-wave plate allows for proper calibration of the receivers during operation.
In a heterodyne receiver, the radio frequency (RF) signal to be studied, at angular frequency , is mixed with a well-determined local oscillator (LO) signal at , to be down-converted to an intermediate frequency (IF) with . The IF signal contains all the information of the original RF signal but at a much lower frequency, which can be further processed electronically. In the simplest, so-called double-sideband (DSB) configuration, a heterodyne receiver cannot distinguish whether the resulting IF signal corresponds to an RF signal that has a higher or a lower frequency than . In other words, in the IF band, the down-converted lower side band (LSB) and upper side band (USB) are superimposed. This results in extra noise on the IF output if the observed RF signal is present in only one sideband as in the case of spectral observations. In contrast, a sideband-separating (2SB) heterodyne receiver has two separate IF outputs, one for RF signals down-converted from the LSB and one for those down-converted from the USB. This is achieved at the expense of extra complexity in the RF and IF circuitry, making it considerably more difficult to implement at higher frequencies. As a consequence, in the original ALMA design, Bands 3, 6, and 7 were chosen to have 2SB mixers, while Band 9 opted for DSB mixers. Having only one IF channel per polarization, the IF system of Band 9 was designed to cover a range of 4–12 GHz instead of 4–8 GHz as on the 2SB bands.
Improvements in micromachining techniques over the past few years now allows fabrication of 2SB receivers for these high frequencies as well (Mena et al. 2011), and so they can be considered for future upgrading of the Band 9 receivers (Hesper et al. 2009; Khudchenko et al. 2011, 2012).
In this paper we present the technical details and performance of the full series of Band 9 receivers. In Sect. 2 we present an overview of the receiver concept and the design and construction of its components. In Sect. 3 the laboratory performance of the assembled receiver is presented, with particular attention to the beam pattern, noise temperature and gain compression results. Statistics on the measured performance of the full series of ALMA Band 9 receivers is also reported. In Sect. 4, we present the performance of the receiver in a single ALMA antenna as well as within the larger array. Several data sets taken during the commissioning time of ALMA illustrate the on-sky performance of the Band 9 cartridges. Finally, a map of the dust and gas distribution around the nearby low-mass protostar IRAS 16293-2422 (Mundy et al. 1992; Chandler et al. 2005; Jørgensen et al. 2011), taken within the scope of the science verification, is presented. This dataset is publicly available.
The on-sky tests also serve to illustrate two of the three specialties that form the science case of Band 9: very high spatial resolution (the highest of all four initial bands offered in the Early Science calls for observing proposals), and high-excitation molecular transitions such as CO =6–5, which trace warmer gas. The third and last Band 9 science case (not demonstrated in this work) calls for the capability to observe atomic fine-structure lines in high-z galaxies, red-shifted into Band 9 wavelengths.
2 Design and construction
2.1 General concept
| PARAMETER | SPECIFICATION |
|---|---|
| Frequency range | 602–720 GHz |
| Detector type | SIS mixer |
| Configuration | • Simultaneous reception of two orthogonal linear polarizations • Single-ended DSB operation • Beam coupling by corrugated feed horn • Quasi-optical LO insertion by way of beam splitter • No mechanical tuners |
| Noise temperature | • Lower than 335 K (SSB) over 80% of the band • Lower than 500 K (SSB) at any frequency |
| IF coverage | 4–12 GHz |
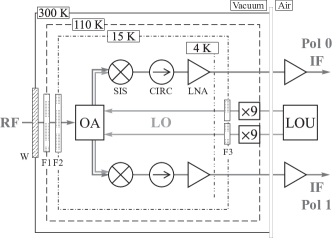
Table 1 summarizes the key specifications for Band 9, based on the requirements set by the ALMA Scientific Advisory Committee (Wild & Payne 2001; Wild et al. 2002). They represent a small selection of the technical goals and guidelines for the work presented here.
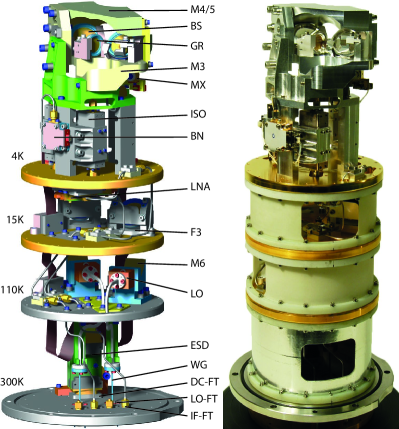
The conceptual design of the Band 9 cartridge is presented in Fig. 1. The radiation, collected and imaged by the telescope, enters the cryostat through a vacuum window and a set of infrared filters. The beam is then refocused in a reflective optics assembly that also contains a polarizing grid and two beam splitters for, respectively, splitting the light into two orthogonal linear polarizations and combining each resulting beam with its LO signal. The two beams are then sent to independent Superconductor-Insulator-Superconductor (SIS) mixers and subsequently two IF low-noise amplification chains. The entire receiver is built in a “cartridge” that serves as mechanical support and thermal anchor at the different temperature stages of the cryostat, namely 110, 15 and 4 K.
In the design it was important to consider reproducibility and ease of assembly. Particular to ALMA is the necessity of delivering 70+ fully tested receivers (to fill the main array and provide a couple of spares) in a period of only four years. In the rest of this section we describe in more detail the implementation of the components presented in Fig. 1.
2.2 Optics
2.2.1 Window and filters
Although the window and heat filters are not part of the Band 9 cartridge proper, they are described here to present an overview of the entire optics train.
The receiver inside the cryostat looks at the secondary reflector of the telescope through a vacuum window, which consists of a quartz substrate with an antireflection coating designed to have an optimized transmission to cover the frequency range of Band 9 (Koller et al. 2003). In the 110 and 15 K radiation shields, infrared blocking filters, consisting of several sheets of expanded PTFE (Goretex 111W. L. Gore & Associates, Incorporated, 555 Paper Mill Road, Newark, DE 19711, USA. Available online: http://www.gore.com/en_xx/products/sealants/gaskets/gore_gr_sheet_gasketing.html and Mupor 222Interstate Specialty Products, 55 Gilmore Drive Sutton, MA 01590, USA. Available online: http://www.interstatesp.com/porex_ptfe_standard_sizes.html), have been placed (Baryshev et al. 2006).
2.2.2 RF focusing and LO injection
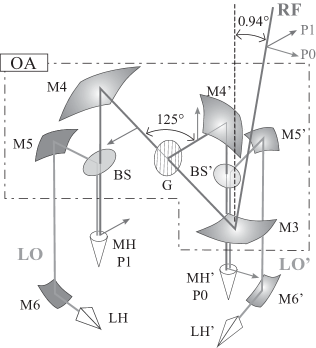
The ALMA Band 9 optics is designed to be an integral part of ALMA front end optics (Carter et al. 2004). Figure 2 shows the layout of the optical system used to couple the RF and LO signals into the two DSB mixers corresponding to the two orthogonal linear polarizations. To determine the focal lengths of the mirrors, a geometrical approximation was used. The sizes of the mirrors were determined using a Gaussian optics analysis (Wild et al. 2002). The sizes were chosen as to fit a 5-waist beam for the RF path, and a 4-waist beam for the LO. A detailed description of these dimensions is given in Baryshev & Wild (2001). Furthermore, the whole system was verified using a full physical optics method (Candotti et al. 2009).
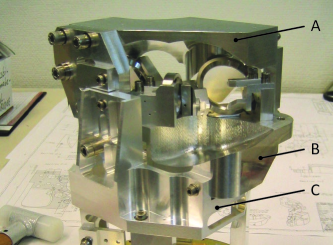
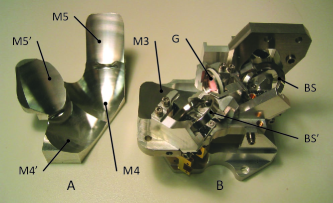
The 4 K components of the optical system used to couple the RF and LO signals are implemented as a single unit, called the optics assembly (Fig. 3). The optics assembly consists mainly of a pair of aluminum blocks out of which all of the 4 K optical surfaces have been machined. The upper block contains M4, M4’, M5 and M5’, and is aligned by way of dowel pins to the lower block, which contains M3. The lower block also contains aligned attachment points for the grid, beamsplitter and mixer holders. Alignment accuracy is reached purely by controlled machining tolerance; there is no provision for adjustment or shimming in the design. This design demands an accuracy of 40 m in the relative positioning of the mirror surfaces, which is a value that can be readily achieved with modern industrial precision machining (Baryshev & Wild 2001).
The only two mirrors not on the 4 K level, M6 and M6’, are machined as part of (identical) LO subassemblies that also contain the mechanical interface to the LO horn and the final multiplier block, as well as alignment features matched to the 110 K plate. The LO horns are of the diagonal pyramidal type. Although these give a lower efficiency (84%) than corrugated horns, they are much easier to manufacture, while the LO produces sufficient power to compensate for the lower coupling.
The optics assembly has been verified at room temperature using an in-house built phase-and-amplitude beam pattern measurement setup (Baryshev et al. 2004b) that uses 2D near-field scans. Simulations and measurements agree extremely well. The main results were i) the first side lobes are at less than dB below the main peak, ii) the beam squint between the polarizations is 9.2%, and iii) the aperture efficiency is above 80% at all frequencies and both polarizations (Candotti et al. 2009).
2.3 Mixers
2.3.1 Mixer structure
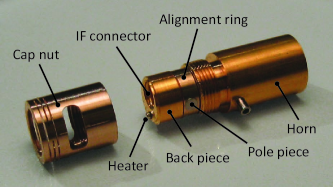
The mixer (Fig. 4) consists of a feedhorn, a back piece holding the SIS mixer device and a spring-loaded “cap nut” to clamp the two together.
The mixer horn is of the conical corrugated type, which produces a good Gaussian beam with a high coupling efficiency (98%). To facilitate its production, it was designed to have the shortest slant length possible without degrading its beam pattern, which reduces the number of necessary corrugations (Baryshev & Wild 2001).
The back piece contains the SIS device with backshort cavity, a miniature coaxial GPO connector to export the IF signal, and a small heater resistor (the “deflux heater”), enabling the mixer temperature to be lifted above temporarily in order to get rid of magnetic flux trapped in the superconducting film near the SIS junction.
The back piece is aligned with the horn by an accurately machined centering ring. Two pole pieces penetrate the ring to bring the magnetic field as close as possible to the junction. The pole pieces also take care of the angular alignment of the back piece to the horn.
2.3.2 Mixer mounting
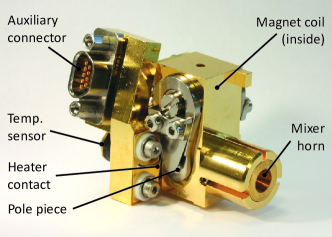
The mixer, as described above, is mounted into a mixer holder (Fig. 4) that, in turn, is clamped into the optics assembly. The mixer holder contains a superconducting magnet coil for Josephson-current suppression and magnetic flux conductors to bring the field to the inner pole pieces of the mixer. When inserting the mixer into the holder, the GPO IF connector in the mixer back piece is blind-mated to a GPO-to-SMA adapter by way of a coaxial “bullet”, and at the same time, the deflux heater in the back piece is contacted by a spring contact. Finally, the mixer holder contains a Si-diode temperature sensor.
2.4 Superconducting tunnel devices
For Band 9 (602–720 GHz) the decision was taken to use an all-niobium technology, rather than the more complex technology used for Herschel’s HIFI Band 3 and Band 4, in which niobium tunnel junctions are integrated with a highly conductive aluminum microstrip over a groundplane of the high-gap superconductor NbTiN (Jackson et al. 2001). Since the superconducting energy gap of niobium of (at best) 2.9 meV corresponds to 700 GHz, no deterioration of niobium by poor deposition conditions could be tolerated (for instance, the and superconducting gap of niobium depend strongly on built-in oxygen).
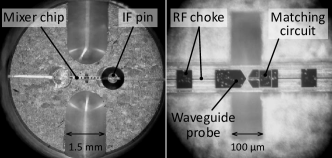
The mixer chip consists of a 40 m quartz substrate on which the SIS tunnel junctions and impedance networks are processed. The superconducting circuitry consists of a symmetrical bow-tie waveguide probe to couple the radiation coming from the horn, a stripline impedance-matching network between the probe and the SIS junction, followed by a path to transport the IF signal and DC bias. This IF signal path also contains an RF choke structure to prevent the RF signal to leak out to the IF channel. The mixer chip is located in front of a fixed waveguide backshort to maximize the electromagnetic coupling. The dimensions of the probe and the backshort were optimized using Ansoft HFSS333Ansoft Corporation, Four Station Square, Suite 200, Pittsburgh, PA 15219-1119, USA. and CST Microwave Studio444Microwave Studio, Connecticut, MA, USA (2006). Available online: http://www.cst.com/.. The same was done, though independently, to optimize the dimensions of the RF choke structure and the channel where the chip is mounted.
The coverage of the full band is first of all determined by the RC time constant of the tunnel junction. Since both R and C scale with the area, the RC bandwidth can not be increased by changing the lateral dimensions, but only by using a tunnel barrier as thin as possible, taking advantage of the fact that the resistance depends exponentially on thickness (it is a quantum-mechanical tunneling process), while the capacitance depends linearly. This requirement leads to tunnel barriers with thicknesses in the 1–2 nm range, with typical resistance per area values for aluminum-oxide tunnel barriers of maximally 25 m2. The area of the SIS junctions is chosen to provide a termination in a load. Since the chips will be connected to a 50 output, the aim in the fabrication of the SIS junctions was to have a normal resistance of 25 . Fixing the resistance of the junction and its area and knowing the input impedance of the waveguide probe, the dimensions of the matching network can be calculated. Standard transmission line theory was employed, using the theory of the anomalous skin effect for the complex conductivity of Nb (Lodewijk et al. 2007). This technology was used for the first eight cartridges in 2009.
Using the existing aluminum oxide tunnel barrier technology as the baseline for the coverage of Band 9, with the lowest possible noise temperature, remained a challenge. The upper part of the band could potentially be improved by the use of Herschel’s HIFI technology, using NbTiN for the impedance network. A more pressing problem, however, was that a better coverage of the atmospheric band would require even thinner tunnel barriers, which is not reliably achievable with aluminum oxide and therefore would cause a rapid decline in production yield. In view of some indications that aluminum nitride barriers might allow lower values without deterioration of the quality of the non-linear current-voltage characteristics, a program was started to develop such a tunnel barrier process (Zijlstra et al. 2007) using a plasma source to create the chemically active nitrogen radicals. The success of this development led to the inclusion of this device technology in the remaining Band 9 cartridges.
2.4.1 SIS device fabrication
The AlOx barrier SIS devices are fabricated on a 200 m thick quartz substrate (Lodewijk et al. 2007; Mena et al. 2011; Zijlstra et al. 2007). First, a sacrificial Nb monitor layer is deposited, followed by an optically defined trilayer of Nb/Al/AlOx/Nb. The thickness of the Al layer is 5–7 nm, the top and bottom niobium layers are 100 nm thick. Junctions are defined by electron-beam lithography using negative SAL601 resist and etched in a mixture of SF6/O2 reactive ion etch (RIE) plasma. The AlOx layer acts as an etch stop for the ground plane. The junction resist pattern is subsequently used as a lift-off mask for a sputter-deposited dielectric layer of SiO2. A Nb/Au top layer is deposited to define the top wire and contact pads. The Au is wet-etched in a KI/I2 solution using an optically defined window. Finally, using an e-beam defined top wire mask pattern, the top layer of Nb is etched in a SF6/O2 RIE plasma, which finishes the fabrication process.
An identical process is used for junctions with AlN tunnel barriers, except for the barrier growth itself. AlN is formed by exposing the Al over-layer to the after-glow region of a nitrogen plasma from an inductively coupled plasma source. The source is operated at a pressure of mbar and a power set point of 550 W; source to wafer distance is fixed at 10 cm. Using nitridation time as a control parameter, we made Nb/Al/AlN/Nb trilayers yielding critical current densities in the range of 20–40 kAcm-2.
2.4.2 SIS performance verification
The fabrication process results in hundreds of devices on a single wafer. After dicing the wafer, the mixer chips are first tested in a dip stick for their I-V characteristics. Those showing good results are mounted in a DSB mixer block which is installed inside a small test cryostat, where they are tested for frequency band coverage using a Fourier transform spectrometer. When the band coverage is found to be adequate, the devices are transferred to a heterodyne test cryostat. This cryostat uses the same window and IF chain as the cartridge cryostat, but the LO is generated at room temperature. The junctions showing the best noise temperatures are chosen to be installed in the receiver cartridges. On average, the measured noise temperatures in the test cryostat were about 20 K higher than those obtained when they are integrated in the receiver and tested in the cartridge cryostat. The improved noise temperature in the cartridge is mostly attributable to the reduced contribution of the black-body background radiation from the final LO multiplier, due to its lower physical temperature (110 K vs. 300 K) and the thinner beam splitter (6 m vs. 12 m) employed in the cartridge. In both cases, the electronic noise of the LO itself is expected to be comparable.
2.5 IF chain
The IF output of the mixer first passes through an isolator and then to a low noise amplifier (LNA), both on the 4 K stage of the cartridge. The 4–12 GHz isolator (circulator) was developed under contract by Pamtech555Passive Microwave Technology, Inc., Camarillo, CA, USA. [Now part of QuinStar Technology, Inc., Torrance, CA, USA] and the amplifier at Centro Astronómico Yebes (López-Fernández et al. 2006). The amplifier has three stages of amplification using InP high electron-mobility transistors. Finally, an extra amplification of the IF signal is done immediately outside the cold cartridge using commercial amplifiers, prior to being exported to the telescope’s IF system. The IF cables between the temperature stages are made out of stainless steel and are thermally anchored at each stage to minimize heat input to the 4 K system. On the 12 K stage there are 3–5 dB attenuators which are matched to the respective LNA gains in order to equalize the IF output powers between cartridges.
2.6 LO unit
The LO signal is generated by a YIG oscillator and an electronically tunable solid-state chain of power amplifiers and multipliers (Bryerton et al. 2005). The YIG and the first stage of the chain, a multiplier () and a power amplifier, are placed outside the cryostat in the LO unit. This unit also contains a PLL system that locks the YIG signal to the photonic reference signal distributed to the ALMA antennas.
Since it was considered impractical to couple a 600 to 720 GHz signal from the air side into the vacuum space (either quasi-optically or through a waveguide), and also because of noise considerations, the final multiplication is done in vacuum, on the 110 K stage (Hesper et al. 2005). A WR12 waveguide transports the 66–80 GHz signal to the multiplier block, using a thin mica window as a vacuum barrier.
2.7 Integration
The different components described in the previous sections are integrated in a standard ALMA cartridge body according to the layout presented in Sect. 2.1. Figure 5 presents the integrated receiver cartridge. The assembly is performed from bottom to top and the cartridge construction allows for easy access to most of the critical components in case of service or repair. All components can be built in and out without need of mechanical adjustment, since alignment is achieved by machining tolerances only. In particuler, the mixers can be replaced in very short time without any major disassembly.
3 Laboratory results
3.1 Performance
For laboratory testing, every fabricated receiver is introduced in a single-cartridge ALMA test cryostat (Sekimoto et al. 2003). An automated measurement system (Barkhof et al. 2009), based on scripted measurement routines, has been built to perform the receiver characterization in a uniform and consistent way for 73 Band 9 cartridges.
Several important receiver characteristics such as sensitivity, gain compression, receiver stability and beam parameters have been characterized and results are presented in following sections. Where statistical values are presented, these apply to 15 receivers containing AlOx junctions and up to 52 receivers containing AlN junctions.
3.1.1 Receiver beam parameters
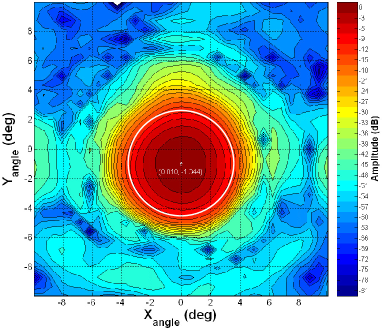
The receiver beam parameters are determined by measuring 2D near-field phase and amplitude scans for both polarization channels. The measurement system is conceptually similar to the one described in Carter et al. (2002); Baryshev et al. (2004a) and consists of a 3D scanner, which is mounted above the test cryostat; a beam probe, utilizing a corrugated feedhorn integrated with a harmonic generator based on a superlattice device (Paveliev et al. 2005) and microwave circuitry to create a reference signal. Phase and amplitude in each scan point are registered by a vector network analyzer. 2D beam maps are scanned in two planes perpendicular to the beam propagation axis and offset along the propagation axis by a quarter wavelength of the measurement frequency. The final beam map is constructed out of these two scans by adding them with a 90 degree phase shift, allowing numerical compensation of the parasitic signals associated with standing waves between the probe and SIS mixer. The far field beam map is then obtained from the near field data by a complex Fourier transform. An example of such a far field beam map is presented in Fig. 6 with the angular extent of the secondary mirror shown as a white circle. Most of the beam parameters such as aperture efficiency, beam squint beam propagation angles can be readily determined from this far field map (Baars 2003). The typical dynamic range in the data is 70 dB, which allows for high accuracy data reduction. The statistical distribution of measured beam parameters for a large set of ALMA Band 9 receivers is shown in Table 2.
| PARAMETER | SYMBOL | VALUE | |
|---|---|---|---|
| Angle (°) | 0.075 | ||
| 0.075 | |||
| Focus Position (mm) | 0.504 | ||
| 0.271 | |||
| 3.004 | |||
| 0.075 | |||
| Efficiencies (%) | 0.81 | ||
| 1.47 | |||
| 0.10 | |||
| 0.23 | |||
| 0.10 | |||
| 0.90 | |||
| Beam Squint (%) | — | 2.29 | |
The cross polarization characteristics of the receivers are measured by inserting a motorized polarizing grid into the receiver beam which, depending on wire orientation, couples either a 300 K or 77 K calibration load signal into each polarization channel. By rotating the polarizer by 360 degrees and measuring the output signal of the receiver at the same time one obtains the cross polarization value for the receiver. A typical cross polarization response has been found to be to dB for all cartridges.
3.1.2 Noise temperature
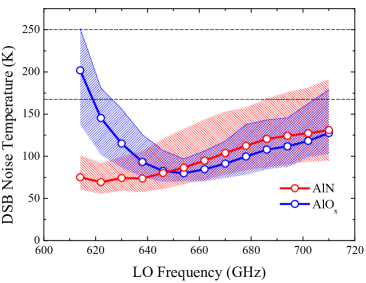
The noise temperatures are measured using the standard Y-factor method, with hot and cold loads at room temperature and 77 K, respectively. Figure 7 presents the best noise temperature averaged over a large ensamble of receivers at 12 different LO frequencies. The noise in this figure is integrated over the full 4–12 GHz IF band. It is apparent from the figure that AlN junctions cover the band more effectively as they have higher critical current densities than AlOx junctions while still having DC I-V characteristics of sufficient quality (Zijlstra et al. 2007). In Fig. 7 we also present the statistical spread for all cartridges, demonstrating that all the receivers perform better than the ALMA specifications (cf. Table 1) with margin.
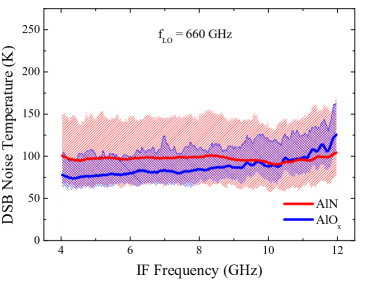
To determine the noise temperature as a function of IF, an electronically tunable YIG filter is used at the end of the IF chain. The measured IF noise is shown in Fig. 8. Covering such an extremely large frequency range presents a significant technical challenge. As seen in the figure, AlN-barrier based SIS mixers perform better than AlOx-barrier junctions at higher IF frequencies, which can be explained by the smaller parasitic parallel capacitance and lower output impedance achieved for AlN tunnel barrier junctions.
3.1.3 Gain compression
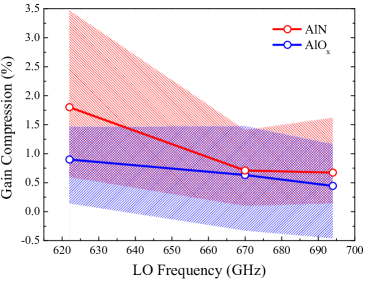
We have measured the gain compression using the method described in detail in Baryshev et al. (2004a). The receiver gain was measured by inserting a small, varying, chopped, signal into the receiver beam on top of the large background created by means of a motorized polarizing grid reflecting either 77 K or 373 K black-body radiation into the receiver beam. The small varying signal is than synchronously detected by a lock-in amplifier allowing high signal-to-noise measurements. The average gain compression over 67 receivers and its statistical variation is presented in Fig. 9. Gain compression does not depend strongly on the type of junction since it is mostly determined by the embedding IF impedance seen by the SIS junction and by the operation frequency (Kerr 2002). All measured values lie within the 4% gain compression range for 373 K load temperature as required by ALMA specifications.
4 First-light and scientific results
4.1 Commissioning
During the commissioning of ALMA from the fall of 2010 to the spring of 2012, a large number of tests were performed to characterize the performance of Band 9 at the Array Operations Site (AOS), both on sky and on loads. In this section, several of the tests performed on sky are presented to demonstrate the successful commissioning and current performance characteristics of the Band 9 receivers. All tests were performed using the, at that time, most up-to-date available array at the AOS, consisting mostly of Vertex antennas with, occasionally, a few Melco and AEM antennas integrated into the array.
First a quasar was tracked for one hour to show the phase stability. The quasar in question is J1924-292. Then a test in which four quasars around the bright quasar J0538-441 were observed, is presented. The four quasars are J0538-440, J0423-013, J0730-116 and J0522-364. We also show some of the results derived from the Science Verification data sets on both the calibration targets and the science target, IRAS 16293-2422, taken during commissioning time to verify Band 9 performance. For all tests, the number of antennas shown is limited, but the performance on most other antennas are very similar.
4.2 Quasar tracking
| Baseline | Physical length | Projected Length | Mean Phase | Phase RMS | Mean Amplitude | Amplitude RMS |
|---|---|---|---|---|---|---|
| m | m | deg | deg | 10-5 | 10-5 | |
| DV03-DV06 | ||||||
| DV02-DV06 | ||||||
| DV05-DV06 | ||||||
| DV02-DV12 | ||||||
| DV02-DV05 |
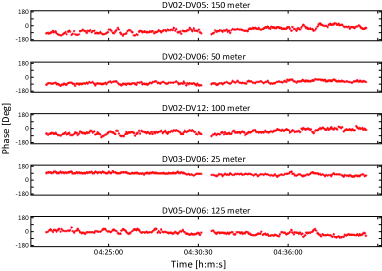
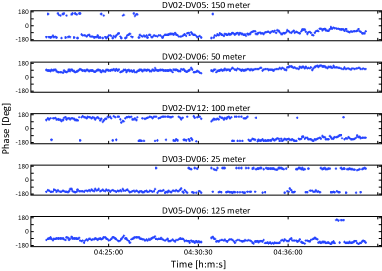
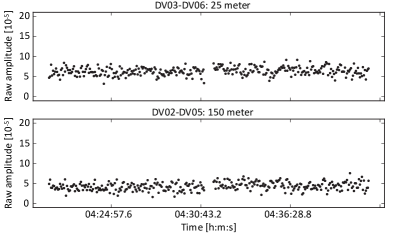
On September 11, 2011, ALMA observed the quasar J1924-292 (RA=19:24:51.056, Dec=:14:30.121, J2000) for 20 minutes in Band 9 using 13 antennas in dual polarization to track the phase and amplitude stability. At the time of observing, J1924-292 was one of the brightest quasars in the sky at these high frequencies. Although no actual flux measurement was done at 690 GHz at this time, comparison from previous measurements in Band 9, and extrapolations from Band 3 and 6 measurements a week before and after, an estimate of the flux at around 4 Jy with an error of 0.5 Jy could be made. The phases and amplitudes on a large number of different baselines are inspected. At the time of observations, commissioning of several modes was still ongoing. The analysis has been limited to a few selected baselines. The baselines are chosen to sample projected baseline lengths of the array, which was being built up toward the start of Early Science and thus consist mostly of short (200 m) baseline lengths. Five baselines were selected, ranging from 25 to 150 m, with projected baselines of 24.2 to 110.5 m. The results can be seen in Fig. 10, which shows the phase stability in the two polarizations. The precipitable water vapor during the observation was measured at 0.20.02 mm and very stable conditions. The target was between 35 and 40 degrees elevation, relatively far from the highest transit. All phases are extremely flat with RMS numbers of 30–35 degrees. Only the short baseline was slightly higher due to a very small delay trend in antenna DV03. The amplitudes also agree very well with each other and the RMS in the uncalibrated amplitudes is almost equal at all baseline lengths (Fig. 11).
The mean phase and amplitude are summarized in Table 3. All numbers are given uncalibrated and uncorrected from the radiometer. Corrections using the water vapor radiometer solutions, derived using the WVRGCAL software (Nikolic et al. 2012), were applied in the test and found to only marginally improve the data, likely due to the very dry conditions. The overall stability is very good (phase noise smaller than , amplitude noise normalized to the peak flux of the quasar) over the half hour test with excellent stability in all receivers. When taking the brightness of the source, baseline lengths and weather into consideration, the spread in the phase and amplitude RMS is dominated by the remaining atmospheric conditions. In addition, since five unique cartridges were used in the analysis, the stability of the receivers compared to each other is very similar. Comparison was done to the cartridges not displayed and the same results were obtained for all cartridges.
4.3 Four-quasar experiment
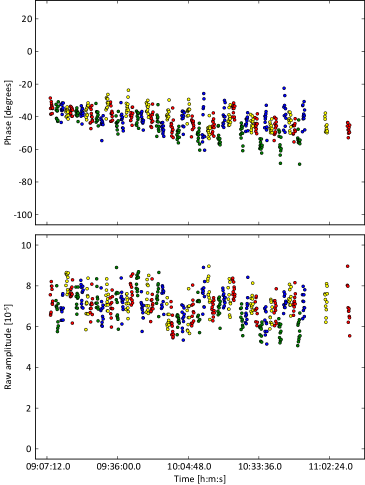
In the southern sky, a set of four relatively bright quasars can be found within an hour angle of approximately three hours, at similar declinations. These four quasars are J0538-440 (3.0 Jy, Oct 13, 2011), J0423-013 (2.2 Jy Oct 1, 2011), J0730-116 (0.5 Jy, Oct 13, 2011) and J0522-364 (4.1 Jy, Sep 9, 2011). Fluxes are given at 343 GHz (Band 7) with the date of measurement closest to the measurement taken for phase transfer. Although these quasars are significantly weaker at short wavelengths, they are all detectable in Band 9. An experiment was done on October 6th, 2011 to observe this set for two hours. Each quasar was observed for 60 seconds before looping to the next. This entire sequence was then repeated ten times. This test is aimed to demonstrate phase transfer between sources across the sky, as well as the ability to apply phase solutions of the brightest source (in this case J0522-364 or J0538-440) to the other sources. The configuration, and thus the distribution of baselines, were similar to those in the stability experiment described above.
Figure 12 shows the phases (top) and amplitudes (bottom) of all four sources over the two-hour track binned to 5 seconds timebins on a baseline of 90 m. Coherence on all quasars is excellent. Overall, phase RMS ranges from 10 to 25 degrees, while the RMS of the amplitudes is 10 to 20 percent, relative to the mean value of each source. The observed spread in RMS depends on the individual source brightnesses and the elevation of each scan. Note that the uncalibrated raw amplitudes are plotted. No system temperature measurements were done during this track, preventing us from calibrating the amplitudes. Similarly, the phase RMS of the third source (in blue) increases as a function of time due to the decreasing elevation. It can be concluded that the Band 9 performance is excellent in these on-sky tests.
4.4 Science
4.4.1 Science verification: IRAS 16293-2422
Science Verification of Band 9 was undertaken on April 16 and 17, 2012, targeting the well-known Class 0 proto-binary IRAS 16923-2322666ADS/JAO.ALMA#2011.0.00007.SV (e.g., Wootten 1989; Mundy et al. 1992; Chandler et al. 2005). This -separation system drives two large-scale bipolar outflows (e.g., Stark et al. 2004), and both A and B components show large numbers of rotational lines of complex organic molecules (e.g., van Dishoeck et al. 1995; Jørgensen et al. 2011). ALMA Band 6 data reveal infall motions toward source B (Pineda et al. 2012).
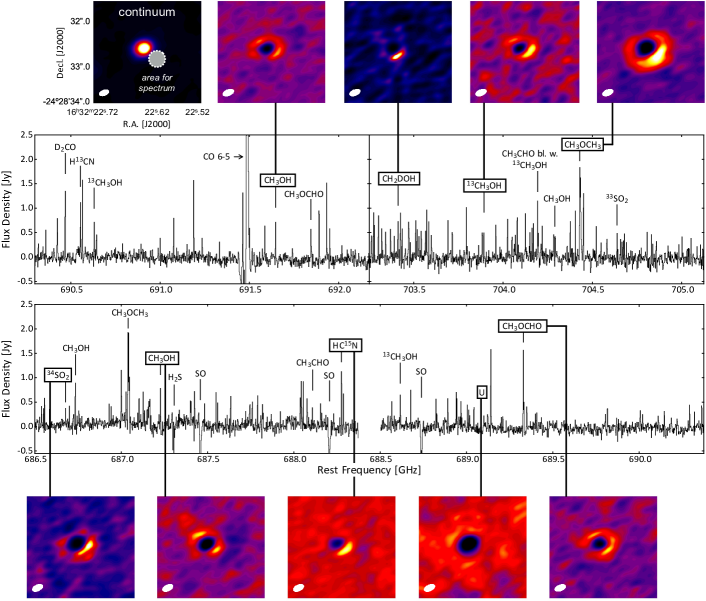
A total of 9.2 hours were spent on a seven-point mosaic and the necessary calibration with ALMA in a Cycle 0 extended configuration, resulting in a resolution of 0 22. The four spectral windows were chosen to optimize the available transmission and include the strongest galactic emission line in Band 9, 12CO =6–5 at 691.47308 GHz. More detailed information on the observations and calibration can be found in the CASA guide777http://casaguides.nrao.edu/index.php?title=IRAS16293Band9.
At the time of writing, the scientific results obtained from this single data set include the confirmation of the detection of glycolaldehyde, a simple sugar (Jørgensen et al. 2012), detection of hot HO and constraints on the deuteration of 100 K water (Persson et al. 2013), and the interaction of one of the outflows from source A with the surrounding medium as traced through warm CO gas (Kristensen et al. 2013; Loinard et al. 2012; Zapata et al. 2013).
Figure 13 shows the complete Band 9 spectrum of IRAS 16293-2422 B, obtained as part of this Science Verification observation. The four spectral windows are binned to a resolution of 1.95 MHz (0.8 km s-1) and the spectrum is averaged over a region centered on source B. Over 100 emission lines are clearly visible in the spectrum. A subset of lines, most of them also seen by Schilke et al. (2001) in Orion KL, are labeled. Most lines are transitions from organic molecules such as methanol and their 13C or deuterated isotopologues. Many unlabeled lines are tentatively associated with species like C3H2, CH3OCH3 and CH3CHO. Such species have been detected at lower frequencies (e.g., Bottinelli et al. 2004; Kuan et al. 2004; Bisschop et al. 2008; Jørgensen et al. 2011). Both H13CN and HC15N are clearly seen. few absorption features are also visble, caused by simple molecules like H2S in cold foreground gas. Note that the CO =6–5 line profile is heavily affected by the adopted cleaning strategy, which was optimized for weak spatially unresolved lines in source B. CO =6–5 emission extends over a large area (Kristensen et al. 2013), and is thus not correctly cleaned. In addition, it suffers from filtering due to the absence of short baselines.
4.4.2 Scientific performance
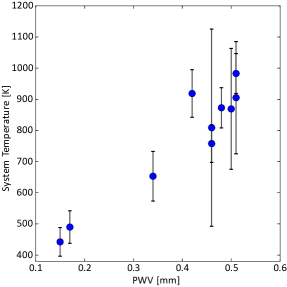
Thus far, Band 9 has been used under the best conditions available at Chajnantor. Figure 14 shows the mean system temperatures, together with standard deviations, of all unflagged antennes in the various arrays used for Band 9 scientific executions so far. The atmosphere is the main noise contributor, but system temperatures smaller than 1000 K are achieved for all executions. The executions under the best weather (0.2 mm of precipitable water vapor, PWV) approach the mean value expected for the receiver temperatures of double sideband receivers.
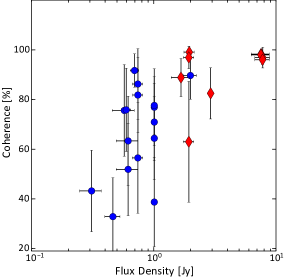
As a test of scientific quality, Fig. 15 shows the coherence of all calibrators. Blue circles are the gain calibrators, while red diamonds are the bandpass calibrators. Coherences are calculated after application of the water vapor radiometer solutions and plotted for their respective bandwidths; the full spectral window width for gain calibrators and the bandpass required channel width for bandpass calibrators. Typical phase coherences for good bandpass need to be at least 50% or higher. Note that some projects required multiple executions within a night, resulting in multiple measurements of the same calibrator in quick succession. Gain calibration requires less coherence as all spectral windows can be averaged to obtain better solutions. The distance of the source to the science target also influences the quality of the gain solutions; calibrators close to the science target require less coherence to provide adequate gain solutions.
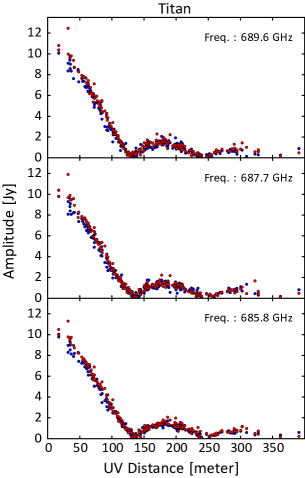
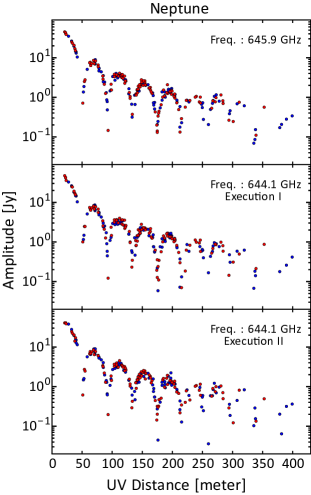
Figure 16 shows a few amplitudes of absolute flux calibrators used for science observations plotted as function of the baseline length. At Band 9 frequencies, many solar system objects are heavily resolved out (see, e.g., Neptune). Titan, the Jovian Moons and asteroids are good absolute flux calibrator candidates in the immediate future of ALMA. However, it is clear that although ALMA will heavily resolve all solar system objects at baselines beyond one kilometer, inclusion of a sufficient number of short baselines allows for accurate absolute flux calibration. Whether this applies to baselines beyond three kilometers is currently being investigated.
4.4.3 Early science results using Band 9 observations
Since the start of ALMA Cycle 0, a number of studies have used observations from Band 9. van der Marel et al. (2013) revealed the existence of a highly asymmetric dust trap in the disk around the protostar Oph IRS 48 from Band 9 continuum. Emission lines in the same dataset were used to study the gas structure within the dust cavity (Bruderer et al. 2014) and to reveal the existence of warm organic molecules in transition disks (van der Marel et al. 2014). Recently, other Band 9 observations have shown similar asymmetries in other disks (Pérez et al. 2014).
Another Band 9 project used continuum observations of SN1987A to conclude that such supernovae may be cosmologically important producers of dust (Indebetouw et al. 2014; Zanardo et al. 2014). In the field of evolved stars, Bujarrabal et al. (2013) included observations of 12CO 6–5 in their analysis of the gas kinematics of the post-AGB object the Red Rectangle. Recently, Decin et al. (2014) used Band 9 to reveal the presence of spiral structure in the inner wind of CW Leo. Extragalacticly, García-Burillo et al. (2014); Viti et al. (2014) observed an AGN-driven outflow in NGC 1068 with the continuum and CO 6–5 at 690 GHz.
5 Conclusions
We have presented details of the design, construction and laboratory testing of the entire suite of receivers for Band 9 of ALMA. The laboratory results show that all receivers complied with ALMA specifications prior to integration in the ALMA antennas. Furthermore, we have presented several examples of the performance of these receivers as installed in ALMA. Results on phase and amplitude stability are presented. These results show the extraordinary performance of the receivers both in the lab and on the telescope. In addition, Early Science results demonstrate that Band 9 delivers high quality data and offers exciting prospects for future science observations.
Acknowledgements.
We would like to thank JAO, ESO (especially the Front-End IPT group), NRAO, NAOJ and the CSV team for their support and collaboration in this project. Part of this work was supported by NOVA, the Netherlands Research School For Astronomy. This paper makes use of the following ALMA data: ADS/JAO.ALMA#2011.0.00007.SV. ALMA is a partnership of ESO (representing its member states), NSF (USA) and NINS (Japan), together with NRC (Canada) and NSC and ASIAA (Taiwan), in cooperation with the Republic of Chile. The Joint ALMA Observatory (JAO) is operated by ESO, AUI/NRAO and NAOJ.References
- Baars (2003) Baars, J. 2003, in ALMA Memo Series, Memo 456
- Barkhof et al. (2009) Barkhof, J., Jackson, B., Baryshev, A., & Hesper, R. 2009, in 20th International Symposium on Space Terahertz Technology, Charlottesville, 20–22
- Baryshev et al. (2004a) Baryshev, A., Carter, M., Candotti, M., Trappe, N., & Murphy, J. 2004a, in Infrared and Millimeter Waves, 2004 and 12th International Conference on Terahertz Electronics, 2004. Conference Digest of the 2004 Joint 29th International Conference on, IEEE, 769–770
- Baryshev et al. (2004b) Baryshev, A., Carter, M., Jellema, W., & Hesper, R. 2004b, in ESA Special Publication, Vol. 554, 5th International Conference on Space Optics, ed. B. Warmbein, 365–371
- Baryshev et al. (2006) Baryshev, A. M., Candotti, M., & Trappe, N. A. 2006, in ALMA Memo Series, Memo 551
- Baryshev & Wild (2001) Baryshev, A. M. & Wild, W. 2001, in ALMA Memo Series, Memo 394
- Bisschop et al. (2008) Bisschop, S. E., Jørgensen, J. K., Bourke, T. L., Bottinelli, S., & van Dishoeck, E. F. 2008, A&A, 488, 959
- Bottinelli et al. (2004) Bottinelli, S., Ceccarelli, C., Neri, R., et al. 2004, 617, L69
- Bruderer et al. (2014) Bruderer, S., van der Marel, N., van Dishoeck, E. F., & van Kempen, T. A. 2014, A&A, 562, 26
- Bryerton et al. (2005) Bryerton, E., Saini, K., Morgan, M., et al. 2005, in The Joint 30th International Conference on Infrared and Millimeter Waves and 13th International Conference on Terahertz Electronics, 72–73
- Bujarrabal et al. (2013) Bujarrabal, V., Castro-Carrizo, A., Alcolea, J., et al. 2013, A&A, 557, L11
- Candotti et al. (2009) Candotti, M., Baryshev, A. M., & Trappe, N. 2009, Infrared Physics & Technology, 52, 174
- Carter et al. (2002) Carter, M., Baryshev, A., Hesper, R., et al. 2002, in Thirteenth International Symposium on Space Terahertz Technology, Vol. 1, 515–524
- Carter et al. (2004) Carter, M. C., Baryshev, A., Harman, M., et al. 2004, Proc. SPIE, 5489, 1074
- Chandler et al. (2005) Chandler, C. J., Brogan, C. L., Shirley, Y. L., & Loinard, L. 2005, ApJ, 632, 371
- Decin et al. (2014) Decin, L., Richards, A. M. S., Neufeld, D., et al. 2014, arXiv, 1410.2060v1
- García-Burillo et al. (2014) García-Burillo, S., Combes, F., Usero, A., et al. 2014, A&A, 567, A125
- Hesper et al. (2009) Hesper, R., Gerlofsma, G., Mena, F. P., Spaans, M. C., & Baryshev, A. M. 2009, in Twentieth International Symposium on Space Terahertz Technology, Charlottesville, 257–260
- Hesper et al. (2005) Hesper, R., Jackson, B. D., Baryshev, A. M., et al. 2005, in Sixteenth International Symposium on Space Terahertz Technology, 110–115
- Indebetouw et al. (2014) Indebetouw, R., Matsuura, M., Dwek, E., et al. 2014, ApJ, 782, L2
- Jackson et al. (2001) Jackson, B. D., Baryshev, A. M., de Lange, G., et al. 2001, Appl. Phys. Lett., 79, 436
- Jørgensen et al. (2011) Jørgensen, J. K., Bourke, T. L., Nguyen Luong, Q., & Takakuwa, S. 2011, A&A, 534, 100
- Jørgensen et al. (2012) Jørgensen, J. K., Favre, C., Bisschop, S. E., et al. 2012, ApJ, 757, L4
- Kerr (2002) Kerr, A. R. 2002, in ALMA Memo Series, Memo 401
- Khudchenko et al. (2012) Khudchenko, A., Hesper, R., Baryshev, A., et al. 2012, Sideband separating mixer for 600-720 GHz for ALMA band 9 upgrade
- Khudchenko et al. (2011) Khudchenko, A., Hesper, R., Baryshev, A., et al. 2011, in Twenty-Second International Symposium on Space Terahertz Technology, Charlottesville, 6–4
- Koller et al. (2003) Koller, D., Kerr, A. R., Lamb, J. W., & Ediss, G. A. 2003, in ALMA Memo Series, Memo 397
- Kristensen et al. (2013) Kristensen, L. E., Klaassen, P. D., Mottram, J. C., Schmalzl, M., & Hogerheijde, M. R. 2013, A&A, 549, L6
- Kuan et al. (2004) Kuan, Y.-J., Huang, H.-C., Charnley, S. B., et al. 2004, 616, L27
- Lodewijk et al. (2007) Lodewijk, C. F. J., Noroozian, O., Loudkov, D. N., et al. 2007, Applied Superconductivity, IEEE Transactions on, 17, 375
- Loinard et al. (2012) Loinard, L., Zapata, L. A., Rodríguez, L. F., et al. 2012, Monthly Notices of the Royal Astronomical Society: Letters, L35
- López-Fernández et al. (2006) López-Fernández, I., Gallego, J. D., Diez, C., & Barcia, A. 2006, in 2006 IEEE MTT-S Int. Microwave Symp. Dig., 1907–1910
- Mena et al. (2011) Mena, F. P., Kooi, J. W., Baryshev, A. M., et al. 2011, IEEE Transactions on Microwave Theory and Techniques, 59, 166
- Mundy et al. (1992) Mundy, L. G., Wootten, A., Wilking, B. A., Blake, G. A., & Sargent, A. I. 1992, ApJ, 385, 306
- Nikolic et al. (2013) Nikolic, B., Bolton, R., Graves, S., Hills, R., & Richer, J. 2013, A&A, 552, A104
- Nikolic et al. (2012) Nikolic, B., Graves, S. F., Bolton, R. C., & Richer, J. S. 2012, arXiv, 1207.6069
- Paveliev et al. (2005) Paveliev, D., Koschurinov, I. Y., Lewen, F., et al. 2005, in Infrared and Millimeter Waves and 13th International Conference on Terahertz Electronics, 2005. IRMMW-THz 2005. The Joint 30th International Conference on, Vol. 1, IEEE, 140–141
- Pérez et al. (2014) Pérez, L. M., Isella, A., Carpenter, J. M., & Chandler, C. J. 2014, ApJ, 783, L13
- Persson et al. (2013) Persson, M. V., Jørgensen, J. K., & van Dishoeck, E. F. 2013, A&A, 549, L3
- Pineda et al. (2012) Pineda, J. E., Maury, A. J., Fuller, G. A., et al. 2012, A&A, 544, L7
- Schilke et al. (2001) Schilke, P., Benford, D. J., Hunter, T. R., Lis, D. C., & Phillips, T. G. 2001, ApJS, 132, 281
- Sekimoto et al. (2003) Sekimoto, T., Kamba, T., Yokogama, S., et al. 2003, in ALMA Memo Series, Memo 455
- Stark et al. (2004) Stark, R., Sandell, G., Beck, S. C., et al. 2004, ApJ, 608, 341
- Sugimoto et al. (2004) Sugimoto, M., Sekimoto, Y., Tatematsu, K., et al. 2004, Publ. Astron. Soc. Japan, 56, 1115
- van der Marel et al. (2013) van der Marel, N., van Dishoeck, E. F., Bruderer, S., et al. 2013, Science, 340, 1199
- van der Marel et al. (2014) van der Marel, N., van Dishoeck, E. F., Bruderer, S., & van Kempen, T. A. 2014, A&A, 563, A113
- van Dishoeck et al. (1995) van Dishoeck, E. F., Blake, G. A., Jansen, D. J., & Groesbeck, T. D. 1995, ApJ, 447, 760
- Viti et al. (2014) Viti, S., García-Burillo, S., Fuente, A., et al. 2014, A&A, 570, A28
- Wild & Payne (2001) Wild, W. & Payne, J. 2001, ALMA Specification: Specifications for the ALMA Front End Assembly, available at http://www.cv.nrao.edu/~awootten/mmaimcal/asac/ALMA_FE_specs_V20.pdf
- Wild et al. (2002) Wild, W., Payne, J., Lamb, J. W., et al. 2002, in ALMA Construction Project Book, ed. J. Baars
- Wootten (1989) Wootten, A. 1989, ApJ, 337, 858
- Wootten & Thompson (2009) Wootten, A. & Thompson, A. 2009, Proceedings of the IEEE, 97, 1463
- Zanardo et al. (2014) Zanardo, G., Staveley-Smith, L., Indebetouw, R., et al. 2014, arXiv, 1409.7811
- Zapata et al. (2013) Zapata, L. A., Loinard, L., Rodríguez, L. F., et al. 2013, ApJ, 764, L14
- Zijlstra et al. (2007) Zijlstra, T., Lodewijk, C. F. J., Vercruyssen, N., et al. 2007, Appl. Phys. Lett., 91, 233102