DISCOVERY OF A DISK GAP CANDIDATE AT 20 AU IN TW HYDRAE
Abstract
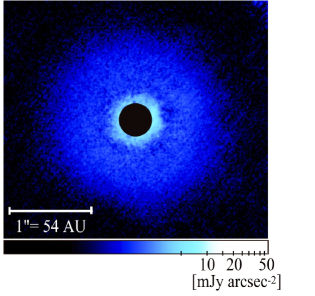
We present a new Subaru/HiCIAO high-contrast H-band polarized intensity (PI) image of a nearby transitional disk associated with TW Hydrae. The scattered light from the disk was detected from 02 to 15 (11 – 81 AU) and the PI image shows a clear axisymmetric depression in polarized intensity at 04 ( 20 AU) from the central star, similar to the 80 AU gap previously reported from HST images. Azimuthal polarized intensity profile also shows the disk beyond 02 is almost axisymmetric. We discuss two possible scenarios explaining the origin of the polarized intensity depression: 1) a gap structure may exist at 20 AU from the central star because of shallow slope seen in the polarized intensity profile, and 2) grain growth may be occurring in the inner region of the disk. Multi-band observations at NIR and millimeter/sub-millimeter wavelengths play a complementary role in investigating dust opacity and may help reveal the origin of the gap more precisely.
Subject headings:
planetary systems — protoplanetary disks — stars: pre-main sequence — stars: individual (TW Hydra) — techniques: polarimetric1. INTRODUCTION
The structures of young circumstellar disks can reveal key insights into the formation and evolution of planetary systems. Complex structures such as gaps, holes, spiral arms, or asymmetric structures have been imaged in a number of protoplanetary disks at near-infrared (NIR) and millimeter/sub-millimeter wavelengths (Hashimoto et al., 2011, 2012; Andrews et al., 2011; Muto et al., 2012; Isella et al., 2013; Grady et al., 2013; Fukawaga et al., 2013; Mayama et al., 2012; Currie et al., 2014) and they are predicted in theoretical simulations throughout the literature: a planet embedded in a viscous disk (Muto et. al., 2010; Zhu et al., 2011), photoevaporation (Clarke et al., 2001; Owen et al., 2011a; Owenet al., 2011b), and grain growth (Birnstielet al., 2012b).
The 7–10 Myr old (Ducourant et al., 2014) pre-main sequence M2 (Debes et al., 2013) star TW Hydrae (hereafter TW Hya) shows particularly strong evidence for a disk making a transition from a pre-planet building morphology to a post-planet building structure (e.g. Strom et al., 1989). TW Hya, with 0.55 0.15 in stellar mass (Debes et al., 2013) and more than 0.05 in disk mass (Bergin et al., 2013), is an ideal example of transitional disks in that it is almost face-on ( = 7°; Qi et al., 2004) and because of its close distance of 54 6 pc (Hipparcos; van Leeuwen 2007), is particularly accommodating to investigations of its geometrical structure with high spatial resolution and sensitivity. Previous studies at optical, near-IR, and mm/sub-mm wavelengths show the radial surface brightness extending to 150 – 230 AU (Krist et al., 2000; Apai et al., 2004; Roberge et al., 2005; Weinberger et al., 2002; Qi et al., 2004, 2006; Andrews et al., 2012). High contrast direct imaging with the Hubble Space Telescope (HST) NICMOS coronagraph reveal a disk gap at 80 AU, indicating the evolution of dust composition or the presence of an embedded protoplanetary system (Debes et al., 2013). The inner hole at 4 AU is observationally predicted from a flux deficit at 2 – 20 in the spectral energy distribution (SED), suggesting a deficit of material left around the central star. Excess at 20 – 60 in the SED is probably due to emission from the truncated inner edge of the outer disk (Calvet et al., 2002). The existence of the inner disk is also supported by interferometric observations and visibility model fitting of the 7 mm continuum (Calvet et al., 2002; Hughes et al., 2007) and a recent modeling concludes that the disk does not have a sharp edge at 4 AU (Menu et. al., 2014).
In this Letter, we present a new -band polarized intensity (PI) image of TW Hya and the polarized intensity distribution ranging from 02 to 15 (corresponding to 11 – 81 AU) of the disk, including the region closer to the central star than the region previously observed by HST. A polarized intensity depression at 04 ( 20 AU), probably caused by a gap in the disk, was detected. Through investigating observed polarized intensity profile, we discuss the disk morphological structure and the origin of the depression.
2. OBSERVATIONS AND DATA REDUCTION
We carried out -band (m) linear polarimetric observations of TW Hya using the High Contrast Instrument for the Subaru Next Generation Adaptive Optics (HiCIAO; Tamura et al., 2006) with a dual-beam polarimeter at the Subaru 8.2 m telescope on March 24th 2011 and January 3rd 2013. These observations were part of the Strategic Explorations of Exoplanets and Disks with Subaru (SEEDS; Tamura, 2009) project. Both of the observations were conducted in the same instrument setting. The polarimetric observation mode acquires o-ray and e-ray simultaneously, and images a field of view 10″ 20″with a pixel scale of 9.50 mas/pixel.
The exposures were performed at four position angles (P.A.s) of the half-wave plate, with a sequence of P.A. = 0°, 45°, 22.5°, and 67.5°, to measure the Stokes parameters. The integration time per wave plate position was set by 10 – 30 s during observation to optimize instrument according to on-site condition. Three coadd modes were used to save the total overhead time. The adaptive optics system (AO188; Hayano et al., 2008) provided mostly stable stellar point-spread function (PSF) with a FWHM of 015 in the H-band. The adaptive optics corrections in both observation dates functioned well and the qualities of resultant images of both observations were almost the same. We strictly selected only good quality of data from among of them for producing the best image. Low quality images were removed prior to production of the final image, resulting in 13 good sets with a total integration time, for the PI image, of 390 s. The data sets were taken with Angular Differential Imaging (ADI) mode with a net field rotation of 12 degrees.
All unflagged data were corrected for field rotation and integrated. The standard imaging method (Hinkley et al., 2009) was applied to the polarimetric data, including corrections for distortion and flat-field, using the Image Reduction and Analysis Facility (IRAF111IRAF is distributed by National Optical Astronomy Observatory, which is operated by the Association of Universities for Research in Astronomy, Inc., under cooperative agreement with the National Science Foundation.) as in previous SEEDS publications (e.g. Hashimoto et al., 2011; Muto et al., 2012). Correction for instrumental polarization of the Nasmyth HiCIAO instrument was applied with the Mueller-matrices technique, that quantizes polarization characteristics (Joos et al., 2008). PI was calculated from , where and are orthogonal linear polarizations, and the final polarized intensity profile was obtained after applying 10 10 pixels smoothing to the entire disk.
3. RESULTS
The PI image in -band of the transitional disk around TW Hya is presented in Figure 1. There is no discernible misalignment in the polarization vector beyond 02 (which will be the subject of later studies in this series), and to be conservative, polarization measurements at radii more distant than 02 from the central star are regarded as more accurate.
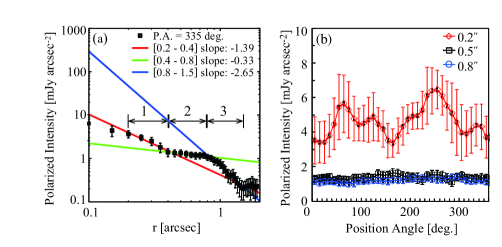
Shown in the PI image is a ring-like polarized intensity depression at 04. The observed polarized intensity profile shown in Figure 2(a), revealing a stair-like decline in polarized intensity, with increasing distance from the central star. We define three major step transitions as: Zone 1 (02 04), Zone 2 (04 08), and Zone 3 (08 15), and the polarized intensity profile is fitted at each zone with a simple power law: . The fitting results in zones 1, 2, and 3 are shown in red, green, and blue, with slopes at each zone of -1.39, -0.33, and -2.65, respectively. The significant change in slope at 04 is interpreted as a transition of some physical property in all azimuthal directions and is the subject of the remainder of this Letter. The change in slope around 08 has already been discussed in Krist et al. (2000) and Apai et al. (2004).
Figure 2(b) displays an azimuthal brightness profile at 02, 05, and 08 in radius. This figure shows the disk is almost axisymmetric, with constant polarized intensity in all azimuthal directions, although rms noise level increases at 02.
4. DISCUSSION
One of interesting results in the observation is that the polarized intensity profile has a stair-like shape. As shown in Figure 2a, in Zone 1, the innermost part of the disk, the profile shows a shallow slope of approximately , where the slope is expected to be in the case of a flared disk, or steeper in the case of a flat geometry (Whitney & Hartmann, 1992; Inoue et al., 2008). In Zone 2, the profile appears almost flat, perhaps indicating that temperature increases with radius. In Zone 3, the polarized intensity profile has a steep value of approximately , which is darker than expected. The observed polarized intensity profile reflects a radial distribution of small dust particles and dust property. In this section, we discuss three possible explanations for the radial polarized intensity distribution observed in the disk of TW Hya. These include (a) an unusual radial distribution on the temperature, (b) the presence of a disk gap induced by the presence of a low-mass planet, and (c) a change in dust scale height due to grain growth.
4.1. The Radial Temperature Gradient
It is important to investigate the extent to which the shallow slopes observed in Zones 1 and 2 could depend on temperature. Generally, Inoue et al. (2008) shows the observed intensity of the scattered light () from a disk with no complex structures, such as gap or cavity, can be expressed by
| (1) |
where is a stellar luminosity, is a distance from a central star, and is a product of albedo and polarization (a phase function including polarization), is a scattering angle, and is grazing angle, and expressed by
| (2) |
where is scattering surface. Assuming is constant in Equation (1) and considering , we obtain
| (3) |
Thus, becomes
| (4) |
According to customary practice and precedents in the past works, we assume that is linearly related to by some constant factor A in the case of smoothly extended disk with no gap (Kenyon & Hartmann, 1987; Chiang & Goldreich, 1997), and the relation can be described by
| (5) |
where is the speed of sound, is Keplerian angular velocity, and is a gas pressure scale height, respectively. Considering radial temperature distribution, , has a form of , where is a power index, , and , we obtain
| (6) |
For Zone 1, with radial polarized intensity dropping as , Equation (4) implies proportional to and . For Zone 2, with radial polarized intensity dropping as , is proportional to and . These indicate the temperature increases with increasing , which is difficult to explain by considering only stellar radiation or flared structure of the disk. One of the reasons for the unexpected result is that the gas scale height is not simply related to temperature. Such a result might be able to be explained when a gap exists because the gap generates a sudden change of surface density. Dynamical phenomena such as disk wind or turbulence could be cited as another possible cause, because the disk surface can be lifted by them, resulting in a flat polarized intensity profile and no longer in hydrostatic equilibrium. If this is the case, wind mechanism such as photoevaopration or magneto-rotational instability that suppress the inner region of the disk due to dead zone might occur.
4.2. Planet-Induced Disk Surface Structure
In this section, we consider the possibility that the changing slope of the observed polarized intensity distribution may signal the presence of a planet within the disk. The slopes at each zone can be explained by a disk surface geometry described by Jang-Condell & Turner (2012, 2013). In their works, the disk illumination and shadowing are self-consistently calculated considering several disk orientations, using a static –disk radiative transfer model when a gap exists in the disk. Figure 2 in Jang-Condell & Turner (2012) shows the surface brightness becomes brighter at the gap wall directly irradiated by a central star, and darker by shadowing and cooling behind the outer gap wall at the edge of gap. If this is the case, Zones 1, 2 and 3 probably correspond to a gap, an outer gap wall, and a shadowed region behind the outer gap wall, respectively. They also made radiative transfer calculations at several wavelengths and theoretically derived a radial surface brightness profile of a disk when a gap is formed by a 70 and 200 earth mass planet. The radial surface brightness profile at a wavelength of 1 shown in Figure 6 in Jang-Condell & Turner (2012) increases just beyond the gap created by a planet, and its slope depends on planet mass, flatter in the case of small mass planet. Therefore, if the origin of the polarized intensity depression attributes to a planet, planet mass seems to be small since our observed polarized intensity profile shows a flat slope at the gap region.
It is beyond the scope of this paper to investigate the detailed effects of planet parameters on the structure of the inner disk of TW Hya, but an extensive search of parameter-space (planet mass and orbital characteristics) in the future might lead to a suitable model for the observed brightness distribution.
4.3. Possibility of Grain Growth
The picture of the disk structure presented in Section 4.1 and 4.2 does not necessarily mean that the gas disk has a gap at 20 AU. Dust grains are also believed to settle to the mid-plane as their size increases. When the disk gas has a Gaussian distribution in the vertical direction with , dust grains also have a Gaussian distribution in the vertical direction, with a dust scale height that is determined by the balance between the diffusion by the gas and the coupling efficiency to the gas (Dubrulle et al., 1995). Using the Stokes number St, which represents the coupling efficiency of grains to gas and is defined as the stopping time normalized by the orbital timescale, and the diffusion coefficient , which represents the diffusion efficiency of the gas in the vertical direction, the dust scale height can be written as
| (7) |
when St 1 (see Brauer et al., 2008, and references therein). As a first rough step to quickly quest to see a possibility whether grain growth occurs or not, we introduce the parameter where the radial grain size distribution has a form of . By using in the form of and applying turbulent viscosity model (Shakura & Sunyaev, 1973) and the Epstein law, then the Stokes number has a simple form of
| (8) |
where is the density of a dust particle and assumed to be a constant throughout the disk. Substituting this into Equation (7), we obtain
| (9) |
Since , we finally obtain the radial dependence of the dust scale height as
| (10) |
Our observation suggests that the dust scale height has a radial dependence of in Zone 1 and in Zone 2, by utilizing Equation (4) and assumption that is linearly related to described by Equation (5). Note that and are not identical, however must be about equal to for the small dust grains, which are mainly traced by -band scattering light in our observation. From Equation (10), we obtain in Zone 1 and in Zone 2 in the disk around TW Hya, assuming that and (Hughes et al., 2008). This suggests that the dust has a larger size in the inner part of the disk, and the size varies by at least a factor of 10 between 10 AU () and 40 AU (), where the depression and its vicinity are covered.
It should be noted that since smaller grains have a larger scattering efficiency, the scattering plane has to represent the dust scale height of the smallest grains at the radial position. The image suggests the possible existence of a small-grain depleted region at , with the depleted range of width more than 10 AU wide. This may suggest that the larger grains are present at inner radii, but there is no sharp transition of the grain size distribution. We note that gas and large grains can be present in the inner region of the disk. Indeed, mm-/submm-observations give no evidence to date of the depletion of gas or dust continuum emission. Furthermore, the dust sedimentation near the disk mid-plane results in flat polarization intensity profile, that is it further promotes a flared structure in distribution.
Estimates of the amount of 10 – 1 mm sized dust in the disk mid-plane, and up to 60 AU, are limited by SMA and VLA data (see Fig. 9, Menu et. al., 2014). Our NIR observations trace dust at the disk surface between 10 – 80 AU, and reflect mainly smaller grains 0.1 – 10 in size. The observations are complementary to each other, revealing radially and vertically distributed dust at different size scales. Note that the absorption efficiency also depends on grain size, and thus influences on the vertical profile via temperature distribution. However, the absorption efficiency does not significantly change with dust grain sizes between 0.1 – 10 in the case of -band wavelength (Miyake & Nakagawa, 1993).
The variation of fundamental dust properties may also affect the observed polarized intensity distribution. For instance, in Equation (1) may not be constant. Takami et al. (2013) explored the scattering properties for different grain size, and calculate polarization degree and polarization intensity normalized by the incident stellar light as a function of scattering angle. They show the polarization degree decreases with increasing grain size when , where is a radius of a dust grain and is wavelength of emission, respectively, resulting in a depolarization of the emission (see also Fischer et al., 1994). On the other hand, when , polarization and polarized intensity decreases less significantly even though becomes larger. Since the dust grain size directly affects the polarized intensity, a variable is consistent with the effect of grain growth.
The minimum grain size depends strongly on the fragmentation efficiency of dust-dust collisions in the disk. If fragmentation of dust is efficient, the scattering surface of the disk should be dominated by the small fragments. However, our observational analysis suggests that fragmentation is not so efficient, particularly in the inner part of the disk. One possible reason for the inefficiency of fragmentation is the icy aggregates have a larger critical velocity before complete disruption, than do rocky aggregates Wada et al. (2009, 2013), although the critical velocity of fragmentation is still under debate. In our study, it is reasonable to assume that the grains are covered by ice, since the locations we have observed are expected to be outside the water snow line.
Another possibility is that fragmentation is effective, but the tiny fragments are swept up by larger grains. Birnstielet al. (2012b) investigated the size distribution as a result of the balance between fragmentation and sweep-up. To sweep up tiny grains, they suggest the diffusion coefficient should be as low as . In our case, the modeling therefore suggests the diffusion is generally inefficient throughout the disk.
In tandem with NIR high-resolution observations, high-resolution and multi-band observations at mm-wavelength will aid an investigation into the grain opacity index . Such data will help us to clarify whether the grain growth is occurring at inner radii and understand the effects of any planet formation on dust character within the gap.
This work is partially supported by KAKENHI 22000005(M.T.), KAKENHI 23103004, 23740151 (M.F.), NSF AST 1008440 (C.A.G.), NSF AST 1009314 (J.P.W.), NASA NNX09AC73G (C.A.G. and M.L.S.). C.A.G. was also supported under NSF AST 1008440 and through the NASA Origins of Solar Systems program on NNG13PB64P. J. K. is supported by Grant-in-Aid for JSPS Fellows (2604023). T.M. is supported by JSPS KAKENHI Grant Numbers 26800106, 23103004, 26400224. J. C. is supported by a grant from the U.S. National Science Foundation under Award No. 1009203. M. T. is supported from Ministry of Science and Technology (MoST) of Taiwan (Grant No. 103-2112-M-001-029).
References
- Andrews et al. (2011) Andrews, S. M., Wilner, D. J., Espaillat, C., Hughes, A. M., Dullemond, C. P., McClure, M. K., Qi, C., Brown, J. M. 2011, ApJ, 732, 42
- Andrews et al. (2012) Andrews, S. M., Wilner, D. J., Hughes, A. M., et al. 2012, ApJ, 744, 162
- Apai et al. (2004) Apai, D., Pascucci, I., Brandner, W., Henning, Th., Lenzen, R., Potter, D. E., Lagrange, A. -M., and Rousset, G. 2004, A&A, 415, 671
- Bergin et al. (2013) Bergin, E. A., Cleeves, L. I., Gorti, U. et al., 2013, Nature, 493, 644
- Birnstielet al. (2012b) Birnstiel, T., Andrews, S. M., & Ercolano, B. 2012, A&A, 544, A79
- Brauer et al. (2008) Brauer, F., Dullemond, C. P., & Henning, Th. 2008, A&A, 480, 859
- Calvet et al. (2002) Calvet, N., D’Alessio, P., Hartmann, L., Wilner, D., Walsh, A., & Sitko, M. 2002, ApJ, 568, 1008
- Chiang & Goldreich (1997) Chiang, E. I., & Goldreich, P., 1997, ApJ, 490, 368
- Clarke et al. (2001) Clarke, C. J., Gendrin, A., & Sotomayor, M. 2001, MNRAS, 328, 485
- Currie et al. (2014) Currie, T., Muto, T., Kudo, T. et al. 2014, ApJ, 796, L30
- Debes et al. (2013) Debes, J. H., Jang-Condell, H., Weinberger, A. J., Roberge, A., & Schneider, G. 2013, ApJ, 771, 45
- Dubrulle et al. (1995) Dubrulle, B., Morfill, G., & Sterzik, M., 1995, Icarus, 114, 237
- Ducourant et al. (2014) Ducourant, C., Teixeira, R., Galli, P. A. B., Le Campion, J. F., Krone-Martins, A., Zuckerman, B., Chauvin, G., & Song, I. 2014, A&A, 563, A121
- Fischer et al. (1994) Fischer, O., Henning, Th., & Yorke, H. W. et al. 1994, A&A, 284, 187
- Fukawaga et al. (2013) Fukagawa, M., Tsukagoshi, T., & Momose, M. et al. 2013, PASJ, 65, L14
- Grady et al. (2013) Grady, C. A., Muto, T., Hashimoto, J. et al. 2013, ApJ, 762, 48
- Hashimoto et al. (2011) Hashimoto, J., Tamura, M., Muto, T. et al. 2011, ApJ, 729, L17
- Hashimoto et al. (2012) Hashimoto, J., Dong, R., Kudo, T. et al. 2012, ApJ, 758, L19
- Hayano et al. (2008) Hayano, Y., Takami, H, Guyon, O. et al., 2008, Proc. SPIE, 7015E, 701510
- Hinkley et al. (2009) Hinkley, S., Oppenheimer, B. R., Soummer, R. et al., 2009, ApJ, 701, 804
- Hughes et al. (2007) Hughes, A. M., Wilner, D. J., Calvet, N., D’Alessio, P., Claussen, M. J., & Hogerheijde, M. R., 2007, ApJ, 664, 536
- Hughes et al. (2008) Hughes, A. M., Wilner, D. J., Qi, C., & Hogerheijde, M. R., 2008, ApJ, 678, 1119
- Inoue et al. (2008) Inoue, A., Honda, M., Nakamoto, T., & Oka, A., 2008, PASJ, 60, 557
- Isella et al. (2013) Isella, A., Prez, L. M., & Carpenter, J. M., Ricci, L., Andrews, S., & Rosenfeld, K. 2013, ApJ, 775, 30
- Jang-Condell & Turner (2012) Jang-Condell, H. & Turner, N. J., 2012, ApJ, 749, 153
- Jang-Condell & Turner (2013) Jang-Condell, H. & Turner, N. J., 2013, ApJ, 772, 34
- Joos et al. (2008) Joos, F., Buenzli, E, Schmid, H. M. et al., 2008, Proc. SPIE, 7016, 48
- Kenyon & Hartmann (1987) Kenyon, S. J., Buenzli, E, Hartmann, L., 1987, ApJ, 1987, 323, 714
- Krist et al. (2000) Krist, J. E., Stapelfeldt, K. R., Ménard, F., Padgett, D. L., & Burrows, C. J. 2000, ApJ, 538, 793
- Mayama et al. (2012) Mayama, S., Hashimoto, J., Muto, T. et al. 2012, ApJ, 760, L26
- Menu et. al. (2014) Menu, J., van Boekel, R., Henning, Th. et al., 2014, A&A, 564, A93
- Miyake & Nakagawa (1993) Miyake, K. & Nakagawa, Y. 1993, Icarus, 106, 20
- Muto et. al. (2010) Muto, T., Suzuki, T. K., & Inutsuka, S. 2010, ApJ, 724, 448
- Muto et al. (2012) Muto, T., Grady, C. A., Hashimoto, J. et al. 2012, ApJ, 748, L22
- Owen et al. (2011a) Owen, J. E., Ercolano, B., & Clarke, C. J. 2011a, MNRAS, 411, 1104
- Owenet al. (2011b) Owen, J. E., Ercolano, B., & Clarke, C. J. 2011b, MNRAS, 412, 13
- Qi et al. (2004) Qi, C., Ho, P. T. P., Wilner, D. J., Takakuwa, S., Hirano, N., Ohashi, N., Bourke, T. L., Zhang, Q., Blake, G. A., Hogerheijde, M., Saito, M., Choi, M., & Yang, J. 2004, ApJ, 616, L11
- Qi et al. (2006) Qi, C., Wilner, D. J., Calvet, N., Bourke, T. L.,Blake, G. A., Hogerheidje, M. R., Ho, P. T. P., & Bergin, E. 2006, ApJ, 636, L157
- Roberge et al. (2005) Roberge, A., Weinberger, A. J., & Malumuth, E. M. 2005, ApJ, 622, 1171
- Shakura & Sunyaev (1973) Shakura, N. I. & Sunyaev, R. A. 1973, A&A, 412, 13
- Strom et al. (1989) Strom, K. M., Strom, S. E., Edwards S., Cabrit, S. & Skrutskie, M. F. 1989, AJ, 97, 1451
- Takami et al. (2013) Takami, M., Karr, J. L., Hashimoto J. et al. 2013, ApJ, 772, 145
- Tamura et al. (2006) Tamura, M., Hodapp, K, Takami, H., et al. 2006, Proc. SPIE, 6269, 62690V
- Tamura (2009) Tamura, M. 2009, in AIP Conf. Ser. 1158, Exoplanets and Disks: Their Formation and Diversity, ed. T. Usuda, M. Tamura, & M. Ishii (Melville, NY: AIP), 11
- van Leeuwen (2007) van Leeuwen, F. 2007, Hipparcos, the New Reduction of the Raw Data, Astrophysics and Space Science Library, Vol. 350 (Berlin: Springer)
- Wada et al. (2013) Wada, K., Tanaka, H., Okuzumi, S., et al. 2013, A&A, 559, A62
- Wada et al. (2009) Wada, K., Tanaka, H., Suyama, T., Kimura, H., & Yamamoto, T. 2009, ApJ, 702, 1490
- Weinberger et al. (2002) Weinberger, A. J., Becklin, E. E., Schneider, G., et al. 2002, ApJ, 566, 409
- Whitney & Hartmann (1992) Whitney, B. & Hartmann, L.1992, ApJ, 395, 529
- Zhu et al. (2011) Zhu, Z., Nelson, R. P., Hartmann, L., Espaillat, C., & Calvet, N. 2011, ApJ, 729, 47