Modeling the H i 21-cm line profile from circumstellar shells around red giants
Abstract
We present H i line profiles for various models of circumstellar shells around red giants. In the calculations we take into account the effect of the background at 21 cm, and show that in some circumstances it may have an important effect on the shape and intensity of the observed line profiles. We show that self-absorption should also be considered depending on the mass loss rate and the temperature reached by circumstellar gas.
H i emission from circumstellar shells has been mostly reported from stars with mass loss rates around 10-7 M⊙ yr-1. We discuss the possible reasons for the non detection of many sources with larger mass loss rates that are hallmarks of the end of the AGB phase. Although radiative transfer effects may weaken the line emission, they cannot alone account for this effect. Therefore, it seems likely that molecular hydrogen, rather than atomic hydrogen, dominates the composition of matter expelled by stars at the end of their evolution on the Asymptotic Giant Branch. However sensitive H i observations can still yield important information on the kinematics and physical properties of the circumstellar material at large distances from central stars with heavy mass loss, despite the low abundance of atomic hydrogen.
keywords:
stars: AGB and post-AGB – circumstellar matter – stars: individual: Y CVn – stars: mass loss – radio lines: stars.1 Introduction
Asymptotic giant branch (AGB) stars are undergoing mass loss via slow stellar winds (Olofsson 1999). They get surrounded by expanding circumstellar shells that are well characterized by CO emission lines in the millimeter range (Knapp & Morris 1983, Loup et al. 1993). From the modeling of the CO line profiles, expansion velocities are derived to be in the range from a few to 40 km s-1, and mass loss rates, from 10-7 to a few 10-4 M⊙ yr-1.
Most of the matter in circumstellar shells should be in hydrogen (70 % in mass). Early searches for 21-cm line emission from atomic hydrogen were mostly unsuccessful (Zuckerman et al. 1980, Knapp & Bowers 1983) leading to the conclusion that hydrogen in stellar envelopes is molecular rather than atomic. However, more recently, the H i line at 21 cm has been detected from several AGB stars (Gérard & Le Bertre 2006). A number of the detected stars have also been imaged in H i with the Very Large Array (VLA, Matthews & Reid 2007, Matthews et al. 2008, 2011, 2013). In general, the detected sources have mass loss rates M⊙ yr-1, and they show a narrow H i line profile (3-5 km s-1). On the other hand, many sources with large mass loss rate ( M⊙ yr-1) remain undetected.
Again, a possible explanation could be that hydrogen in sources with large mass loss rates is mostly in molecular form. However, this is not entirely satisfactory for at least two reasons. First, molecular hydrogen is expected to be photo-dissociated by UV photons from the interstellar radiation field (ISRF) in the external parts of circumstellar shells (Morris & Jura 1983). Second, the mass loss rate from AGB stars is supposed to be highly variable (e.g. Vassiliadis & Wood 1993), so that a given star should be surrounded by interacting shells, originating from different episodes of mass loss at different rates, from 10-8 M⊙ yr-1 upwards, and different velocities (Villaver et al. 2002), with probably a mix of atomic and molecular hydrogen.
Another possibility is that radiative transfer effects are weakening the 21-cm line emission, thus rendering difficult the detection of H i. The narrowness of the line profiles could increase the optical depth at particular frequencies, thus exacerbating self-absorption. The presence of an intense background at 21 cm may also play a role (Levinson & Brown 1980). In this paper, we examine the formation of the H i line in circumstellar shells around AGB stars, taking into account these effects.
2 Context
Hydrodynamical models of dust-forming long-period variable stars reproduce outflows with mass loss rate ranging from to M⊙ yr-1, and expansion velocity ranging from a few to 40 km s-1 (Winters et al. 2000). Close to the central star, the density is much larger than in the interstellar medium (ISM), and the wind expands freely (freely expanding wind). We hereafter refer to the case where the wind expands freely as scenario 1. However, at some point, the stellar wind is slowed down by the ambiant medium, and a structure develops in which both circumstellar and interstellar matter accumulates. Such structures were discovered with IRAS owing to the presence of spatially resolved 60m continuum emission (Young et al. 1993) and are referred to as ‘detached shells’111This designation has also been used for shells resulting from an outburst of mass loss and observed in CO molecular lines (Olofsson et al. 2000). In this paper, we adopt to the definition of Young et al..
Subsequently, the H i line at 21 cm was detected in the direction of several resolved IRAS sources (Le Bertre & Gérard 2004; Gérard & Le Bertre 2006). The H i emission is more extended than the CO emission and generally corresponds with the far-infrared size. Also the main components of the H i line are narrower than the CO line profiles, thus demonstrating that stellar outflows are slowed down by an external medium, and that the H i line profiles can be used to probe the kinematics in the external regions of circumstellar shells. Imaging obtained with the VLA has revealed detached H i shells with narrow line profiles, sometimes associated with extended tails (Matthews et al. 2013).
Libert et al. (2007) developed a model of a detached shell (hereafter scenario 2) adapted to the H i emission from the prototypical case of Y CVn. In this model, a double-shock structure develops, with a termination shock, facing the central star, where the supersonic stellar wind is abruptly slowed down, and a leading shock (i.e. outward facing shock) where interstellar matter is compressed and integrated in the detached shell. These two limits define the detached shell which is thus composed of circumstellar and interstellar matter separated by a contact discontinuity. The circumstellar matter is decelerated, by a factor , when it crosses the termination shock, and heated. It then cools down, while the expansion velocity further decreases and the density increases until the contact discontinuity. The model assumes spherical symmetry and stationarity. Adopting an arbitrary temperature profile, the equation of motion is solved numerically between the two limits of the detached shell. The H i line profile is then calculated assuming that the emission is optically thin.
Libert et al. (2007) could reproduce the H i line profile observed in Y CVn and generalize the model to other cases of sources with mass loss rates of about 10-7 M⊙ yr-1 (e.g. Libert et al. 2010). However, as discussed in Matthews et al. (2013), although this model is effective in reproducing spatially integrated line profiles, it faces some difficulties in reproducing the spatial distribution of the H i emission. Namely, at small radii, it seems to predict too much flux in both the shell component and the freely expanding wind component of the spectral profile. The mass loss variations with time and the interaction between consecutive shells may need to be taken into account (see Villaver et al. 2002). The more elaborate numerical modeling performed by Villaver et al. follows the mass loss and velocity variations of the stellar winds of thermally pulsing AGB stars, and describes self-consistently the formation and development of circumstellar shells embedded in the ISM (hereafter scenario 3). They show that large regions (up to 2.5 pc) of neutral gas may be formed around AGB stars.
In this work, we will simulate the H i line profiles that would be expected for these three kinds of scenarios and examine how they compare with observations presently available.
3 General comments on the formation of the H i line profile
The H i line at 21 cm is produced by a transition between two levels of the ground state of hydrogen. The rest frequency, , corresponds to 1420.4 MHz, and the transition probability, , to 2.87 10-15 s-1. As the transition probability between the two levels is very low, the natural width of the line is extremely small, and the frequency dependence of the absorption and emission coefficients are entirely defined by the atomic hydrogen velocity. This is determined by the bulk motion of the gas (including, if present, turbulence), and the hydrogen kinetic temperature (). We assume local thermal equilibrium (LTE). Also, in general, as the frequencies are small, one may replace , by ( 0.07 K).
The intensity emitted, at a frequency , along an element , , is given by :
| (1) |
where is the number density of hydrogen atoms in the upper level with a velocity along the line of sight corresponding to .
Similarly the absorption part is given by :
| (2) |
with the absorption coefficient, , given by :
| (3) |
(cf. equation 3.14 in Lequeux 2005). and are the statistical weights of the upper and lower levels, respectively, and is the number density of hydrogen atoms in the lower level with a velocity along the line of sight corresponding to . It is interesting to note that, in general, the absorption coefficient varies as .
For the H i line at 21 cm: , , and for a population in statistical equilibrium, , and , where is the total number density of hydrogen atoms in the ground state (), and assuming for the Boltzmann factor.
In practice, spectra are represented as a function of the velocity, . We may thus replace by and by . With this convention, the absorption coefficient can be rewritten as:
| (4) |
Finally the radiative transfer equation is written as :
| (5) |
At radio frequencies, it is usual to express the intensity in terms of the equivalent temperature of a blackbody that would give the same intensity in the same spectral domain. With this convention, the boundary condition can be defined through a background brightness temperature, :
| (6) |
refering to the incoming intensity on the rear side of the shell. The background is the sum of the 3-K cosmic emission, the synchrotron emission from the Galaxy and the H i emission from the ISM located beyond the circumstellar shell with respect to the observer. The first component is a continuum emission, which is smooth, angularly and spectrally. The second component is also smooth spectrally, but it presents a strong dependence with galactic latitude, and shows also some sub-structures. The sum of these two components has been mapped with a spatial resolution of 0.6∘ by Reich (1982), Reich & Reich (1986) and Reich et al. (2001). The third component (H i emission from the ISM) shows both strong spatial and spectral dependences, which make it a serious source of confusion. It has been mapped with a spatial resolution of 0.6∘ and a spectral resolution of 1.3 km s-1 by Kalberla et al. (2005; Leiden-Argentina-Bonn, LAB, survey). Surveys of selected regions of the sky, in particular along the Galactic Plane, have been obtained at a resolution down to 1′, and show spatial structures, like filaments or clouds, at all sizes (e.g. Stil et al. 2006).
Away from the Galactic Plane, typical values range from 3-5 K, outside the range of interstellar H i emission, to 10-20 K inside an interstellar H i emission. Close to the Galactic Plane, the continuum may reach 10-20 K, and, including the interstellar H i emission, the background may reach 100 K. Note that the background temperature, , is not directly related to the kinetic temperature of the surrounding ISM.
In addition, in some cases, a radio-source may be seen in the direction of a circumstellar shell. In such a case, we have an unresolved continuum emission (see e.g. Matthews et al. 2008). Such a source may be useful to probe the physical conditions within the circumstellar shell in a pencil-beam mode.
4 Simulations
For the present work, we adapted the code developed by Hoai et al. (2014). It is a ray-tracing code that takes into account absorption and emission in the line profile. It can handle any kind of geometry, but for the purpose of this paper we restricted our simulations to circumstellar shells with a spherical geometry as described in Sect. 2. We assume that, in each cell, the gas is in equilibrium and that the distribution of the velocities is maxwellian.
In this section, we explore the line profiles for a source that is not resolved spatially by the telescope, and assume a uniform response in the telescope beam (boxcar response, cf. Gardan et al. 2006). We also assume that the line profiles can be extracted from position-switched observations, i.e. that there is no spatial variation of the background. The flux densities are expressed in the units of Janskys (Jy), where 1 Jy = 10-26 W m-2 Hz-1.
We performed various tests in order to evaluate the accuracy of the simulations. It depends mainly on the mass loss rate of the central source and on the size of the geometrical steps adopted in the calculations. For the results presented in this section, the relative error on the line profile ranges from 10-6, for mass loss rates of 10-7 M⊙ yr-1, to a few 10-3, for mass loss rates of 10-4 M⊙ yr-1.
4.1 Freely expanding wind (scenario 1)

We consider a spherical wind in free expansion at Vexp=10 km s-1. The distance is set at 200 pc, and the mass loss rate is varied from 10-7 to 10-4 M⊙ yr-1. We assume that the gas is composed, in number, of 90% atomic hydrogen, and 10% 4He. We assume a temperature dependence proportional to r-0.7, r being the distance to the central star, out to the external boundary (0.17 pc) where the temperature drops to 5 K. This temperature of 5 K is probably underestimated as the photoelectric heating by grains absorbing UV photons is expected to raise the temperature of the gas in the cool external layers of shells around stars with high mass loss rate (Schöier & Olofsson 2001). On the other hand, temperatures as low as 2.8 K have been reported in some high mass loss rate sources (e.g. U Cam, Sahai 1990). Such low temperatures are only expected in the freely expanding regions of the circumstellar shells. The density and temperature profiles are illustrated in Fig. 1 for the 10-5 M⊙ yr-1 case.

In a first set of simulations (Fig. 2) we calculate the integrated emission (within a diameter, ) with no background, in order to estimate the effect of self-absorption (in fact the background should have a minimum brightness temperature of 3 K, cf. Sect. 3). Self-absorption starts to play a clear role for 10-6 M⊙ yr-1, with an intensity that is reduced, and a profile that changes its shape from almost rectangular to parabolic. A slight asymmetry of the line profile is also present (although not discernible by eye in the figure), with more absorption on the blue side, due to the outwardly decreasing temperature, an effect which has already been described in the case of molecular emission from expanding circumstellar envelopes (Morris et al. 1985).

In a second set of simulations, the mass loss rate is kept at 10-5 M⊙ yr-1, and the background is varied from 0 K (as above), to 10 K (Fig. 3). The effects noted previously are amplified by the background, in particular with an absorption developing on the blue side of the profile, and then extending to the complete spectral domain when the background temperature reaches 10 K.
We adopted a temperature dependence proportional to r-0.7 which fits the results obtained with a radiative transfer model by Schöier & Olofsson (2001). A shallower dependence would increase the temperature in the outer layers of the circumstellar shell and thus reduce the effects of self-absorption, as well as the absorption of the background radiation. An external source of heating (e.g. by photoelectric heating) would have the same influence.
4.2 Single detached shell (scenario 2)
We adopt the model developed by Libert et al. (2007). It has been shown to provide good spectral fits of the H i observations obtained on sources with mass loss rates 10-7 M⊙ yr-1 (cf. Sect. 2).
As in Sect. 4.1, we assume a spatially unresolved source at 200 pc with a mass loss rate of 10-7 M⊙ yr-1. The internal radius of the detached shell is set at 2.5′ (or 0.15 pc). Similarly, we examine the dependence of the line profile for models with various masses in the detached shell (MDT,CS) and various background levels (Figs. 4 and 5). The parameters of the four cases illustrated in Fig. 4 are given in Table 1. The free-wind expansion velocity is taken to be Vexp= 8 km s-1. At the termination shock the downstream temperature is given by T (3 )/(16 k) Vexp 1800 K (equ. 6.58 in Dyson & Williams 1997) with , the mass of the hydrogen atom, and , the mean molecular weight. For the temperature profile inside the detached shell we use the expression (9) in Libert et al. (2007) with a temperature index, . The temperature is thus decreasing from 1800 K, to Tf, at the interface with ISM, rf. The density, velocity and temperature profiles are illustrated in Fig. 6 for case D.
Self-absorption within the detached shell has a limited effect, with a reduction ranging from 1% (model A) to 20% (model D), as compared to the optically thin approximation (Fig. 4). However, taking into account the background introduces a much larger effect (Fig. 5).
The results depend on the adopted parameters in the model (mainly internal radius, expansion velocity and age). Smaller internal radius and expansion velocity, and/or longer age would lower the average temperature in the detached shell. This would increase the effect of self-absorption, as well as that of the background absorption. The line profiles simulated with the A and B-cases represented in Fig. 4 provide a good approximation to several observed H i line profiles (Libert et al. 2007, 2010, Matthews et al. 2013).


| case | age (yr) | rf(arcmin) | Tf (K) | MDT,CS (M⊙) |
|---|---|---|---|---|
| A | 5105 | 3.85 | 135 | 0.05 |
| B | 106 | 4.14 | 87 | 0.1 |
| C | 2106 | 4.47 | 55 | 0.2 |
| D | 4106 | 4.83 | 35 | 0.4 |
As an illustration, we reproduce on Fig. 7 the spatially integrated profile of Y CVn observed by Libert et al. (2007) together with a recent fit obtained by Hoai (2015). For this fit, a distance of 321 pc (van Leeuwen 2007), a mass loss rate of 1.310-7 M⊙ yr-1, and a duration of 7105 years have been adopted. These parameters differ from those adopted by Matthews et al. (2013), who assumed 1.710-7 M⊙ yr-1 and a distance of 272 pc (Knapp et al. 2003). However, by adopting a lower mass loss rate, and conversely, a longer duration, Hoai (2015) can fit the spatially resolved spectra obtained by the VLA and solve the problem faced by Matthews et al. at small radii. A difference between the mass loss rate estimated from CO observations and that adopted in the model may have several reasons, for instance an inadequate CO/H abundance ratio.

4.3 Villaver et al. model (scenario 3)
Villaver et al. (2002) have modeled the dynamical evolution of circumstellar shells around AGB stars. The temporal variations of the stellar winds are taken from the stellar evolutionary models of Vassiliadis & Wood (1993).
For our H i simulations, we used the 1.5-M⊙ circumstellar shell models of Villaver et al. (2002) at various times of the thermally pulsing AGB (TP-AGB) evolution. We selected the epochs at 5.0, 6.5, and 8.0105 years, which correspond to the first two thermal pulses, and then to the end of the fifth (and last) thermal pulse. The density, velocity and temperature profiles are illustrated in Fig. 8. For these models, which can reach a large size (with radii of 0.75, 1.66 and 2.5 pc, respectively), we adopt a distance of 1 kpc (implying a diameter of up to 17′).


The results are shown in Fig. 9. In this scenario, the temperature in the circumstellar environment is maintained at high values due to the interactions between the successive shells (Fig. 8). The shape of the line profile is thus dominated by thermal broadening, and does not depend much on the epoch which is considered (although the intensity of the emission depends strongly on time, together with the quantity of matter expelled by the star).
For the same reason, these results do not depend much on the background (5% for =100 K). Indeed in the models the temperature of the gas in the circumstellar shell always stays at a high level ( K, except close to the central star in the freely expanding region).
The predictions obtained with this scenario, in which wind-wind interactions are taken into account, differ clearly from those obtained with the previous scenario, in which the detached shell is assumed to result from a long-duration stationary process, by a much larger width of the line profiles (full-width at half-maximum, FWHM 16 km s-1). This large width in the simulations for scenario n∘3 results mainly from the thermal broadening, and also, but to a lesser extent, from the kinematic broadening (cf. Fig. 8).
5 Discussion
5.1 Optically thin approximation
If absorption can be neglected, the intensity becomes proportional
to the column density of hydrogen. For a source at a distance ,
the mass in atomic hydrogen () can be derived from the integrated
flux density through the standard relation (e.g. Knapp & Bowers 1983):
,
in which is expressed in pc, in km s-1, in Jy,
and in solar masses (M⊙).
Our calculations allow us to estimate the error in the derived H i mass of circumstellar envelopes that is incurred from the assumption that the emission is optically thin and not affected by the background. As an example, in Fig. 10, we show the ratio between the estimated mass (using the standard relation) and the exact mass in atomic hydrogen. The case without background illustrates the effect of self-absorption within the circumstellar shell for different mass loss rates. We adopt a freely expanding wind with a temperature profile in r-0.7 (as in Sect. 4.1), with r expressed in arcmin., or a constant temperature (5 K, 10 K, 20 K). The ratio clearly decreases with decreasing temperature in the circumstellar shell, increasing mass loss rate and increasing background temperature.
In the constant temperature case with T = 5 K and = 5 K, the line profiles should be flat (cf. radiative transfer equation in Sect. 3), and thus the “estimated” masses, exactly null. Our numerical calculations agree with this prediction to better than 3, for mass loss rates up to 10-4 M⊙ yr-1.

The standard relation used for estimating the mass in atomic hydrogen should obviously be handled with caution in the case of the freely expanding wind scenario (n∘ 1). On the other hand, our calculations show that the deviation is much smaller for the two other scenarios (and basically negligible for scenario n∘ 3). This is mainly an effect of the high temperature in the detached shells resulting from the wind-wind interactions.
5.2 Spectral variations of the background
The H i absorption produced by cold galactic gas in the foreground of bright background emission may be shifted towards the velocity with highest background (cf. Levinson & Brown 1980). To illustrate this effect in the case of circumstellar shells, in Fig. 11, we show the results of our simulations for a 10-5 M⊙ yr-1 freely expanding wind, as in Sect. 4.1, and a background temperature varying linearly between 10 K at 10 km s-1, and 5 K at +10 km s-1. The absorption is clearly shifted towards velocities with highest background. One notes also that the emission is shifted towards velocities with lowest background.

In case of a intense and spectrally structured background, some care should be exercised when comparing the H i line centroids with the velocities determined from other lines.
5.3 Comparison with observations
Freely expanding winds have been definitively detected in the H i line in only two red giants: Y CVn (Le Bertre & Gérard 2004) and Betelgeuse (Bowers & Knapp 1987). The corresponding emission is relatively weak and difficult to detect. Data obtained at high spatial resolution reveal a double-horn profile (e.g. Bowers & Knapp 1987). It is worth noting that a high velocity expanding wind (Vexp 35 km s-1) has also been detected around the classical Cepheid Cep (Matthews et al. 2012). A pedestal is suspected in a few H i line profiles that could be due the freely expanding region (Gérard & Le Bertre 2006, Matthews et al. 2013). The first scenario might also be interesting for interpreting sources in their early phase of mass loss, or for sources, at large distance from the Galactic Plane, embedded in a low pressure ISM.
In general, sources which, up to now, have been detected in H i show quasi-gaussian line profiles of FWHM 2-5 km s-1 (Gérard & Le Bertre 2006, Matthews et al. 2013), a property which reveals the presence of slowed-down detached shells. These profiles are well reproduced by simulations based on the scenario n∘2 presented in Sect. 4.2, assuming mass loss rates of a few 10-7 M⊙ yr-1, and durations of a few 105 years. In particular, for Y CVn and Betelgeuse, the main H i component has a narrow line profile ( 3 km s-1) and is well reproduced by this kind of simulation (Libert et al. 2007, Le Bertre et al. 2012).
Sources with large mass loss rates ( M⊙ yr-1) have rarely been detected (with the notable exceptions of IRC +10216 and AFGL 3068, see below). The simulations presented in Sect. 4.3 show the line profiles that sources, such as those predicted by Villaver et al. (2002), should exhibit at the end of the thermal-pulse phase, with large mass loss rates, and with interaction with the local ISM. In these models, in which the evolution of the central star is integrated, the circumstellar envelopes result from several interacting shells, as well as from the ISM matter which has been swept-up. Shocks between successive shells maintain a high gas temperature ( 4000 K).
For these models the calculated line profiles are not seriously affected by the background level, and the flux densities are large enough for allowing a detection up to a few kpc. For instance, in the GALFA-H i survey (Peek et al. 2011), the 3- detection limit for a point source in a 1 km s-1 channel is 30 mJy. Saul et al. (2012) have detected many compact isolated sources in this survey. However, at the present stage, none could be associated with an evolved star (Begum et al. 2010).
Furthermore, several sources with high mass loss rates, such as IRC +10011 (WX Psc), IK Tau (NML Tau) or AFGL 3099 (IZ Peg) which are observed at high galactic latitude, with an expected low interstellar H i background, remain undetected (Gérard & Le Bertre 2006, Matthews et al. 2013). The simulations that we have performed based on the three different scenarios considered in this work cannot account for such a result. It seems therefore that, in sources with large mass loss rates ( M⊙ yr-1), hydrogen is generally not in atomic, but rather in molecular form.
Glassgold & Huggins (1983) have discussed the H/H2 ratio in the atmospheres of red giants. They find that for stars with photospheric temperature T⋆ 2500 K, most of the hydrogen should be in atomic form, and the reverse for T⋆ 2500 K. Winters et al. (2000) find that there is an anti-correlation between T⋆ and the mass loss experienced by long period variables. It seems likely that stars having a mass loss rate larger than a few 10-7 M⊙ yr-1 have also generally a low photospheric temperature, with T⋆ 2500 K, and thus a wind in which hydrogen is mostly molecular.
Recently, Matthews et al. (2015) have reported the detection of atomic hydrogen in the circumstellar environment of IRC +10216, a prototype of a mass losing AGB star at the end of its evolution with Ṁ 210-5 M⊙ yr-1. The observed morphology, with a complete ring of emission, is in agreement with the predictions of Villaver et al. (2002, 2012). They find that atomic hydrogen represents only a small fraction of the expected mass of the circumstellar environment ( 1 %), supporting a composition dominated by molecular hydrogen. Unfortunately, a reliable line profile could not be extracted due to the low level of the emission and to a patchy background. The detection of H i over a spectral range 10 km s-1 suggests a line width larger than commonly observed in evolved stars, which would make it compatible with scenario n∘3. Gérard & Le Bertre (2006) have reported the possible detection of AFGL 3068, another carbon star with high mass loss rate ( 10-4 M⊙ yr-1). In this case, also, the line width ( 30 km s-1) is larger than expected for scenario n∘2, and might be better explained by scenario n∘3. Another possibility for this source which is at a large distance from the Galactic Plane (z 740 pc) would be that we are mostly detecting a freely expanding wind not slowed down by its local ISM (i.e. scenario n∘1).
If the atomic hydrogen is of atmospheric origin (a fraction of 1 % is expected for a star with an effective temperature of 2200 K, Glassgold & Huggins 1983), its abundance should correspondingly be scaled down in our radiative transfer simulations. The effect of the optical depth on the line profiles could be considerably reduced for such a case. For stars with lower effective temperature (T⋆ 2200 K), atomic hydrogen might also be present in the external regions of circumstellar envelopes as a result of the photodissociation of molecular hydrogen by UV photons from the interstellar radiation field (Morris & Jura 1983).
5.4 Case of a resolved source
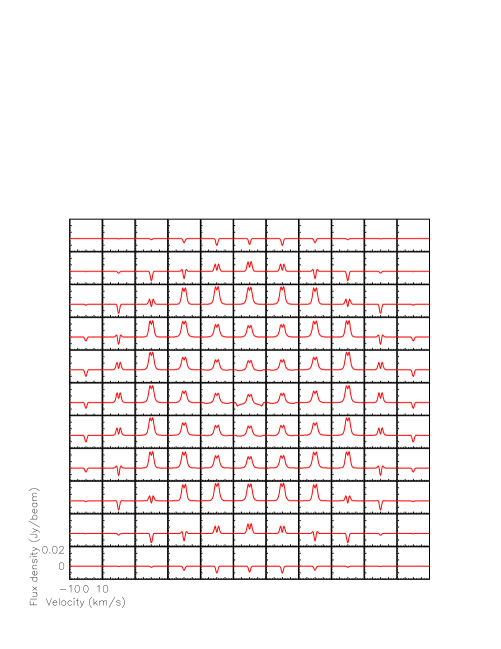
We have concentrated our study on the prediction of spatially integrated spectra. However, circumstellar envelopes may reach a large size ( 2-3 pc, Villaver et al. 2002), and thus have a large extent over the sky. Also, interferometers provide a larger spatial resolution than single-dish antennas. It is thus interesting to examine how the line profile may vary as a function of position. As an example, in Fig. 12, we show a spectral map that would be obtained for a detached shell observed over a background with = 50 K (scenario 2). The line appears mostly in emission and, as expected, delineates the detached shell. However, in the case of a high background level, the line appears also in absorption, in particular in the external part of the detached shell where the lines of sight cross regions with gas at low temperature.
Spatially resolved H i studies, with a careful subtraction of the background emission, may thus reveal spectral signatures that hold information on their physical conditions. Such signatures could help to constrain the physical properties of the gas in a region where molecules are absent or not detectable.
6 Prospects
We have simulated H i 21-cm line profiles for mass losing AGB stars expected for different scenarios assuming spherical symmetry.
However, AGB sources are moving through the ISM and their shells may be partially stripped by ram pressure (Villaver et al. 2003, 2012). As a consequence of the interaction a bow-shock shape appears in the direction of the movement, but also a cometary tail is formed which is fed directly from the stellar wind and from material stripped away from the bow shock. The cooling function and the temperature assumed for the wind have an important effect on the formation of the tail as shown in Villaver et al. (2012). Higher density regions formed behind the star will cool more efficiently and will collapse against the ISM pressure, allowing the formation of narrow tails.
Gérard & Le Bertre (2006) have reported shifts of the H i emission in velocity as well as in position for several sources. Matthews et al. (2008) have reported a shift in velocity for different positions along the tail of Mira (see also X Her, Matthews et al. 2011). These effects can also affect the H i line profiles, and thus the detectability. In addition, material lost by the AGB star should be spread along a tail that may reach a length of 4 pc, as in the exceptional case of Mira. On the other hand, Villaver et al. (2012) show that for sources with large mass loss rates at the end of their evolution, dense shells could still be found close to the present star position.
We have assumed a background with a constant brightness. Of course, as explained in Sect. 3, this applies only to the cosmic background, and to a lesser extent to the galactic continuum emission. It does not apply to the galactic H i emission which may show spatial structures of various kinds. The resulting effect may be more complex than that simulated in Sect. 4. For instance, an absorption line could form preferentially at the position of a peak of galactic H i emission (a radiative transfer effect). Such a phenomenon may affect the predictions presented in Sect. 5.4. Therefore a good description of the background will also be needed to model the observed line profiles. Such input may be obtained through frequency-switched observations for the galactic H i component, and through the surveys of the continuum at 21 cm which are already available (see Sect. 3).
It has to be noted that, in the position-switched mode of observation, the intrinsic line profile of the stellar source can also be spoiled by the patchiness of the galactic background emission (observational artifact). The main source of confusion is the galactic H i emission which is structured spatially and spectrally. The classical position-switched mode of observation is not always efficient to correct the 21-cm spectra from the emission that is not directly associated with the star. More sophisticated methods with 2D mapping might be needed for subtracting the contaminating emission in these cases. Interferometric observations have the advantage of filtering the large-scale galactic emission. However, one should care that an intrinsic circumstellar emission is not also subtracted in this mode of observation. Also some artifacts may arise from incomplete spatial sampling of the large scale emission, as illustrated by the case of TX Psc (Matthews et al. 2013). If feasible, an excellent u-v coverage combined with maps from a single dish telescope providing small spacings has to be obtained. Also, for circumstellar shells angularly larger than the primary beam of the interferometer, mosaicked observations combined with single dish maps are needed.
Another caveat is that, when the distance to the source becomes larger, the foreground ISM material may play the role of an absorbing layer of growing importance (Zuckerman et al. 1980). The circumstellar shell line profile may thus be distorted by absorption due to the foreground cold material that shares the same radial velocity range.
Sources with high mass loss rate ( 10-6–10-5 M⊙ yr-1) tend to be concentrated towards the galactic plane. They are expected to dominate the contribution of AGB stars to the replenishment of the ISM (Le Bertre et al. 2003). The recent detection of IRC +10216 by Matthews et al. (2015) shows that atomic hydrogen should be present in these sources and that the H i line at 21 cm can be used to probe the morphology and the kinematics of stellar matter decelerated at large distance from the central star. However, as discussed above, when the background is large, a proper modelling of the line profiles will be necessary.
7 Summary and Conclusions
We have simulated H i 21-cm line profiles expected for several different scenarios representing different evolutionary stages of evolved stars, and thus corresponding to different AGB circumstellar structures. We have relaxed the optically thin hypothesis which was assumed in previous works, and included the emission from the background.
Self-absorption may be important in freely expanding circumstellar shells, as well as in some detached shells resulting from the interaction of the stellar winds with the local ISM. The H i line profile may also be affected by the background level and by the spectral profile of this background emission.
The numerical simulations that we have performed show that, under certain conditions, the observed H i 21-cm flux densities from mass-losing stars can be significantly reduced by taking into account optical depth effects and the presence of the background emission, but not to such a level such as to account for the non-detection of several sources. Therefore, one should consider that molecular hydrogen instead of atomic hydrogen likely dominates in sources with high mass loss rates ( few 10-7 M⊙ yr-1), probably an effect of their low atmospheric temperature. Still, the recent results of Matthews et al. (2015) show that the H i line at 21 cm can be a useful probe of the outer regions of sources with low stellar effective temperature ( 2500 K).
For sources with mass loss rates 10-7 M⊙ yr-1, which are detected in H i, the global agreement between the observed line profiles and the simulations based on the second scenario suggests that their central stars undergo mass loss smoothly over several 105 years.
Acknowledgments
We thank Pierre Darriulat and Jan Martin Winters for their continuous support and kind encouragements. We are also grateful to N. Cox and A. J. van Marle, the organisers of the Lorentz workshop on Astrospheres (Leiden, 9-13 dec. 2013), where the ideas developed in this paper started to take shape. DTH and PTN thank the French Embassy in Hanoi and the CNRS/IN2P3 for financial support. Financial and/or material support from the Institute for Nuclear Science and Technology, Vietnam National Foundation for Science and Technology Development (NAFOSTED) under grant number 103.08-2012.34 and World Laboratory is gratefully acknowledged. LDM is supported by grant AST-1310930 from the National Science Foundation. EV acknowledges Spanish Ministerio de Economía y Competitividad funding under grant AYA2013-45347P. TL acknowledges financial support by the CNRS programmes ASA and PCMI.
References
- [] Begum, A., Stanimirović, S., Peek, J. H., et al., 2010, ApJ, 722, 395
- [] Bowers, P. F., & Knapp, G. R., 1987, ApJ, 315, 305
- [] Dyson, J. E., & Williams, D. A., 1997, ”The physics of the interstellar medium”, 2nd edition, Institute of Physics Publishing
- [] Gardan, E., Gérard, E., & Le Bertre, T., 2006, MNRAS, 365, 245
- [] Gérard, E., & Le Bertre, T., 2006, AJ, 132, 2566
- [] Glassgold, A. E., & Huggins, P. J., 1983, MNRAS, 203, 517
- [] Hoai, D. T., 2015, PhD, in preparation
- [] Hoai, D. T., Matthews, L. D., Winters, J. M., Nhung, P. T., Gérard, E., Libert, Y., & Le Bertre, T., 2014, A&A, 565, A54
- [] Kalberla, P. M. W., Burton, W. B., Hartmann, D., Arnal, E. M., Bajaja, E., Morras, R., & Pöppel, W. G. L., 2005, A&A, 440, 775
- [] Knapp, G. R., & Bowers, P. F., 1983, ApJ, 266, 701
- [] Knapp, G. R., & Morris, M., 1985, ApJ, 292, 640
- [] Knapp, G.R., Pourbaix, D., Platais, I., & Jorissen, A., 2003, A&A, 403, 993
- [] Le Bertre, T., & Gérard, E., 2004, A&A, 419, 549
- [] Le Bertre, T., Matthews, L. D., Gérard, E., & Libert, Y., 2012, MNRAS, 422, 3433
- [] Le Bertre, T., Tanaka, M., Yamamura, I., & Murakami, H., 2003, A&A, 403, 943
- [] Lequeux, J., 2005, The Interstellar Medium, Astronomy & Astrophysics Library, Springer, Berlin Heidelberg New-York
- [] Levinson, F. H., & Brown, R. L., 1980, ApJ, 242, 416
- [] Libert, Y., Gérard, E., & Le Bertre, T., 2007, MNRAS, 380, 1161
- [] Libert, Y., Gérard, E., Thum, C., Winters, J. M., Matthews, L. D., & Le Bertre, T., 2010, A&A, 510, A14
- [] Loup, C., Forveille, T., Omont, A., & Paul, J. F., 1993, A&AS, 99, 291
- [] Matthews, L. D., Gérard, E., & Le Bertre, T., 2015, MNRAS, in press (arXiv:1502.02050)
- [] Matthews, L. D., Le Bertre, T., Gérard, E., & Johnson, M. C., 2013, AJ, 145, 97
- [] Matthews, L. D., Libert, Y., Gérard, E., Le Bertre, T., & Reid, M. J., 2008, ApJ, 684, 603
- [] Matthews, L. D., Libert, Y., Gérard, E., Le Bertre, T., Johnson, M. C., & Dame, T. M., 2011, AJ, 141,
- [] Matthews, L. D., Marengo, M., Evans, N. R., & Bono, G., 2012, ApJ, 744, 53
- [] Matthews, L. D., & Reid, M. J., 2007, AJ, 133, 2291
- [] Morris, M., & Jura, M., 1983, ApJ, 264, 546
- [] Morris, M., Lucas, R., & Omont, A., 1985, A&A, 142, 107
- [] Olofsson, H., 1999, IAU Symposium 191, 3
- [] Olofsson, H., Bergman, P., Lucas, R., Eriksson, K., Gustafsson, B., & Bieging, J. H., 2000, A&A, 353, 583
- [] Peek, J. E. G., Heiles, C., Douglas, K. A., et al., 2011, ApJS, 194, 20
- [] Reich, W., 1982, A&AS, 48, 219
- [] Reich, P., & Reich, W., 1986, A&AS, 63, 205
- [] Reich, P., Testori, J. C., & Reich, W., 2001, A&A, 376, 861
- [] Sahai, R., 1990, ApJ, 362, 652
- [] Saul, D. R., Peek, J. E. G., Grcevich, J., et al., 2012, 758, 44
- [] Schöier, F. L., & Olofsson, H., 2001, A&A, 368, 969
- [] Stil, J. M., Taylor, A. R., Dickey, J. M., et al., 2006, AJ, 132, 1158
- [] van Leeuwen, F., 2007, ”Hipparcos, the New Reduction of the Raw Data”, Springer, Astrophysics and Space Science Library, vol. 350
- [] Vassiliadis, E., & Wood, P. R., 1993, ApJ, 413, 641
- [] Villaver, E., García-Segura, G., & Manchado, A., 2002, ApJ, 571, 880
- [] Villaver, E., García-Segura, G., & Manchado, A., 2003, ApJ, 585, L49
- [] Villaver, E., Manchado, A., & García-Segura, G., 2012, ApJ, 748, 94
- [] Winters, J. M., Le Bertre, T., Jeong, K. S., Helling, C., & Sedlmayr, E., 2000, A&A, 361, 641
- [] Young, K., Phillips, T. G., & Knapp, G. R., 1993, ApJ, 409, 725
- [] Zuckerman, B., Terzian, Y., & Silverglate, P., 1980, ApJ, 241, 1014