Rule-based Cross-matching of Very Large Catalogs in NED
Abstract
The NASA/IPAC Extragalactic Database (NED) has deployed a new rule-based cross-matching algorithm called Match Expert (MatchEx), capable of cross-matching very large catalogs (VLCs) with million objects. MatchEx goes beyond traditional position-based cross-matching algorithms by using other available data together with expert logic to determine which candidate match is the best. Furthermore, the local background density of sources is used to determine and minimize the false-positive match rate and to estimate match completeness. The logical outcome and statistical probability of each match decision is stored in the database, and may be used to tune the algorithm and adjust match parameter thresholds. For our first production run, we cross-matched the GALEX All Sky Survey Catalog (GASC), containing nearly 40 million NUV-detected sources, against a directory of 180 million objects in NED. Candidate matches were identified for each GASC source within a radius. These candidates were filtered on position-based matching probability, and on other criteria including object type and object name. We estimate a match completeness of 97.6% and a match accuracy of 99.75%. MatchEx is being used to cross-match over 2 billion catalog sources to NED, including the Spitzer Source List, the 2MASS Point-Source Catalog, AllWISE, and SDSS DR 10. It will also speed up routine cross-matching of sources as part of the NED literature pipeline.
1 Introduction
1.1 Background
The NASA/IPAC Extragalactic Database (NED) provides a comprehensive fusion of multiwavelength data on extragalactic astrophysical objects, from data published in the astronomical literature and large, online catalogs (Helou & Madore 1988; Helou 1990; Mazzarella et al. 2007). With a rapid increase in data volume from space and ground-based surveys, NED is developing new methods for keeping apace. We have implemented a new rule-based cross-matching algorithm for very large catalogs (VLCs) with sources. All catalog source and NED object attributes, continuous (e.g. position) or discrete (e.g. object type), are potential match discriminants. Match metrics and outcome are tabulated in the database for statistical analysis. We chose the 40 million source GALEX All Sky Survey Catalog as the first VLC for NED to tackle with this methodology. NED will continue to ingest and integrate even larger VLCs over the next few years, including the the Spitzer Source List, the 2MASS Point Source Catalog, AllWISE, and SDSS DR10.
Cross-matching is a central component of the Virtual Observatory concept because it is a prerequisite for combining multiwavelength data (Malkov, O. et al. 2012). One important application is the identification of rare objects of interest by their SEDs, for example brown dwarfs selected by their SDSS-2MASS colors (Metchev et al. 2008; Geissler et al. 2011). Methods for cross-matching VLCs typically involve selecting candidate matches between two catalogs within a pre-defined separation threshold. Other algorithms utilize Bayesian statistics to select the most likely match, based on any number of parameters (Budavari & Szalay 2008). We have opted for an approach that begins with positional matching then applies additional criteria to select among match candidates, making use of the rich array of parameters available in NED. We measure the local density of background objects in the vicinity of each source to estimate the Poisson likelihood that an object is either a good match or a background object.
For NED, we make a distinction between entries in an incoming catalog (catalog sources) and the distinct entries in the NED object directory that we match them to (NED objects). Catalog sources are typically listed as detections at one or more wavelength bands. NED objects are intended to represent unique astrophysical objects. For each object, NED provides cross-identifications to any catalog sources that NED has cross-matched to them, their positions, redshifts, photometric data, diameter measurements, classifications, morphologies, and other descriptors, where available.
2 Methodology
2.1 Cross-matching VLCs with NED
We take the following steps to cross-match a catalog in NED. First, we load catalog source data (position, name, photometry, etc.) into the database before matching. At this point the names and positions of VLC sources with positions may be made immediately available for perusal in NED. Next, we perform a positional search for match candidates in the database with the NED Cone Search (CSearch). Then we run the NED Match Expert (MatchEx) on a representative sample of match candidates to tune match rules and thresholds. After statistical optimization, we run MatchEx on the entire VLC. Any matches, new objects, or associations are loaded into the database by the Object Loader.
We use the PostgreSQL stored procedure CSearch to select all NED objects within a fixed search radius of each catalog source as match candidates. The number of background sources is counted within a fixed background radius , for use in computing the Poisson match probability. We also search for neighboring catalog sources within of each catalog source, in order to identify candidate match conflicts.
We use the Python program MatchEx to select the best match candidate (if any) to each catalog source. MatchEx operates on source and object parameters from CSearch output. MatchEx currently uses source and object positions, position uncertainties, separation , types (e.g. UvS, QSO), names, background object density n, and telescope beam size. The separation uncertainty is taken to be the sum in quadrature of the catalog and NED position uncertainties. MatchEx uses conditional logic to determine which NED objects in the search region centered on each catalog source are acceptable matches. The match criteria include thresholds on separation , normalized separation , Poisson probability , and type and name preferences or exclusions. Additional criteria for future VLC matching may utilize photometry, redshifts, and detailed morphological or spectral classifications.
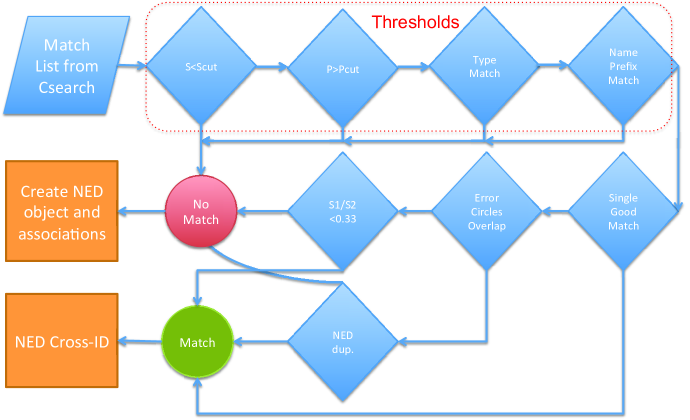
For any given catalog source there are three possible MatchEx outcomes. If one object meets all match criteria then it makes the cross-ID. If no single object meets all match criteria then it creates a new NED object and any associations. If multiple (N) sources match a single object, then it creates N new objects and (N+1)N/2 associations.
2.2 Position-based Match Probability
MatchEx uses the Poisson statistic to estimate the false-positive rate for pure position matching. However, this value should be regarded as an upper limit since the MatchEx selection algorithm uses additional source and object parameters to eliminate background and improve match accuracy. The number , and mean local surface density of NED objects is measured within the background radius , and used to estimate the background contamination rate. The Poisson probability is computed from the Poisson distribution , where is the number of sources found within separation , and is the expected number of background objects within . For each source-object match candidate, we compute the likelihood that background sources are found closer to the source than , . Summing up the Poisson probabilities for all matches gives the false-positive match rate . Note that the value has to be determined experimentally from the MatchEx matching results. We can tune the false-positive match rate by raising or lowering the Poision probability match threshold .
For the most efficient search, the ratio (background radius)/(search radius) needs to be adjusted to the Poisson probability threshold. If this ratio is too small, objects found in an outer annulus of the search region will have Poisson probabilities below the threshold, even when there are zero additional objects inside the background radius. This ratio is optimal for background sources when . For example, is the most efficient value to use for a Poisson threshold of 0.90.
2.3 Match Selection Logic
The match selection logic used by MatchEx is illustrated in Figure 1 and summarized as follows. A match is made between a catalog source and a NED object when there is a single object in the search radius with , , , of allowed object type, and that does not overlap another NED object. Overlap occurs when two or more NED objects have overlapping position error circles (95% enclosed probability), such that there is a significant chance that they represent the same astrophysical object. If there are multiple objects matching the above criteria, and only one of them has a preferred object type or preferred cross-ID prefix, then that object is a match. Otherwise, if there are multiple objects matching the above criteria, a match is made to the closest object if the ratio of separation to the second closest object is . However, if there are two or more objects of the same type within , these are assumed to be duplicate NED objects, and the source will be matched to the object with the most cross-ID’s (a measure of popularity).
2.4 Preferred and Excluded Object Types and Names
A good way to reduce the background object confusion is to exclude illogical, problematic, or unlikely object types or names, or to preferentially match preferred (likely) object types or names. For GALEX ASC, objects with AbLS, GClstr, and GGroup types are excluded because they should not match to a (single) optical source. A generic GammaS, X-rays, SmmS, or RadioS that has not previously been cross-ID’d with an optical source will typically have a large beam and large positional uncertainty not suitable for matching. Matches to variable sources such as Novae and SNe were not allowed since source observation times are not included in the catalog. GASC source matches to NED objects with object types or cross-ID types of UvES (UV-excess) or with object name or cross-ID name beginning with the string “GALEX” were preferred. This means that if there was only one UvES or GALEX match candidate within the search radius and it fell within the match thresholds for all other parameters, it was selected.
2.5 Associations
Two types of associations are created to indicate a non-match relationship between catalog sources and NED objects: ErrorOverlap and InBeam. An ErrorOverlap association is created where a catalog source has a position error circle that overlaps that of a NED object and vice versa. This is an example of a symmetric association (). An InBeam association indicates a NED object that falls inside a catalog source beam ( for GALEX). This is an asymmetric association (), useful for indicating when a catalog source may combine photons from multiple NED objects, or if a candidate match was rejected for other reasons, even though it was the only NED object that fell inside the source beam.
3 Input Data
The GALEX All-Sky Survey Source Catalog (GASC; Seibert 2012) contains 39,570,031 NUV-selected sources, corresponding to detections in the NUV band . The GASC survey covers 26,300 square degrees (8.0 sr, or 63.8% of the sky), consisting of all GALEX exposures with exposure times sec (typically 100 sec), imaged to a mean depth of NUV mag (AB). Gaps in sky coverage include the Galactic plane, Magellanic Clouds, and regions containing bright stars. The GALEX imaging FWHM is in the NUV band, giving a Gaussian beam diameter of at 10% peak flux. GASC Photometry consists of measurements in the NUV (Å, Å) and FUV (Å, Å) bands. NED has selected photometry from two different methods for each of the FUV and NUV bands to include in its photometric database. The first method gives the Kron flux in an elliptical aperture, which is appropriate for extended sources. The second method gives the flux in a diameter aperture. GASC was matched to candidates selected from the NED 23.7 production database in 2013 October. That version of NED contained roughly 180 million unique objects derived from references, with million multiwavelength cross-IDs.
4 Tuning MatchEx
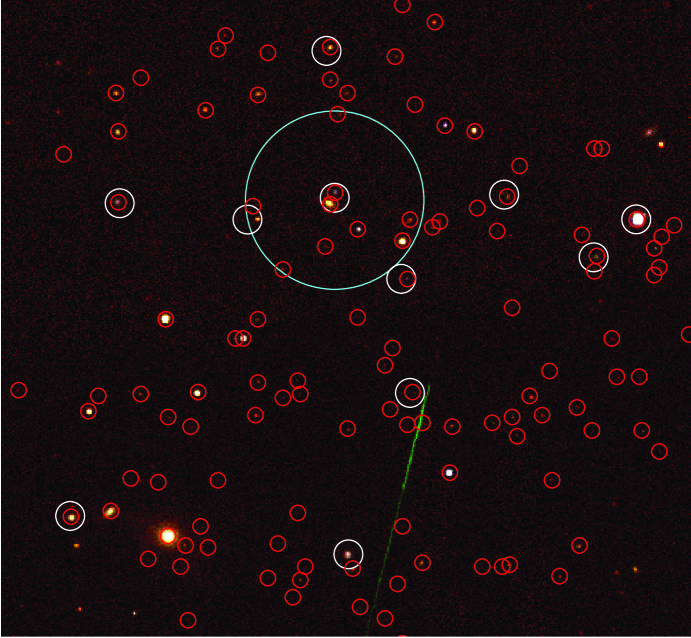
To tune the MatchEx algorithm, match thresholds, and performance, test runs were conducted using GASC sources in circular regions centered at (RA,Dec)(200,+30) in the Sloan Digital Sky Survey (SDDS) North Galactic Pole (NGP) survey region; and outside the SDSS survey region, centered at (RA,Dec) (60,+30). The search radius for each source (Figure 2) was selected to be after considering the observed separation distribution of GASC-NED matches. A background radius of was used for measuring the local background density for use in calculating the Poisson match likelihood.
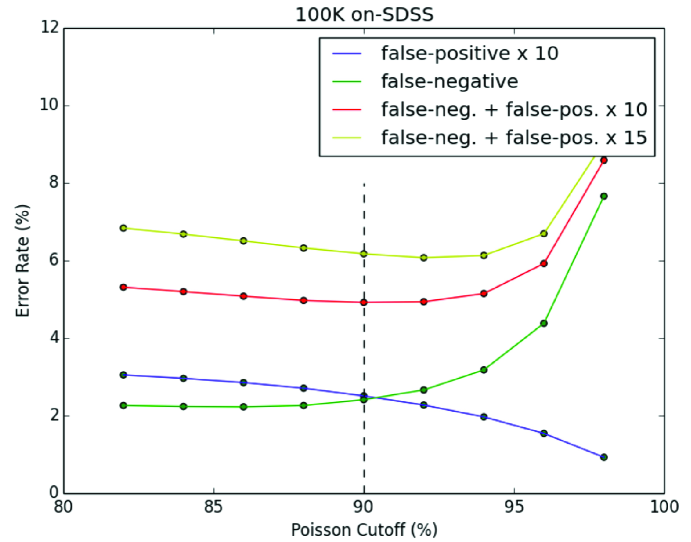
The goal in tuning the match thresholds is to minimize both the false positive and false negative match rates. These two rates tend to offset one another, with more strict thresholds reducing the false positive rate at the expense of increased false negative rate. Where this trade-off is optimized depends on how much weight is given to accuracy versus completeness. Because we think it is much worse to make an incorrect match than to miss a potentially good match, we use the combined error rate as our performance metric for MatchEx.
The Poisson statistic is the primary statistic that we use to determine match likelihood, and it is directly related to the false positive match rate. We ran the GASC 100K test several times with Poisson statistic threshold in the range to find the dependence of , , and on (Figure 3). We find that is minimized for a Poisson threshold of . The minimum in is rather broad, so the precise value of does not make much difference in the range . We have not yet made a detailed study of the impact of other thresholds and selection criteria (search radius, object type exclusions, and object name preferences) on the match error rate.
5 Results
5.1 Overall Statistics
From the 39,570,031 GASC UV sources and 23,301,552 NED object match candidates, there are 10,595,382 (26.8%) matches to NED objects and 28,974,649 (73.2%) no matches, of which 26,984,670 (68.2%) are no-matches in NED blank fields. The remaining 1,992,979 (5.0%) of no-matches occur in non-blank fields, including fields with one match candidate (2.6%), two match candidates (1.2%), 3 match candidates (0.7%), and 4 or more match candidates (0.6%).
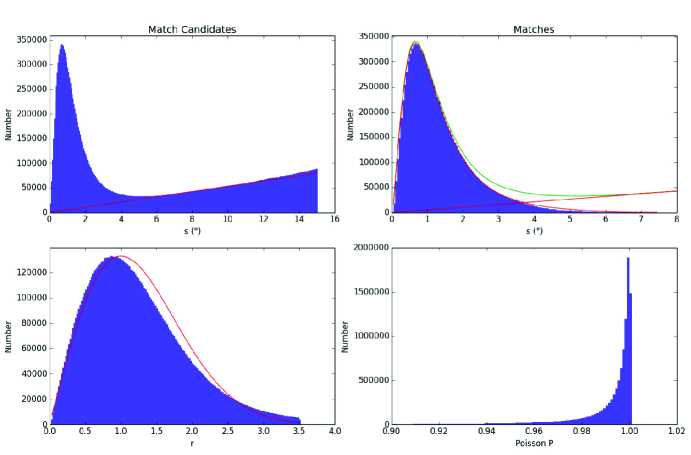
We present distributions for the position-based matching parameters in Figure 4 for MatchEx selected matches, compared to the unfiltered CSearch selected match candidates. The number of match candidates is expected to increase linearly with separation at large separation (), for uniform mean background density: , . By integrating under the linear background fit, we estimate the number of background objects within to be 2,980,000 (21.5% of match candidates). This is similar to the number of rejected match candidates (3,275,249 or 23.6%) inside this radius. The actual match separation distribution is close to the one obtained by subtracting the linear background fit from the match candidate separation distribution, indicating that MatchEx does a good job of eliminating background NED sources as matches. The small difference between the two at gives an estimate of for the false negative match rate.
The distribution of vs. is compared to the derivative of a Gaussian function (Fig. 4). The peak of the vs. distribution lands near , showing that the scale of the combined GASC and NED position error bars may be overestimated by 10%. However, there is an excess of matches at compared to a Gaussian with standard deviation . This shows that the error distribution in separation is not perfectly matched to a Gaussian distribution. We used a match threshold of , aiming to limit the match incompleteness to 0.2%. However, the non-Gaussian distribution of separation errors led to greater incompleteness.
The Poisson probability density distribution for CSearch match candidates peaks sharply at a value of . There is a tail of match candidates with probabilities , corresponding to background NED objects. The chosen Poisson match threshold of roughly matches the location in the distribution where the density of true matches begins to exceed the number of false-positives.
5.2 Object Type Statistics
Table 1 gives the breakdown of GASC-NED candidate matches and matches by NED preferred object type (http://ned.ipac.caltech.edu/help/faq5.html#5k). The top-9 most abundant types account for 99.94% of the total matches. Galaxies (G) are most abundant, making up roughly 61% of GASC-NED matches. Stellar objects (*) are second, making up roughly 36% of matches. The remaining 3% of matches are to NED object types VisS, QSO, !*, UvES, IrS, WD*, and GPair in order of abundance. To study the object type abundance patterns for matches, we take the ratio of their abundances divided by the overall abundances in NED (last column of Table 1). Matches to objects of type QSO, !*, UvES, and WD are significantly enhanced, by factors of 9-14 relative to their NED abundances, which may reflect the tendency for these types of objects to be relatively UV-bright. On the other hand, matches of type IrS are under abundant, with a ratio of 0.32 with respect to NED.
6 Future Improvements
Match accuracy may be improved by considering the full array of object data compiled by NED, including redshifts, photometry, diameters, and detailed classifications. Spectroscopic redshifts are only available for a small fraction of NED objects, but can provide a strong constraint for matching. Photometric constraints should be relatively weak since we do not want to bias matches against objects with unusual SEDs. We also plan to make use of object size, overlap, and type for extended sources. Finally, we are generalizing our cross-matching algorithm to handle smaller, heterogeneous catalogs federated from the NED literature pipeline.
| Type | NED | Cand. | Match | Matched | NED | Cand. | Match | Abund. |
|---|---|---|---|---|---|---|---|---|
| Code | % | % | % | % | Ratio | |||
| G | 102,386,926 | 13,816,821 | 6,447,394 | 46.6 | 57.2 | 59.3 | 60.8 | 1.06 |
| 68,268,375 | 8,391,557 | 3,801,913 | 45.3 | 38.1 | 36.0 | 35.9 | 0.94 | |
| VisS | 1,821,299 | 321,549 | 99,406 | 30.9 | 1.02 | 1.38 | 0.94 | 0.92 |
| IrS | 1,661,077 | 239,803 | 31,370 | 13.1 | 0.93 | 1.03 | 0.30 | 0.32 |
| RadioS | 2,025,701 | 152,692 | 0 | 0.0 | 1.13 | 0.66 | 0 | 0 |
| QSO | 163,260 | 98,648 | 86,681 | 87.9 | 0.091 | 0.42 | 0.82 | 9.01 |
| ! | 89,416 | 69,301 | 58,859 | 84.9 | 0.050 | 0.30 | 0.56 | 11.2 |
| UvES | 129,330 | 62,752 | 56,238 | 89.6 | 0.072 | 0.27 | 0.53 | 13.6 |
| XrayS | 407,843 | 52,820 | 0 | 0.0 | 0.23 | 0.23 | 0 | 0 |
| GGroup | 92,910 | 34,739 | 0 | 0.0 | 0.052 | 0.15 | 0 | 0 |
| GPair | 26,669 | 9,759 | 2,312 | 23.7 | 0.015 | 0.042 | 0.022 | 1.47 |
| WD | 9,461 | 7,951 | 7,574 | 95.3 | 0.0053 | 0.034 | 0.071 | 13.4 |
Acknowledgments
The NASA/IPAC Extragalactic Database (NED) is operated by the Jet Propulsion Laboratory, California Institute of Technology, under contract with the National Aeronautics and Space Administration. We give special thanks to Mark Seibert (Carnegie Observatories) for providing a copy of the GALEX catalogs and for answering our questions about them.
References
- Budavari & Szalay (2008) Budavari, T. & Szalay, A. S. 2008, ApJ, 679
- Geissler et al. (2011) Geissler, K., Metchev, S., Kirkpatrick, J. D., Berriman, G. B. & Looper, D. 2011, ApJ, 732, 56
- Helou (1990) Helou, G. 1990, BICDS, 38, 7
- Helou & Madore (1988) Helou, G. & Madore, B. 1988, ESOC, 28, 335
- Mazzarella et al. (2007) Mazzarella, J. M. & the NED Team. 2007, ASPC, 376, 153
- Malkov, O. et al. (2012) Malkov, O., Dluzhnevskaya, O., Karpov, S., Kilpio, E., Kniazev, A., Mironov, A., & Sichevskij, S. 2012, BaltA, 21, 319
- Metchev et al. (2008) Metchev, S. A., Kirkpatrick, J. D., Berriman, G. B, & Looper, D. 2008, ApJ, 676, 1281
- Seibert (2012) Seibert, M. 2012GASC..C….0000S, http://www.galex.caltech.edu