Multidimensional Coherent Spectroscopy of a Semiconductor Microcavity
Abstract
Rephasing and non-rephasing two-dimensional coherent spectra map the anti-crossing associated with normal-mode splitting in a semiconductor microcavity. For a 12-meV detuning range near zero detuning, it is observed that there are two diagonal features related to the intra-action of exciton-polariton branches and two off-diagonal features related to coherent interaction between the polaritons. At negative detuning, the lineshape properties of the diagonal intra-action features are distinguishable and can be associated with cavity-like and exciton-like modes. A biexcitonic companion feature is observed, shifted from the exciton feature by the biexciton binding energy. Closer to zero detuning, all features are enhanced and the diagonal intra-action features become nearly equal in amplitude and linewidth. At positive detuning the exciton- and cavity-like characteristics return to the diagonal intra-action features. Off-diagonal interaction features exhibit asymmetry in their amplitudes throughout the detuning range. The amplitudes are strongly modulated (and invert) at small positive detuning, as the lower polariton branch crosses the bound biexciton energy determined from negative detuning spectra.
pacs:
73.21.Fg, 78.47.J-, 78.47.njSemiconductor microcavities supporting exciton-polaritons1a ; 1b are used in optoelectronic application1 ; 2 ; 3 and provide a platform for exploring exotic coherent physical phenomena.4 ; 5 ; 6 ; 7 ; 8 ; 9 ; 10 ; 11 ; 12 The normal-mode coupling between the photonic cavity mode () and the exciton resonance (X) enhances both the linear and nonlinear optical interactions.13a Transient four-wave mixing (FWM) confirm that strong exciton-cavity interactions modify the temporal behavior of the coherent response and many-body Coulomb correlations determine the exact dynamics,13 which affects dissipation5 ; 14 ; 15 and coherent control.16 ; 17 Biexciton-polaritons also contribute to the overall emission signal, even through the biexciton binding energy is only slightly altered by the cavity.18 ; 19
Multidimensional coherent spectroscopy (MDCS) is based on and supersedes FWM. At optical frequencies, MDCS has been utilized to study various semiconductor nanostructures.20 ; 21 ; 22 ; 23 ; 24 ; 25 ; 26 This technique retains both time and frequency resolution, is able to unambiguously distinguish a variety of quantum pathways (including those with non-radiative steps),27 and can separate homogeneous and inhomogeneous broadening.28 To date, two-quantum, and higher-order,29 coherent spectra have shown that many-body interactions dominate the signals, including a contribution from bound biexcitons for excitation with the correct polarization configuration. Two-dimensional coherent spectroscopy (2DCS) has also examined coherence and control of excitonic qubits in microcavity pillars.29a
Despite the extensive fundamental and applied studies of microcavity exciton-polaritons, the anti-crossing has not been systematically mapped using MDCS. In this paper, normal-mode splitting of a semiconductor microcavity and the associated exciton-polariton branches are mapped using rephasing and non-rephasing 2DCS. This study is performed over a range of energy detuning () near the anti-crossing, where and correspond the cavity-mode and exciton-mode energies respectively. The detuning-dependence of spectral features, related to intra-action (diagonal features) of and interaction (off-diagonal features) between polariton branches, informs us about the coupling between the cavity and excitonic or biexcitonic modes. For example, a contribution from a bound biexciton is isolated at negative detuning, which is convolved with the off-diagonal features at positive detuning and strongly modulates their relative amplitudes.
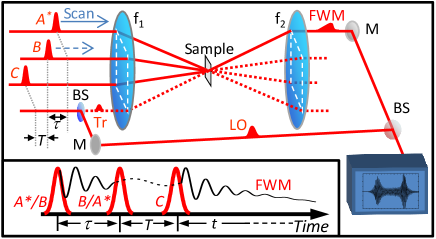
The experimental setup is described fully elsewhere.30 In brief, the laser source is a mode-locked Ti:Sapphire oscillator that produces 100-fs pulses. A MONSTR is used to create and phase control four identical pulses arranged on the corners of a box. As shown in Fig. 1, three pulses impinge the microcavity sample, which resides in an optical cryostation at the focus and crossing point of the beams. A tracer (Tr) beam is used for alignment and blocked for the FWM and 2DCS measurements. All measurements are performed in the third-order nonlinear optical regime, excited with average powers of mW per beam. In a third-order perturbation excitation scheme, the signal is generated from interaction by all three excitation pulses. The excitation sequence is shown in the inset of Fig. 1: the first pulse creates a coherent superposition between the ground and excited states, the second pulse then creates a population in either the ground or excited state, and the third pulse converts the population into a radiating polarization. This polarization is emitted as a transient FWM signal, which is collected in transmission mode and directed to a spectrometer and CCD camera.
The microcavity sample (denoted NMC73) was grown by molecular beam epitaxy on a GaAs substrate.1a The mirrors consist of GaAs/AlAs (14.5 and 12 bilayer) distributed Bragg reflectors separated by a wedged GaAs cavity, with a cavity mode close to 830 nm. In the center of the cavity, at the antinode of its electric field, is a single 8-nm In0.04Ga0.96As quantum well. The reflection properties at low temperature (not shown) exhibit the typical normal-mode splitting expected for such a structure. Translating the sample detunes the cavity mode with respect to the bare exciton energy.
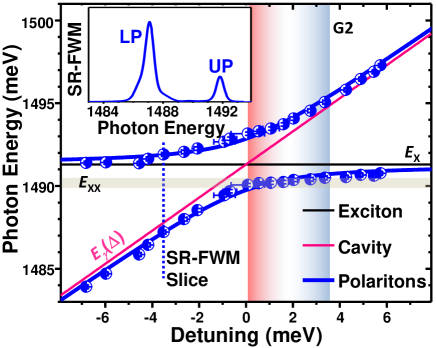
Spectrally resolved FWM is acquired as a precursor to performing 2DCS with fs and fs. The inset of Fig. 2 shows a typical spectrum, revealing resonances associated with the lower (LP) and upper (UP) polariton branches. Figure. 2 shows the spectral positions extracted from spectra measured at different positions on the sample. The detuning, , is determined for each spectrum by modeled the data using
| (1) |
where is the vacuum Rabi splitting, a measure of the coupling between the optical field and the excitons. It is found that meV and meV, which both agree well with results on similar structures.1a The inset spectrum is then indicated as a dashed vertical line at meV. Microcavities are sensitive to the angle of incidence, since the dispersion varies with the in-plane wavevector. Here the external angle of incidence for each beam is approximately 7o and the axis of the box of pulses is at normal incidence. Each beam couples to slightly different polariton states in momentum space, which may lift the measured energy and lower the overall signal strength. However, close to zero detuning, the FWM emission requires attenuation of at least ND2.5, indicating minimal momentum-related signal reduction and excitation within the parabolic region of the in-plane momentum.31
For 2DCS measurements, the transient FWM is collected in the spectrometer along with a phase-stabilized local oscillator (LO) pulse, such that complex spectra can be recorded by spectral interferometry. Spectra are acquired for a range of time delays, , scanned in phase-stabilized increments. A numerical Fourier transform is performed to convert to . If the conjugate pulse is scanned backward in time (toward the sample), the time-ordering results in the phase-matching condition . Transient FWM exhibits a photon echo for inhomogeneously broadened systems. This method records a rephasing 2D spectrum, , wherein the diagonal () of the plot is towards the lower right corner, due to the numerical choice of the emission photon energy. Rephasing spectra allow for the separation of homogeneous and inhomogeneous linewidths. Alternatively, if pulse is scanned instead of pulse , then the phase matching becomes and the spectrum is non-rephasing, .
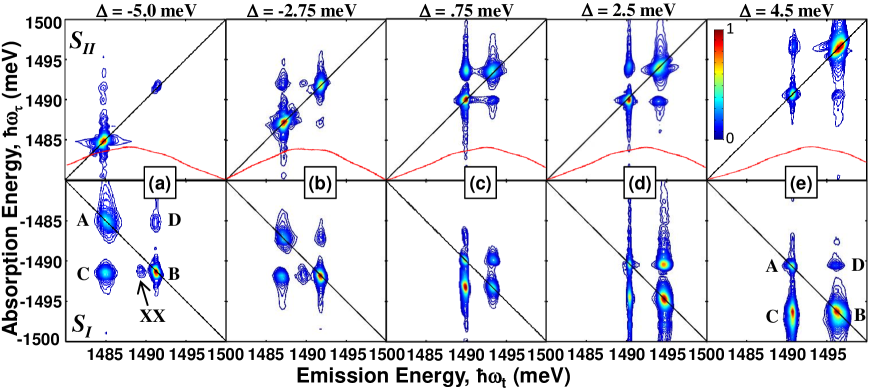
Figure 3 shows the absolute field amplitude of the rephasing (bottom row) and non-rephasing (top row) 2DCS results for a range of detuning values from (a) meV to (e) meV. Excitation is performed with a mixing time fs and collinear polarization (XXXX), where the notation corresponds to the polarization state of the three pump pulses and the emission. Each panel is normalized to the strongest peak for presentation. At each value of the laser spectrum is overlaid with the non-rephasing spectrum, illustrating that the two resonances are excited equally in each case. This is important for careful comparison of the relative amplitudes of each feature as a function of detuning. Due to the transmission geometry, strong absorption of the tracer beam prevents experimental determination of the global phase using all-optical methods or via spectrally-resolved transient absorption.32 Hence, only amplitude spectra are shown.
In Fig. 3(a) the -like mode is the low-energy feature, denoted A, and is broader than the higher-energy X-like mode, denoted B. From analysis of the lineshapes the cross-diagonal width is dominated by the homogeneous linewidths32a of intra-action features A and B, yielding values of meV and meV respectively. In comparison, the diagonal linewidths, which can be dominated by inhomogeneous broadening, are only slightly wider in each case: meV and meV. In addition to the diagonal intra-action features, two off-diagonal interaction features C and D are observed, which are due to coherent coupling between the A and B features.20
Increasing shifts all spectral features toward higher energy. The separation between the A and B modes (projected onto the emission axis) is meV in (a), decreases as tends to zero, becoming meV in (c), and increases again to meV in (e). Close to zero detuning ( meV), the homogeneous linewidths of A and B in the spectra are meV and meV respectively. The properties are nearly identical and -like and X-like characteristics are no longer distinguishable, since it is expected that the observed linewidths should become identical.32b For larger positive detuning the homogeneous linewidths of A and B are meV and meV respectively. The -like and X-like characteristics are once again distinguishable, but are not quite the same as for negative detuning. As expected from analysis of the Hopfield coefficients,18 the modes switch and the -like mode is now the upper polariton, B. The mode switch is consistent with results where the mirror reflectivity results in a narrower cavity than bare exciton linewidth.32b
Collinear polarization in 2DCS allows for excitation to the biexciton (XX) states.33 For bound biexcitons, binding energy acts to shift the XX feature laterally from the X-like mode in the emission energy, . This feature is only observed for negative detuning, from which the XX binding energy is determined to be meV. The biexciton follows the expected excitation-density dependence and is suppressed for co-circular polarization (data not shown). Its cross-diagonal linewidth is almost identical to that for the X-like mode, which is expected because the quantum pathway that creates the XX feature is a two-step excitation via the exciton. Hence, the linewidth projected on the absorption energy, , should be identical to that for the exciton. The linewidth projection onto may be a little wider (tilting the feature away from the diagonal), depending on the degree of correlation of the exciton and biexciton states.34 ; 35 In this case, the exciton and its biexciton are parallel and are highly correlated.
Non-rephasing, , are presented for comparison, showing very similar results to spectra across the entire detuning range. spectra typically have slightly weaker off-diagonal features, as is observed here. Otherwise, the two diagonal intra-action, two off-diagonal interaction and biexciton features are all observed as discussed above.
Figure 4 shows the integrated amplitude versus detuning for the four main polaritonic features A through D. In each case, a small area around each feature is integrated. Panel (a) shows the total integrated amplitude for a 12-meV detuning range and is normalized to the highest emission strength at meV. Significant enhancement of the exciton-polariton transition are observed due to normal-mode coupling,36 as the integrated amplitude increases and peak close to zero detuning. The peakshape of extracted total amplitude is asymmetric in detuning37 and can be fit with two gaussian lineshapes: G1 is centered at zero detuning and G2 is centered at 1.88 meV (G2), corresponding to the biexciton binding energy determined from negatively detuned spectra. Fitted full widths at half maximum of G1 and G2 are meV and meV respectively. The sum of G1 and G2 well represent the -dependence peakshape.
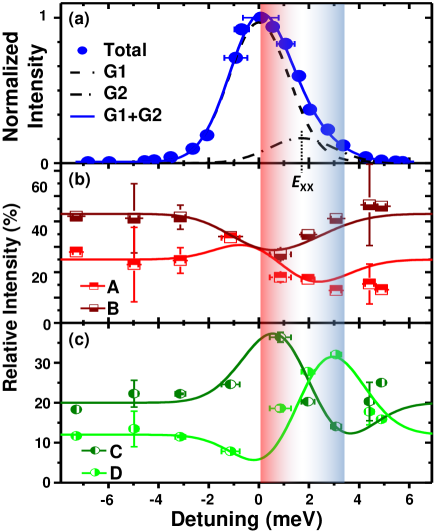
Figure 4 (b) and (c) show -dependence of the relative amplitude for the individual diagonal intra-action and off-diagonal interaction spectral features. From each spectrum the individual features’ integrated amplitudes are extracted and normalized to the total integrated amplitude. At zero detuning the relative amplitudes of the diagonal intra-action features are identical, showing that normal-mode coupling leads to enhancement and equalization of the UP and LP branches. Away from zero detuning the higher-energy diagonal feature, B, is always stronger and the overall amplitude of the diagonal features drops at small positive detuning. In contrast, the relative integrated amplitude of the off-diagonal features is smaller at negative detuning and oscillates for positive detuning. The oscillation position is consistent with the position of the small G2 peak from panel (a). In this range, the amplitude of peak C increases rapidly, corresponding to the increasing slope of G2, and decreases rapidly to become smaller than D, corresponding to the decreasing slope of G2. Both the width of G2 and the range of where the oscillations occurs agree well with the width of the LP branch passing through the bound biexciton; see Fig. 2.
The solid lines in Fig. 4(b) and (c) model the relative amplitudes of the diagonal and off-diagonal features based on the following parameters. First, amplitude offsets for each feature are selected from negative detuned spectra, yielding 25 , 43 , 10 and 12 , for A, B, C and D respectively. Second, near meV, the strength of the two diagonal features equalizes, bringing the two modes close in amplitude in the range of the G1 profile. This % deviation is symmetric for each feature. Third, in the region of the G2 profile % of the spectral weight is transferred from both diagonal features to the off-diagonal features, most likely due to additional many-particle interaction terms in the quantum pathways to the biexciton manifold. Fourth, the off-diagonal features experience a modulation in their spectral weight by approximately %, which is most likely due to a attraction or repulsion of LP branch as it passes through XX. The latter two effects are complementary evidence of the recently observed Feshbach resonance.12 Feshbach resonances occur when the energy of two free, yet interacting, polaritons is in resonance with the bound molecular excitonic state. Off-diagonal features are the interaction between the LP and UP branches, so that even though the LP branch alone overlaps with the XX, both off-diagonal amplitudes are modulated and invert. This result arises from coherent coupling by quantum interference of the polaritons through the shared ground state or by a Raman-like coherence between the excited polaritons.27 2DCS sensitivity is revealed, because no splitting is observed associated with the Feshbach resonance in the linear spectra, yet the influence of this LP-XX crossing is clear.
In summary, this study has mapped the detuning dependence of the cavity mode through the exciton and biexciton modes of a single quantum well and isolated the coherent response using two-dimensional coherent spectroscopy. Enhancement of the four-wave mixing emission was observed near zero detuning, along with anti-crossing of the upper and lower polariton branches. Homogeneous and inhomogeneous linewidths are found to be consistent with those for a wider cavity than bare exciton mode Amplitudes of the spectral features are highly sensitive to the interaction between exciton, biexciton and cavity modes, revealing strong modification as bands intersect. This work paves the way for determining contributions through polarization- and excitation-dependent studies using 2DCS and begs full microscopic theoretical treatment to reproduce spectral features. Moreover, these methods can be used to disentangle the coherent and transient phenomena that parallel processes identified in ultracold atomic physics, such as condensation and superfluidity.
The authors wish to acknowledge Steven Cundiff for useful discussions. The work at WVU was supported by the National Science Foundation (CBET-1233795) and the WV Higher Education Policy Commission (HEPC.dsr.12.29). Work at Arizona was supported by AFOSR (FA9550-13-1-0003), NSF-AMOP and NSF REC-CIAN.
References
- (1) G. Khitrova, H. M. Gibbs, F. Jahnke, M. Kira and S. W. Koch, “Nonlinear optics of normal-mode-coupling semiconductor microcavities,” Rev. Mod. Phys. 71, 1591 (1999).
- (2) H. M. Gibbs, G. Khitrova and S. W. Koch,“Exciton-polaritons light-semiconductor coupling effects,”Nature Photon. 5, 273 (2011).
- (3) S. Christopoulos, G. B. H. von Högersthal, A. J. D. Grundy, P. G. Lagoudakis, A. V. Kavokin, J. J. Baumberg, G. Christmann, R. Butté, E. Feltin, J.-F. Carlin and N. Grandjean,“Room-temperature polariton lasing in semiconductor microcavities,” Phys. Rev. Lett. 98, 126405 (2007).
- (4) P. Bhattacharya, T. Frost, S. Deshpande, M. Z. Baten, A. Hazari and A. Das, “Room temperature electrically injected polariton laser,” Phys. Rev. Lett. 112, 236802 (2014).
- (5) A. Imamoğlu, R. J. Ram, S. Pau and Y. Yamamoto, “Nonequilibrium condensates and lasers without inversion: Exciton-polariton lasers,” Phys. Rev. A 53, 4250 (1996).
- (6) H. Deng, G. Weihs, C. Santori, J. Bloch and Y. Yamamoto, “Condensation of semiconductor microcavity exciton polaritons,” Science 298, 199 202 (2002).
- (7) J. Kasprzak, M. Richard, S. Kundermann, A. Baas, P. Jeambrun, J. M. J. Keeling, F. M. Marchetti, M. H. Szymaska, R. Andr, J. L. Staehli, V. Savona, P. B. Littlewood, B. Deveaud and L. S. Dang, “Bose-Einstein condensation of exciton polaritons,” Nature 443, 409 (2006).
- (8) I. A. Shelykh, Y. G. Rubo, G. Malpuech, D. Solnyshkov and A. Kavokin, “Polarization and Propagation of Polariton Condensates,” Phys. Rev. Lett. 97, 066402 (2006).
- (9) R. Balili, V. Hartwell, D. Snoke, L. Pfeiffer and K. West, “Bose-Einstein condensation of microcavity polaritons in a trap,” Science 316, 1007 (2007).
- (10) G. Roumpos, M. D. Fraser, A. Löffler, S. Höfling, A. Forchel and Y. Yamamoto, “Single vortex antivortex pair in an exciton-polariton condensate,” Nature Phys. 7, 129 (2011).
- (11) A. Amo, J. Lefrère, S. Pigeon, C. Adrados, C. Ciuti, I. Carusotto, R. Houdré, E. Giacobino and A. Bramati, “Superfluidity of polaritons in semiconductor microcavities,” Nature Phys. 5, 805 (2009).
- (12) D. Sanvitto, F. M. Marchetti, M. H. Szymańska, G. Tosi, M. Baudisch, F. P. Laussy, D. N. Krizhanovskii, M. S. Skolnick, L. Marrucci, A. Lemaître, J. Bloch, C. Tejedor and L. Viña, “Persistent currents and quantized vortices in a polariton superfluid,” Nature Phys. 6, 527 (2010).
- (13) D. V. Skryabin, D. N. Krizhanovskii, M. S. Skolnick, E. A. Cerda-Méndez and R. Hartley, “Solitons in semiconductor microcavities,” Nature Photon. 6, 204 (2012).
- (14) N. Takemura, S. Trebaol, M. Wouters, M. T. Portella-Oberli and B. Deveaud, “Polaritonic Feshbach resonances,” Nature Phys. 10, 500 (2014).
- (15) Y.-S. Lee, T. B. Norris, M. Kira, F. Jahnke, S. W. Koch, G. Khitrova and H. M. Gibbs, “Quantum Correlations and Intraband Coherences in Semiconductor Cavity QED,” Phys. Rev. Lett. 83, 5338 (1999).
- (16) M. Koch, J. Shah and T. Meier, “Coupled absorber-cavity system: Observation of a characteristic nonlinear response,” Phys. Rev. B 57, R2049 R2052 (1998).
- (17) A. P. D. Love, D. N. Krizhanovskii, D. M. Whittaker, R. Bouchekioua, D. Sanvitto, S. A. Rizeiqi, R. Bradley, M. S. Skolnick, P. R. Eastham, R. André and Le Si Dang, “Intrinsic decoherence mechanisms in the microcavity polariton condensate,” Phys. Rev. Lett. 101, 067404 (2008).
- (18) V. Kohnle, Y. Léger, M. Wouters, M. Richard, M. T. Portella-Oberli and B. Deveaud, “Four-wave mixing excitations in a dissipative polariton quantum fluid,” Phys. Rev. B 86, 064508 (2012).
- (19) S. Kundermann, M. Saba, C. Ciuti, T. Guillet, U. Oesterle, J. L. Staehli and B. Deveaud, “Coherent Control of Polariton Parametric Scattering in Semiconductor Microcavities,” Phys. Rev. Lett. 91, 107402 (2003).
- (20) V. Ardizzone, P. Lewandowski, M. H. Luk, Y. C. Tse, N. H. Kwong, A. Lücke, M. Abbarchi, E. Baudin, E. Galopin, J. Bloch, A. Lemaitre, P. T. Leung, P. Roussignol, R. Binder, J. Tignon and S. Schumacher, “Formation and control of Turing patterns in a coherent quantum fluid,” Sci. Rep. 3, 3016 (2013).
- (21) P. Borri, W. Langbein, U. Woggon, A. Esser, J. R. Jensen and J. M. Hvam, “Biexcitons in semiconductor microcavities,” Semicond. Sci. Technol. 18, S351 (2003).
- (22) M. Saba, F. Quochi, C. Ciuti, U. Oesterle, J. L. Staehli, B. Deveaud, G. Bongiovanni and A. Mura, “Crossover from exciton to biexciton polaritons in semiconductor microcavities,” Phys. Rev. Lett. 85, 385 (2000).
- (23) X. Li, T. Zhang, C. N. Borca and S. T. Cundiff, “Many-Body Interactions in Semiconductors Probed by Optical Two-Dimensional Fourier Transform Spectroscopy,” Phys. Rev. Lett. 96, 057406 (2006).
- (24) S. T. Cundiff, T. Zhang, A. D. Bristow, D. Karaiskaj and X. Dai, “Optical two-dimensional fourier transform spectroscopy of semiconductor quantum wells,” Acc. Chem. Res. 42, 1423 (2009).
- (25) W. Langbein and B. Patton, “Heterodyne spectral interferometry for multi dimensional nonlinaer spectroscopy of individual quantum systems,” Opt. Lett. 31, 1151 (2006).
- (26) D. B. Turner and K. A. Nelson, “Coherent measurements of high-order electronic correlations in quantum wells,” Nature 466, 1089 (2010).
- (27) J. Kasprzak, B. Patton, V. Savona and W. Langbein, “Coherent coupling between distant excitons revealed by two-dimensional nonlinear hyperspectral imaging,” Nature Photon. 5, 57 63 (2011).
- (28) C. R. Hall, J. O. Tollerud, H. M. Quiney and J. A. Davis, “Three-dimensional electronic spectroscopy of excitons in asymmetric double quantum wells,” New J. Phys. 15, 045028 (2013).
- (29) P. Dey, J. Paul, J. Bylsma, S. Deminico and D. Karaiskaj, “Continuously tunable optical multidimensional Fourier-transform spectrometer,” Rev. Sci. Instrum. 84, 023107 (2013).
- (30) L. Yang, T. Zhang, A. D. Bristow, S. T. Cundiff and S. Mukamel, “Isolating excitonic Raman coherence in semiconductors using two-dimensional correlation spectroscopy,” J. Chem. Phys. 129, 234711 (2008).
- (31) A. D. Bristow, T. Zhang, M. E. Siemens, S. T. Cundiff and R. P. Mirin, “Separating homogeneous and inhomogeneous line widths of heavy-and light-hole excitons in weakly disordered semiconductor quantum wells,” J. Phys. Chem. B 115, 5365 (2011).
- (32) P. Wen, G. Christmann, J. J. Baumberg and K. A. Nelson, “Influence of multi-exciton correlations on nonlinear polariton dynamics in semiconductor microcavities,” New J. Phys. 15, 025005 (2013).
- (33) F. Albert, K. Sivalertporn, J. Kasprzak, M. Strau , C. Schneider, S. H fling, M. Kamp, A. Forchel S. Reitzenstein, E.A. Muljarov and W. Langbein, “Microcavity controlled coupling of exciton qubits,” Nature Comms. 4, 1747 (2013).
- (34) A. D. Bristow, D. Karaiskaj, X. Dai, T. Zhang, C. Carlsson, K. R. Hagen, R. Jimenez and S. T. Cundiff, “A versatile ultrastable platform for optical multidimensional Fourier-transform spectroscopy” Rev. Sci. Instrum. 80, 073108 (2009).
- (35) D. M. Whittaker, P. Kinsler, T. A. Sisher, M. S. Skolnick, A. Armitage, A. M. Afshar, M. D. Sturge and J. S. Roberts, “Motional narrowing in semiconductor microcavities,” Phys. Rev. Lett. 77, 4792 (1996).
- (36) A. D. Bristow, D. Karaiskaj, X. Dai and S. T. Cundiff, “All-optical retrieval of the global phase for two-dimensional Fourier-transform spectroscopy,” Opt. Express 16, 18017 (2008).
- (37) M. E. Siemens, G. Moody, H. Li, A. D. Bristow and S. T. Cundiff, “Resonance lineshapes in two-dimensional Fourier transform spectroscopy,” Opt. Express 18, 17699 (2010).
- (38) C. Ell, J. Prineas, T. R. Nelson Jr., S. Park, H. M. Gibbs, G. Khitrova, S. W. Koch and R. Houdré, “Influence of structural disorder and light coupling on the excitonic response of semiconductor microcavities,” Phys. Rev. Lett. 80, 4795 (1998).
- (39) A. D. Bristow, D. Karaiskaj, X. Dai, R. P. Mirin and S. T. Cundiff, “Polarization dependence of semiconductor exciton and biexciton contributions to phase-resolved optical two-dimensional Fourier-transform spectra,” Phys. Rev. B 79, 161305(R) (2009).
- (40) W. Langbein, J. M. Hvam, M. Umlauff, H. Kalt, B. Jobst and D. Hommel, “Binding-energy distribution and dephasing of localized biexcitons,” Phys. Rev. B 55, R7383(R) (1997).
- (41) G. Moody, R. Singh, H. Li, I. A. Akimov, M. Bayer, D. Reuter, A. D. Wieck, A. S. Bracker, D. Gammon and S. T. Cundiff, “Influence of confinement on biexciton binding in semiconductor quantum dot ensembles measured with two-dimensional spectroscopy,” Phys. Rev. B 87, 041304(R) (2013).
- (42) G. Khitrova, H. M. Gibbs, M. Kira, S. W. Koch and A. Scherer, “Vacuum Rabi splitting in semiconductors,” Nature Phys. 2, 81 (2006).
- (43) E. Giacobino, J.-P. Karr, G. Messin, H. Eleuch and A. Baas, “Quantum optical effects in semiconductor microcavities,” C. R. Phys. 3, 41 (2002).