Magnetic properties and complex magnetic phase diagram in non centrosymmetric EuRhGe3 and EuIrGe3 single crystals
Abstract
We report the magnetic properties of two Eu based compounds, single crystalline EuIrGe3 and EuRhGe3, inferred from magnetisation, electrical transport, heat capacity and 151Eu Mössbauer spectroscopy. These previously known compounds crystallise in the non-centrosymmetric, tetragonal, , BaNiSn3-type structure. Single crystals of EuIrGe3 and EuRhGe3 were grown using high temperature solution growth method using In as flux. EuIrGe3 exhibits two magnetic orderings at = 12.4 K, and = 7.3 K. On the other hand EuRhGe3 presents a single magnetic transition with a = 12 K. 151Eu Mössbauer spectra present evidence for a cascade of transitions from paramagnetic to incommensurate amplitude modulated followed by an equal moment antiferromagnetic phase at lower temperatures in EuIrGe3, the transitions having a substantial first order character. On the other hand the 151Eu Mössbauer spectra at 4.2 and 9 K in EuRhGe3 present evidence of a single magnetic transition. In both compounds a superzone gap is observed for the current density [001], which enhances with transverse magnetic field. The magnetisation measured up to 14 T shows the occurrence of field induced transitions, which are well documented in the magnetotransport data as well. The magnetic phase diagram constructed from these data is complex, revealing the presence of many phases in the phase space.
pacs:
75.50.Ee, 81.10.Fq, 81.10.-h , 75.30.Gw, 76.80.+y, 75.25.-j, 72.15.GdI Introduction
The magnetic properties of several Eu-based compounds with composition Eu, where is a -block transition element and = Si or Ge, have been reported in literature Neeraj_EuPtSi3 ; Neeraj_EuPtGe3 ; Kaczorowski_EuPdGe3 ; Goetsch_EuNiGe3 ; Arvind_EuNiGe3 ; Oleksandr_EuTGe3 . These compounds crystallize in the non-centrosymmetric (NCS) BaNiSn3 -type structure. A transition from paramagnetic to an incommensurate, amplitude modulated antiferromagnetic state followed by a second transition to a full-moment, antiferromagnetic configuration in EuPtSi3 Neeraj_EuPtSi3 and EuNiGe3 Arvind_EuNiGe3 was inferred from heat capacity and 151Eu Mössbauer spectroscopy. Magnetisation data on a single crystal of EuPtSi3 showed the presence of anisotropy, probably of both crystalline and exchange origin. Only one magnetic transition is observed in EuPtGe3 and EuPdGe3 Neeraj_EuPtGe3 ; Kaczorowski_EuPdGe3 . Further, magnetisation data on a single crystal of EuNiGe3 showed that while the -plane is the hard plane, an unusual staircase-like behavior of magnetisation is observed along the -axis Arvind_EuNiGe3 . Thus, a variety of interesting magnetic behaviour is observed in Eu compounds. The magnetisation in the antiferromagnetic state showing a varying degree of anisotropy which is a priori surprising for a spin-only ( = 7/2; = 0) ion like Eu2+.
The existence of iso-structural EuIrGe3 and EuRhGe3 is known and it was of interest to study the magnetic behaviour of these two compounds. We have probed the detailed magnetic properties of single crystalline EuIrGe3 and EuRhGe3 by magnetisation, resistivity and heat capacity in zero and applied fields, and 151Eu Mössbauer spectroscopy. While this work was in progress, the magnetic properties of single crystalline EuIrGe3 and EuRhGe3 have been reported in literature based on susceptibility measured in a field of 0.1 T, zero-field electrical resistivity and heat capacity Oleksandr_EuTGe3 . Our main observations are in agreement with the results reported in ref. Oleksandr_EuTGe3, ; however, our more extensive data include isothermal magnetisation at selected temperatures, susceptibility measured at a number of applied fields, magnetoresistivity, construction of magnetic phase diagram, observation of the superzone gap at the antiferromagnetic transition and 151Eu Mössbauer spectra. In addition, we also prepared LaRhGe3 and LaIrGe3 as non-magnetic reference compounds and measured their heat capacity and electrical resistivity.
II Experimental
Polycrystalline samples of EuIrGe3 and EuRhGe3 were first prepared by melting Eu (99.9 % purity), Ir/Rh (99.99 %) and Ge (99.999 %) in an arc furnace under an inert atmosphere of argon. The alloy buttons were flipped over three times and re-melted to ensure proper homogenization. An excess of about 10 % over the stoichiometric amount was taken for Eu, to compensate the weight loss due to the evaporation of Eu. Initially, we attempted to grow the single crystals of these compounds by using Sn as a solvent as that choice had proved successful for EuPtSi3 and EuPtGe3, but it did not give desired results. In the second attempt, charges of EuIrGe3 and EuRhGe3 and In (as solvent) were taken in the weight ratio 1:8; placed together in separate alumina crucibles and sealed in quartz ampoules under a partial pressure of 10-6 mbar. The sealed crucibles were placed in a box type resistive heating furnace and heated to at a rate of /hour. After a soaking period of 24 hours, a cooling rate of /hour was employed down to . The cooling rate was increased to /hour below . The single crystals of EuIrGe3 and EuRhGe3 were separated from In-flux by centrifugation. Small traces of indium were washed away by etching the grown crystals in dilute hydrochloric acid. Polycrystalline samples of non-magnetic reference LaIrGe3 and LaRhGe3 were prepared by the standard technique of arc melting as described above. The magnetisation as a function of field (up to 14 T) and temperature (1.8 to 300 K) was measured using Quantum Design Magnetic properties measurement system (MPMS) and Vibration sample magnetometers (VSM). The electrical resistivity between 1.8 and 300 K and the heat capacity in zero and applied fields was measured in a Quantum Design Physical properties measurement system (PPMS) unit. 151Eu Mössbauer spectra were recorded at various temperatures using a constant acceleration spectrometer with a 151SmF3 source. Laue diffraction patterns were recorded on a Huber Laue diffractometer fitted with an image plate, while powder-diffraction spectra were recorded on a Philips PANalytical set up using Cu-K radiation. The crystals were cut by spark erosion electric discharge machine and oriented along the desired planes using a triple axis goniometer and Laue diffraction in the back reflection mode.
III Results and Discussion
III.1 Structure
Well faceted crystals having a platelet geometry and typical dimensions of 5mm x 5mm x 1mm were obtained after centrifuging out the In solvent. The composition of the crystals was confirmed using electron dispersive analysis by x-rays (EDAX). The powder x-ray diffraction spectra, obtained by crushing a few single crystals to powder, could be indexed to tetragonal BaNiSn3 -type structure.
| (Å) | (Å) | (Å3) | |
|---|---|---|---|
| EuRhGe3 | 4.407(3) | 10.068(7) | 195.57(7) |
| EuIrGe3 | 4.430(0) | 10.041(6) | 197.06(5) |
The lattice parameters obtained by the Rietveld analysis of the powder diffraction spectra using FullProf software package Carvajal are listed in Table 1; and are in good agreement with the previously reported values Oleksandr_EuTGe3 ; Venturini .
III.2 Magnetisation
The inverse susceptibility, , of EuIrGe3, between 1.8 and 300 K, with the magnetic field (0.1 T) applied parallel to [100] and [001] directions, respectively, is shown in the inset of Fig. 1. The fit of Curie-Weiss expression to between 100 and 300 K provides the following parameters: = 7.94 and 7.65 , and = -22.1 and -13.7 K for [100] and [001], respectively. The value of along [100] matches exactly with the Hund’s rule derived value. An antiferromagnetic interaction between the divalent Eu ions is inferred from the negative values of along the two directions. The susceptibility below 20 K is shown in the main panel of Fig. 1. There is a cusp at = 12.4 K typical of antiferromagnetic ordering, followed by a mild shoulder at 7.3 K for [001].
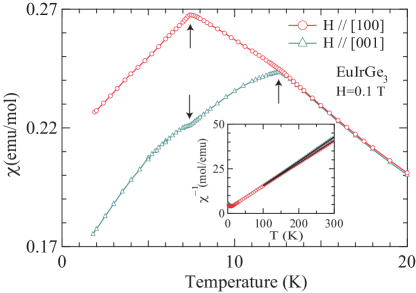
On the other hand for [100] there is a very subtle change of slope observed at 12.4 K and a very clear cusp is observed at 7.3 K. The main features of the susceptibility in the magnetically ordered state are in good agreement with those reported in ref. Oleksandr_EuTGe3, . For a collinear bipartite antiferromagnet, the susceptibility below is temperature independent along the magnetic hard axis while it gradually decreases to zero along the easy axis as the temperature is lowered to zero. In the present case the decreases along both [001] and [100] indicating a magnetic configuration which is different from simple collinear bipartite antiferromagnetic. The is comparable to for [001] but it is smaller in relation to for [100]. The latter may be due to the existence of ferromagnetic exchange interaction between the Eu ions at second near neighbour distance along [100], indicating a relatively complex magnetic structure. It may be mentioned here that in ref. Oleksandr_EuTGe3, a single value of -17 K is reported.
The magnetisation, , along [100] and [001] was measured in various fields ranging from 0.5 to 6 T and the data below 15 K are shown in Fig. 2. Additional features appear as the field is increased above 0.1 T.
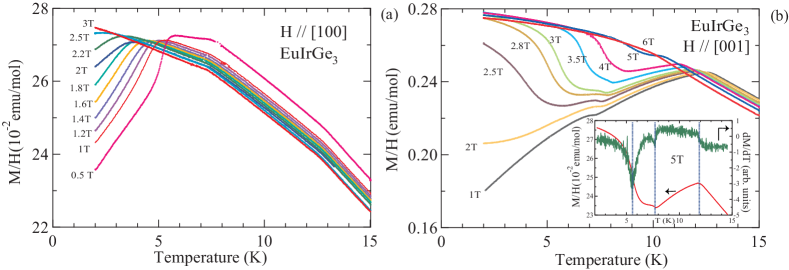
At 0.5 T, ( [100]) shows a knee near 5.5 K, which shifts to lower temperatures as the field is increased and either vanishes at H = 3 T or occurs below 1.8 K. The anomalies at 12.4 K and 7.3 K also shift slightly to lower temperatures with increasing field. For [001], the magnetisation between 2.5 and 4 T shows a prominent upturn at low temperatures, indicating a field-induced change in the direction of the magnetic moments. The mild shoulder at 7.3 K shifts to higher temperatures with increasing field while the peak at 12.4 K (in 0.1 T field) shifts to lower temperatures. The two appear to merge in a field of 6 T. At high fields, 3 T and above, the magnetisation at temperatures approaching 1.8 K is comparable for both the directions. These plots show that the configuration of the Eu moments in the magnetically ordered regime is modified by the applied field. The critical points derived from have been included while constructing phase diagram in Fig. 12.
The magnetisation at selected temperatures for [100] and [001] in applied fields up to 14 T is shown in Figs. 3a and 3b, respectively. In the inset of Fig. 3a the data at 1.8 K along the two directions are plotted. Above 3 T and between 3 and 8 T, the magnetisations at 1.8 K along the two directions virtually overlap (in conformity with the data discussed above) and then slightly bifurcate at higher fields. A spin-flop like behaviour is clearly seen near 2 T for [001] (which shifts upward in field as the temperature is increased (see, Fig. 3b) and eventually vanishes at 8 K, while it is barely discernible along [100] occurring at 1.5 T.
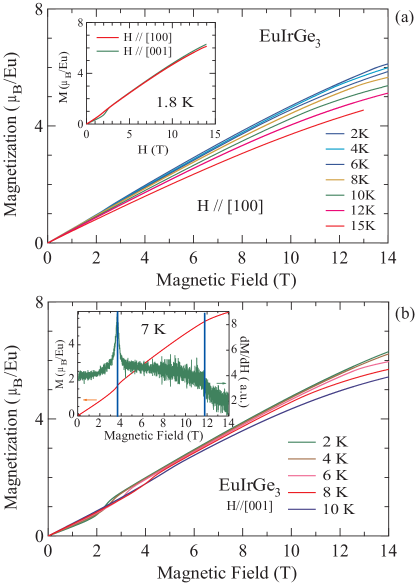
Though the variation of the magnetisation with field and temperature is consistent with the antiferromagnetic nature of the magnetic transition in EuIrGe3, it is not possible to infer the easy and the hard axis of magnetisation. For a collinear two-sublattice antiferromagnet, the magnetisation should be zero below the spin-flop field along the easy axis, but such a behaviour is not seen. At 1.8 K the magnetisation at 14 T (6.3 /Eu) along [001] is slightly larger than (6.15 /Eu) along [100] and the saturation is not yet reached along both the directions. It appears that the spin-flip field at 1.8 K is nearly independent of the direction like in EuPtGe3, indicating a small anisotropy.
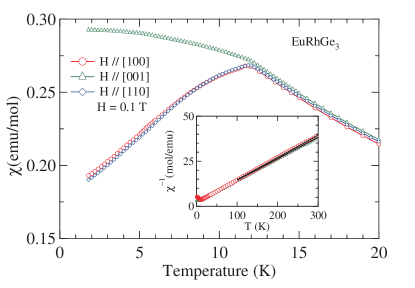
In contrast to EuIrGe3, the Rh analog shows only one antiferromagnetic transition which occurs close to = 12 K in applied field of 0.1 T (see, Fig. 4), in accordance with Ref. Oleksandr_EuTGe3, . Fig. 4 shows the data below 20 K for [100], [110] and [001], respectively. It is noticed that the response in the -plane is isotropic. Above 100 K, the inverse susceptibility fits well to the Curie-Weiss law with the values: = 7.56 and 7.78 , = -7 and -11 K for [100] and [001] respectively. It is likely that the value of is slightly lower due to the presence of tiny inclusions of In metal in the crystal which get incorporated during the crystal growth. As a result the amount of Eu used in the calculation of is actually slightly overestimated. We infer the presence of In from the slight drop in the susceptibility measured in an applied field of 0.005 T near the superconducting transition temperature of In. The drop vanishes when the applied field is increased to 0.05 T. From the susceptibility plots below one can infer that the hard axis of magnetisation is aligned close to [001] direction.
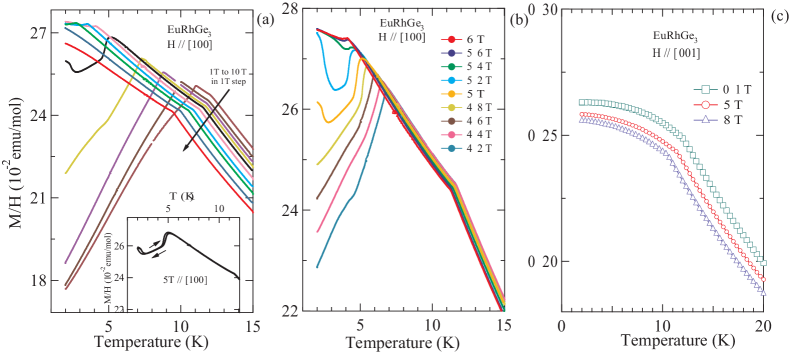
At higher fields applied parallel to [100] the transition shifts to lower temperatures reaching 9.4 K in 10 T (see, Fig. 5a). An additional peak which occurs close to 11 K in 1 T gradually shifts to 2.8 K in 8 T. Between 4 and 6 T, the magnetisation shows additional features below 5 K which are depicted in Fig. 5b. The field induced changes in the magnetic configuration have a first order character as indicated by the hysteresis observed at 5 T (see inset of Fig. 5a). The data depicted in Figs. 5a and 5b indicate a field induced complex phase diagram. On the other hand, for fields along the [001] direction the character of the plots remains unaltered except that decreases with field (see Fig. 5c). While our observations do not provide us the actual configuration of the magnetic moments, they appear to suggest a non collinear antiferromagnetic structure which evolves in a complex fashion for field applied in the -plane.
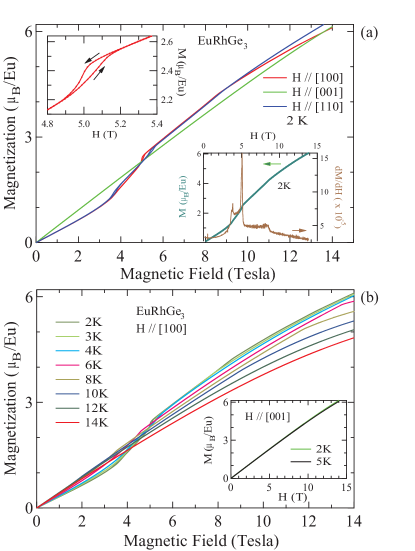
The main panel of Fig. 6a shows the isothermal magnetisation plots at 2 K for [100], [110] and [001]. The magnetisation along [100] at various temperatures is plotted in Fig. 6b; the inset shows the magnetisation at 2 and 5 K for [001].
Along [001] the magnetisation increases nearly linearly with the field reaching a value of 6.2 /Eu ion at 14 T. There is hardly any change in the magnetisation at 2 and 5 K(Fig. 6b inset). On the other hand one sees additional features for [100] and [110] with evidence of spin-flop transitions in 3-4 T range and near 5 T. Above 10 T the -plane isotropy of the magnetisation is slightly violated. At the highest field (14 T) the magnetisations along the three directions are nearly identical. A derivative plot of magnetisation for [100], , shown in the inset of Fig. 6a shows three peaks which are a signature of the field induced changes in the magnetic configuration. The magnetisation shows hysteresis around 5 T at 2 K (see, upper inset Fig. 6a) which correlates nicely with the data depicted in the inset of Fig. 5a. Temperature dependence of along [100] is shown in main panel of Fig. 6b.
III.3 Heat capacity
The specific heat measured down to 100 mK in zero field (Fig. 7a) confirms the presence of two transitions in EuIrGe3, at = 12.4 and = 7.2 K, in close correspondence with the low-field magnetisation data presented above. The magnitude of the jump in the heat capacity at , 5 J/mol K, which is far below the mean-field value of 20.14 J/mol K for a mol of spin = 7/2. This suggests that the transition at is from paramagnetic to amplitude modulated antiferromagnetic configuration. At the transition from this intermediate state to an equal moment antiferromagnetic configuration takes place, as confirmed by 151Eu Mössbauer spectra (see below).
The heat capacity was also measured in applied fields of 8 and 14 T with [100]. At 8 T, the two peaks at 7.2 and 12.4 K (zero field) have shifted slightly lower in temperature to 6.1 and 11 K, respectively, in correspondence with the magnetisation data shown in Fig. 2. The jump in the heat capacity is slightly reduced. At 14 T, there is only one peak at 7 K, with appreciable reduction in peak height. For [001], at 5 T both peaks come closer but are still well resolved; at higher fields we observe only a single peak in agreement with magnetic phase diagram in Fig 12b.
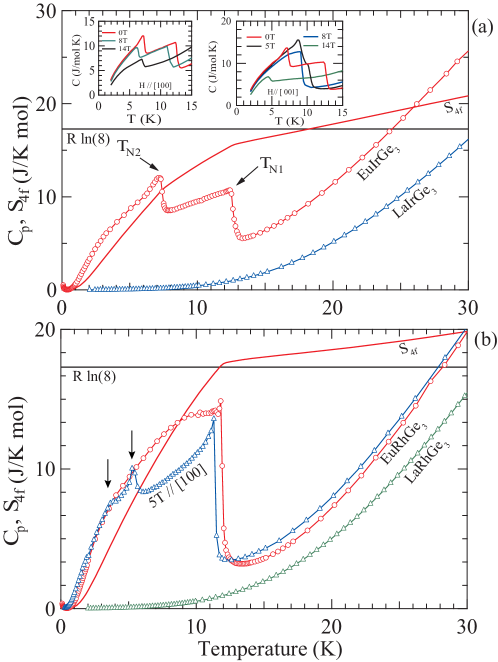
The heat capacity of the iso-structural LaIrGe3 is also plotted in Fig. 7a, and the contribution to the heat capacity, , and entropy were calculated under the assumption that the phonon heat capacities of LaIrGe3 and EuIrGe3 are identical, after normalization due to the slightly different atomic masses of La and Eu. The entropy attains the value of (for Eu2+ ions, = 7/2 and =0) near 18 K but keeps on increasing at higher temperatures, indicating a poor validity of the assumption of identical phonon spectra in LaIrGe3 and EuIrGe3 at least at higher temperatures. A similar situation was earlier encountered in EuPtSi3 Neeraj_EuPtSi3 . The vs. plot of LaIrGe3 is linear below 8 K, characterized by = 4.0 mJ/mol K2 and = 0.349 mJ/mol K4. A Debye temperature, of 303 K is inferred from .
The heat capacity data of EuRhGe3 measured in zero and 8 T ( [100]) are plotted in Fig. 7b. The relatively sharp jump in the heat capacity near 12 K in zero field is in excellent agreement with the magnetisation data discussed above. Surprisingly, the jump in the heat capacity at in EuRhGe3 is about 13 J/mol K, which is far below the value for a transition to an equal moment antiferromagnetic state (20.14 J/mol K) in the mean field model Blanco . It may be noted that the shape of the heat capacity variation below TN is rather unusual and similar to some cases of amplitude modulated moment state described in Fig.5 in ref. Blanco, . In applied fields the magnetic transition shifts to lower temperatures and additional peaks, marked by downward arrows in Fig. 7 for 5 T data are observed, in conformity with the in-field magnetisation data (Fig. 5) described above. The heat capacity of non-magnetic, reference analogue LaRhGe3 is also plotted. The entropy was estimated using the method mentioned above. It again exceeds the maximum value of Rln8 like in the Ir compound. For LaRhGe3, = 6.7 mJ/mol K2 and = 0.376 mJ/mol K4. A Debye temperature, of 296 K is inferred from , which is close to that of the Ir compound.
III.4 Electrical Resistivity
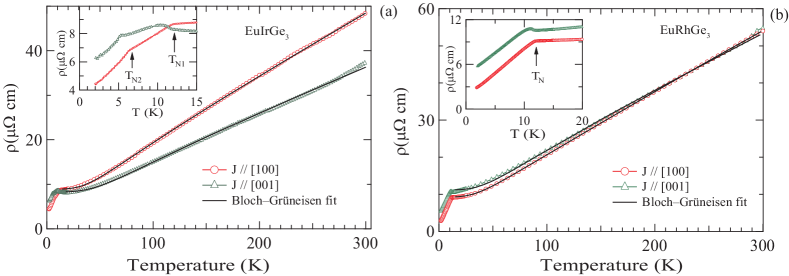
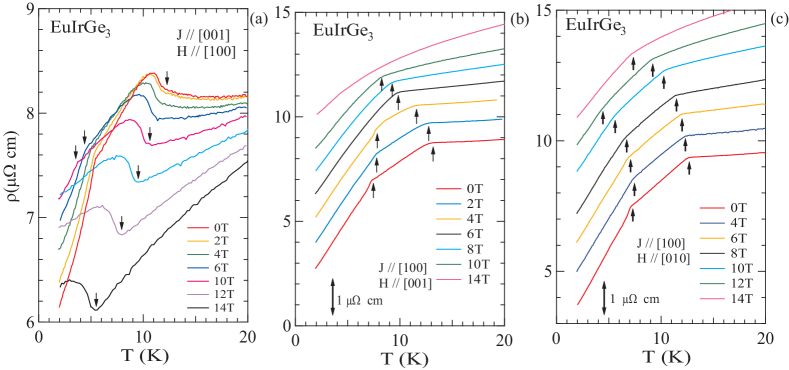
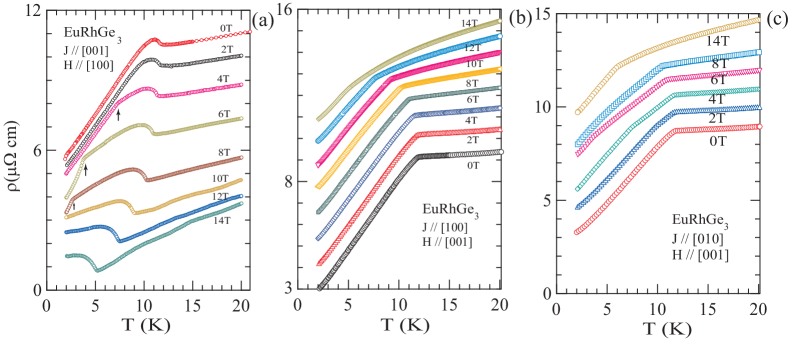
The electrical resistivity of EuIrGe3 and EuRhGe3 with the current density parallel to [100] and [001], respectively is shown in Fig. 8. The resistivity shows anomalies for EuIrGe3 at the two transitions and along both directions though with slightly different characteristics. Along [100] the resistivity decreases faster at each transition due to the rapid reduction in of the spin-disorder scattering. Above the resistivity monotonically increases up to the room temperature. On the other hand, for [001] at there is a slight upturn on cooling. The upturn at is suggestive of a gap-opening at the Fermi surface along [001] direction with AFM order, often referred as superzone gap. Many other rare earth intermetallics have been found to show this kind of behaviour.Pranab_CeGe ; Anand_EuPd2As2 ; Hossain
The electrical resistivity of EuRhGe3 has some similarities with that of EuIrGe3 described above. For [100] the resistivity decreases at the single antiferromagnetic transition, while for [001] the initial increase at (= 12 K) again indicates the opening of a superzone gap like in EuIrGe3.
We have fitted the Bloch Grüneisen expression to our data in the paramagnetic region given by following expression:
| (1) |
where is the Debye temperature determined from the data, is the temperature independent part of resistivity comprising of electron scattering caused by crystal imperfection and spin disorder in paramagnetic state. is a material dependent prefactor. Parameters determined from the fit are listed in Table 2. It may be noted that the magnitude of is different from . This is not unusual as considers only the longitudinal lattice vibrations.
| EuRhGe3 | EuIrGe3 | |||
|---|---|---|---|---|
| cm) | cm) | |||
| [100] | ||||
| [001] | ||||
The transverse magnetic field dependence of electrical resistivity under different configurations is shown in Fig. 9 and 10 for EuIrGe3 and EuRhGe3, respectively. The main features in the data of both compounds are in excellent correspondence with the magnetic susceptibility data. The upturn in the resistivity at TN becomes more prominent as the field is increased (see, Fig. 9a and 10a), suggesting an enhancement of the superzone gap in the two compounds.
The magnetoresistivity , defined as of EuIrGe3 for diffrent transverse configurations is shown in Figs. 11(a-c). For [001], [010] and [100] at T = 2 K, the is positive, increases rapidly with field and shows a minor anomaly near 2 T which corresponds well with the spin-flop transition seen in the magnetisation. The positive is typically expected in an antiferromagnet as the field disrupts the antiferromagnetic ordered state. The positive peaks near 12 T and then decreases slightly, indicating the proximity of the spin-flip field around 14 T. As the temperature is raised (see, Fig. 10c) the minor anomaly shifts to higher fields tracking the corresponding increase in the spin-flop transition field in the magnetisation, and the magnitude of positive decreases due to the increase of temperature. At 6 K the becomes negative for 10 T, and the crossover field value decreases with further increase of temperature. At 15 K the in the paramagnetic state is negative at all fields, most likely due to the ordering effect of the field on the fluctuating moments.
The for [010] shows qualitatively similar field dependence (see, FIg. 10b) as described above for [001]. The anomalies observed in data are included in phase diagram corresponding well to the magnetisation data.
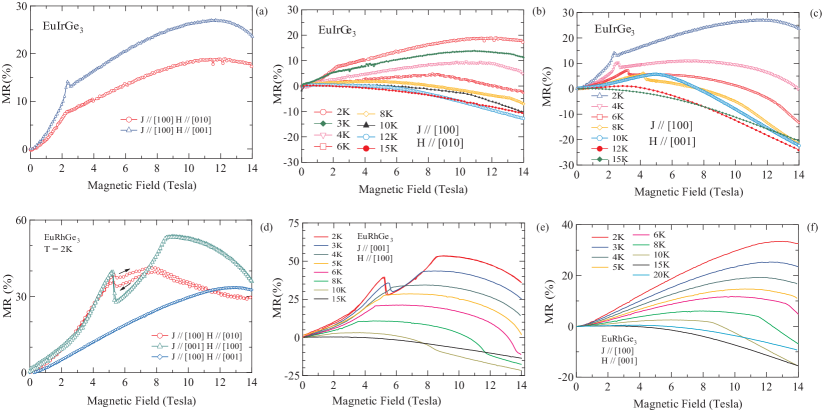
The of EuRhGe3 at selected temperatures is shown in Figs 11(d-f). Fig. 11d shows a comparison between data taken at 2 K in different configurations. The nature of curves is dependent upon the field direction as well as the direction of current density . For [100] and [001] the at 2 K is positive and initially increases with field. It shows anomalies at 5 and 8.5 T which mirror the spin-flop transitions seen in the magnetisation at these fields (Fig.5b). Above 8.5 T the is still positive but begins to decline in its absolute values most likely due to the increasing alignment of the moments along the field direction as the spin-flip field is approached. As the temperature is increased the two anomalies approach each other, shifting in opposite directions, and above 4-5 K they apparently merge and then the single anomaly shifts to lower fields with increasing temperature (see, Fig. 11e). At 6 K, the shows an anomaly in 13-14 T range which shifts to 11-12 and 8-9 T intervals at 8 and 10 K, respectively. This feature matches well with the magnetisation plots measured at these temperatures (indicated by arrows in Fig. 6b). In the paramagnetic region (15 and 20 K) the is negative. Lastly, the data for [001] and [100] are shown in Fig. 11f. It may be recalled that [001] is relatively the hard-axis of magnetisation in EuRhGe3. The up to 5 K is positive, increasing with field and showing a slight decline above 12 T. At 8 and 10 K the decline in is marked by a sharp knee at 11.5 and 9 T, respectively, which are phenomenologically similar to the one’s seen in Fig. 11e and occur at similar values of fields as well, and may have a similar origin. Again, the in the paramagnetic region is negative.
III.5 Magnetic phase diagram
From and data we have constructed the magnetic phase diagrams of EuRhGe3 and EuIrGe3 shown in Fig. 12. The conclusions derived from these two sets of data correspond very well with each other. AF1, AF2,… denote phases specified by different antiferromagnetic configurations. In EuRhGe3, at low fields a second transition appears which shifts to lower temperatures with increasing magnetic field until the occurrence of a tricitical point at (5 K, 4.9 T), followed by another tricritical point at (4 K, 5.4 T). Dotted lines are plausible extrapolations.
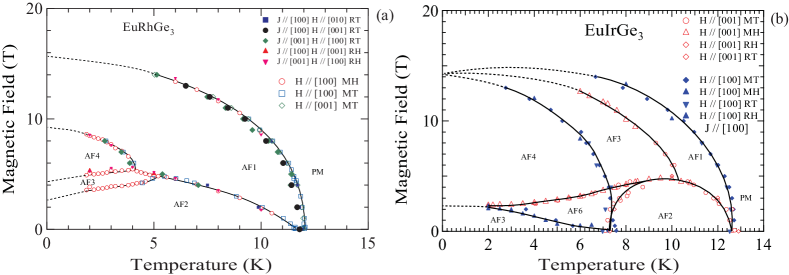
EuIrGe3 magnetic phase diagram also shows a similar degree of complexity. Here the red symbols have been used for points determined from [001] and blue symbols for [100] data, respectively for the vs , vs , vs and vs experiments. For [001], on increasing the field, and come closer and merge together accompanied with the appearance of other field induced transitions forming a closed dome centered around 10 K. Above 5 T we could observe only one transition along -axis. On the other hand, for field parallel to -axis and are suppressed, apparently merging at around 14.2 T at absolute zero. Interestingly, it looks that the high field phase for [001] seems to converge at the same point at 0 K as the merging point of two phase lines for [100]. An additional low field phase line nearly parallel to the temperature axis, having opposite curvatures for and axes but merging with each other at around 2 K are observed. It may be noted that the phase boundary between PM and AF1 phase is also a demarcation line for the superzone gap in both, EuRhGe3 and EuIrGe3.
III.6 151Eu Mössbauer spectra
The 151Eu Mössbauer spectra at 4.2, 8 and 12 K in EuIrGe3 are shown in Fig. 13. The 4.2 K spectrum is a regular hyperfine field pattern with = 28.9(2) T, indicating an equal moment magnetic ordering. At 8 K, the spectrum has to be fitted to a superposition of a commensurate and of an incommensurate pattern, and at 12 K, close to , to a superposition of an incommensurate pattern and of a single line characteristic of the paramagnetic phase.
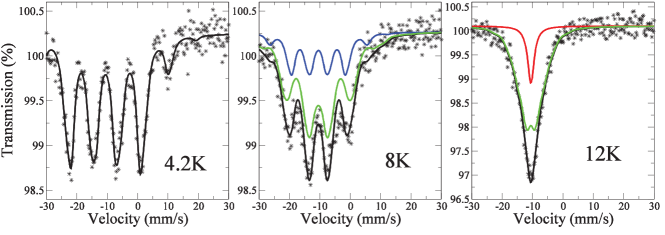
At 8 K and 12 K, the fits shown are probably not the unique solution because the two subspectra are not resolved. So they must be considered as indicative. The presence of two subspectra is however needed because fits with an incommensurate pattern alone yield unphysical modulations. One can conclude that the two transitions, from the paramagnetic to the incommensurate amplitude modulated phase and from the amplitude modulated to the equal moment phase, present a high degree of first order.
For EuRhGe3, the Mössbauer spectra recorded at 4.2 and 9 K, shown in Fig. 14, present evidence for a single magnetic transition. The 151Eu Mössbauer spectrum at 4.2 K is standard with a hyperfine field of 29.8 T.

Of the five compounds EuPtSi3, EuPtGe3, EuNiGe3, EuIrGe3 and EuRhGe3 in which the 151Eu Mössbauer data have been taken, with the exception of EuPtGe3 and EuRhGe3 the remaining compounds show a cascade of magnetic transitions, the intermediate phase being amplitude modulated. In EuPtGe3, where the magnetisation is rather isotropic, no intermediate phase is present and it was conjectured that multiple transitions may be linked to anisotropy Arvind_EuNiGe3 . The isothermal magnetisation of EuIrGe3 is rather similar to that of EuPtGe3, yet it shows a cascade of transitions. This shows that other factors are important. Neutron diffraction studies are required to find the antiferromagnetic configuration of the Eu moments in these compounds and its variation with temperature and field.
References
- (1) N. Kumar, S.K. Dhar, A. Thamizhavel, P. Bonville, P.Manfrinetti, Phys. Rev. B 81 (2010) 144414.
- (2) N. Kumar, P.K. Das, R. Kulkarni, A. Thamizhavel, S.K. Dhar, P. Bonville, J. Phys.: Condens. Matter 24 (2012) 036005.
- (3) D. Kaczorowski, B. Belan, R. Gladyshevskii, Solid State Commun. 152 (2012) 839.
- (4) R.J. Goetsch, V.K. Anand, D.C. Johnston, Phys. Rev. B 87 (2012) 064406.
- (5) A. Maurya, P. Bonville, A. Thamizhavel, S.K. Dhar, J. Phys.: Condens. Matter 26 (2014) 216001.
- (6) Oleksandr Bednarchuk, Anna Gagor, Darius Kaczorowski, J. Alloys Comp. 622 (2015) 432.
- (7) Juan Rodriguez-Carvajal, Physica B 192 (1993) 55.
- (8) G. Venturini,M. Méot-Meyer, B. Malaman, B. Roques, J. Less-Common Met. 113 (1985) 197.
- (9) J. A. Blanco, D. Gignoux, D. Schmitt, Phys. Rev. B 43 (1991) 13145.
- (10) N. Kumar, P.K. Das, N. Kumar, R. Kulkarni, S.K. Dhar, A. Thamizhavel, J. Phys.: Condens. Matter 24 (2012) 146003.
- (11) V. K. Anand, D. C. Jhonston, J. Phys.: Condens. Matter 26 (2012) 286002.
- (12) Z. Hossain, C. Geibel, N. Senthilkumaran, M. Deppe, M. Baenitz, F. Schiller, S. L. Molodtsov, Phys. Rev. B 69 (2004) 014422.