2Astrophysics, Cosmology and Gravity Centre, Department of Astronomy, University of Cape Town, Rondenbosch 7701, Republic of South Africa
3Department of Astronomy & Astrophysics, 525 Davey Laboratory, Pennsylvania State University, University Park, PA 16802, USA
4UK Astronomy Technology Centre, Royal Observatory Edinburgh Blackford Hill, Edinburgh, EH9 3HJ, UK
5Space Telescope Science Institute, 3700 San Martin Drive, Baltimore, MD, 21218, USA
6School of Physics & Astronomy, University of Southampton, Highfield, Southampton, S017 1BJ, UK
7Astronomical Institute Anton Pannekoek, University of Amsterdam, 1098 XH Amsterdam, The Netherlands
8Carnegie Institution for Science: The Observatories, 813 Santa Barbara St, Pasadena, CA 91101, USA
9TAPIR institute, California Institute of Technology, Pasadena, CA 91125, USA
10Astrophysics Research Centre, School of Mathematics and Physics, Queen’s University Belfast, Belfast BT7 1NN, UK
11Argelander Institut für Astronomie, Auf den Hügel 71, Bonn, 53121, Germany
12Departamento de Astrofísica, Centro de Astrobiología (INTA-CSIC), Campus ESA, Apartado Postal 78, 28 691 Villanueva de la Cañada, Madrid, Spain
13Department of Physics, Denys Wilkinson Building, Keble Road, Oxford, OX1 3RH, United Kingdom
14Warsaw University Observatory, A1. Ujazdowskie 4, 00-478, Warszawa, Poland
The VLT-FLAMES Tarantula survey XX. The nature of the X-ray bright emission line star VFTS 399 ††thanks: Based on observations collected at the European Southern Observatory under program ID 182.D-0222
Abstract
Context. The stellar population of the 30 Doradus star-forming region in the Large Magellanic Cloud contains a subset of apparently single, rapidly rotating O-type stars. The physical processes leading to the formation of this cohort are currently uncertain.
Aims. One member of this group, the late O-type star VFTS 399, is found to be unexpectedly X-ray bright for its bolometric luminosity - in this study we aim to determine its physical nature and the cause of this behaviour.
Methods. To accomplish this we performed a time-resolved analysis of optical, infrared and X-ray observations.
Results. We found VFTS 399 to be an aperiodic photometric variable with an apparent near-IR excess. Its optical spectrum demonstrates complex emission profiles in the lower Balmer series and select He i lines - taken together these suggest an OeBe classification. The highly variable X-ray luminosity is too great to be produced by a single star, while the hard, non-thermal nature suggests the presence of an accreting relativistic companion. Finally, the detection of periodic modulation of the X-ray lightcurve is most naturally explained under the assumption that the accretor is a neutron star.
Conclusions. VFTS 399 appears to be the first high-mass X-ray binary identified within 30 Dor, sharing many observational characteristics with classical Be X-ray binaries. Comparison of the current properties of VFTS 399 to binary-evolution models suggests a progenitor mass for the putative neutron star, which may host a magnetic field comparable in strength to those of magnetars. VFTS 399 is now the second member of the cohort of rapidly rotating ‘single’ O-type stars in 30 Dor to show evidence of binary interaction resulting in spin-up, suggesting that this may be a viable evolutionary pathway for the formation of a subset of this stellar population.
Key Words.:
stars:evolution - stars:early type - stars:individual:VFTS 3991 Introduction
Located within the Large Magellanic Cloud (LMC), the 30 Doradus complex is the most luminous H ii region in the Local Group. It contains OB stars, with star formation apparently commencing 25Myr ago and continuing to the present day (Walborn & Blades walborn97 (1997), Grebel & Chu grebel (2000), Walborn et al. walborn13 (2013)). Combined with a moderate line-of-sight extinction, 30 Dor therefore provides an exceptional opportunity to investigate the complete life-cycle of massive stars. In order to exploit this potential, a multi-epoch spectroscopic observing campaign - the VLT-FLAMES Tarantula Survey (VFTS) - was undertaken between 2008 October-2009 February; a full description of this investigation, including target list, observational strategy and data-reduction methods employed was presented by Evans et al. (evans (2011)).
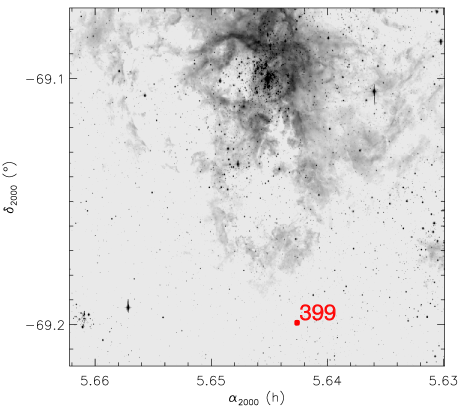
Fulfilling a design goal of the programme, the multi-epoch observations enabled the identification of both single and binary OB star populations (Sana et al. sana13 (2013)). Investigation of the single O-type stars revealed that the distribution of their rotational velocities has a two-component structure (Ramírez-Agudelo et al. oscar (2013)), comprising a low velocity peak (kms-1) and a high-velocity tail (extending to kms-1). The origin of the high velocity cohort is currently uncertain, with the relative contribution from natal and binary-driven channels still ill-constrained (de Mink et al. demink (2013), Ramírez-Agudelo et al. oscar (2013)). With a projected equatorial rotational velocity, sinkms-1 (Ramírez-Agudelo et al. oscar (2013)), the O9 IIIn star VFTS 399 is a member of this group (Walborn et al. walborn (2014)), while its location on the periphery of the 30 Dor complex (Fig. 1) is suggestive of a potential runaway nature (cf. Blaauw blaauw (1961)). Unexpectedly, cross correlation of the VFTS sample with the X-ray survey of Townsley et al. (townsley14 (2014)) revealed it to be both highly variable and, at its peak, one of the most X-ray luminous stars within 30 Dor. Motivated by these observational findings we report the results of a multi-wavelength analysis of VFTS 399 in order to clarify its nature, presenting the data in Sect. 2, utilising these to infer its physical properties in Sect. 3, discuss the implications of these findings in Sect. 4, before summarising our results in Sect. 5.
2 The observational properties of VFTS 399
2.1 Optical and IR properties
2.1.1 Photometry
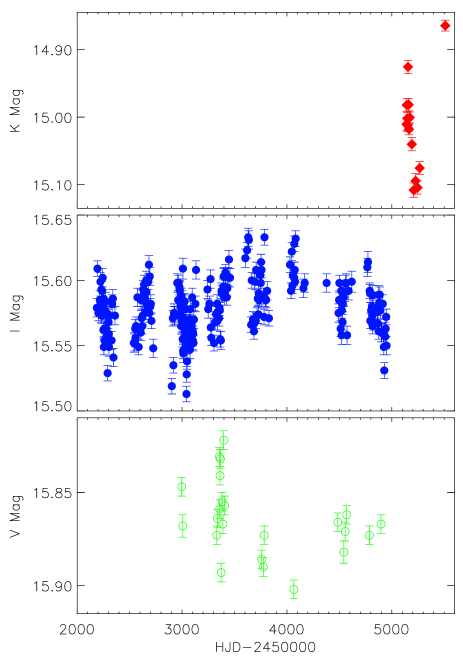
Evans et al. (evans (2011)) provided single-epoch optical and near-IR photometry of VFTS 399, which we present in Table 1. The latter are derived from the survey of the LMC by Kato et al. (kato (2007)), which were obtained on 2003 November 16. Earlier 2MASS magnitudes, obtained on 1998 March 19, are also available (Skrutskie et al. skrutskie (2006))111, and , noting the -band magnitude is flagged as uncertain. and are suggestive of variability (see below). Finally Spitzer SAGE observations (Meixner et al. meixner (2006)) obtained between 2005 July 15-26 and October 26-November 2 are also presented in Table 1.
VFTS 399 also lies within fields covered by the Optical Gravitational Lensing Experiment (OGLE-III; Udalski udalski (2003)) and VISTA-VMC (Cioni et al. cioni (2011)) surveys. Unfortunately, neither dataset coincides with the period over which spectroscopic observations were made but both clearly indicate that VFTS 399 is variable at the level of mag over timescales of days in the and -bands (Fig. 2). In the extensive band dataset the variability appears characterised by significant scatter superimposed on longer-term variability. The -band data are more sparsely sampled, but are suggestive of coherent variability over a day timescale. Preliminary analyses of the more extensive OGLE-III band dataset revealed a number of potential periodicities - e.g. and 720 days - although the later two appeared to result from the seasonality of the observations. Neveretheless, in order to assess the significance of all the periodicities we followed the methodology employed by Bird et al. (bird (2012))222A fast implementation of the Lomb-Scargle periodogram, with periods searched for ranging from 2 days (the Nyquist frequency) to 1000 days (dictated by the length of the lightcurve). A rolling-mean was further calculated for the lightcurve and was used to de-trend the data, with extensive Monte-Carlo simulations employed to determine the significance and associated errors of any periods detected. See Bird et al. (bird (2012)) for further details.. No coherent statistically-significant periods were identified for the complete dataset, while searches over subsets of these data also returned no convincing evidence for transient periodicity.
| [3.6] | [4.5] | |||||
|---|---|---|---|---|---|---|
| 15.91 | 15.83 |
2.1.2 Spectroscopy
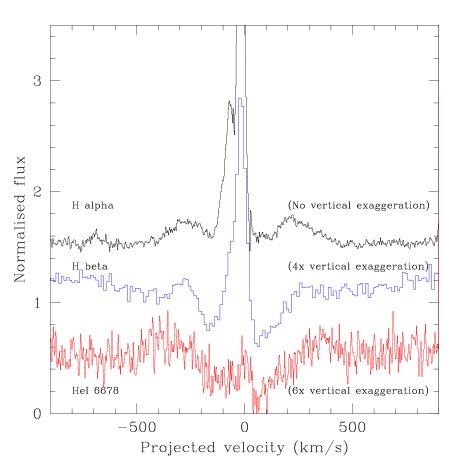
The VLT/FLAMES spectroscopy of VFTS 399 is summarised in Table 2 and the data-reduction techniques employed are fully described in Evans et al. (evans (2011)), noting that sky subtraction was accomplished utilising a median sky spectrum constructed from all the sky fibres of the frame that were uncontaminated by flux from bright stars. Walborn et al. (walborn (2014); their Fig. 10) presented the 3960-4750Å portion of the spectrum from which they assigned an O9 IIIn classification; for brevity we do not replicate this here, but do plot the H, H and He i 6678Å emission line profiles in Fig. 3.
All three lines demonstrate complex, morphologically similar profiles with pronounced high-velocity emission, of comparable intensity in both blue and red line wings and a strong, narrow component centred on the systemic velocity of VFTS 399. Similar, single-peaked emission at low projected velocities is also present in the photospheric profiles of the higher Balmer series and select He i lines (Walborn et al. walborn (2014)). Given the presence of spatially-variable nebular emission across 30 Dor we caution against the over interpretation of the profiles of the core components in these lines. Sky subtraction successfully removed the [N ii] 6547Å nebular line, but left small single-peaked residuals in the [N ii] 6584Å and [S ii] 6717+6730Å lines. Consequently we suspect that nebular contamination might also be present at low projected velocities in the H, H and He i 6678Å transitions. We discuss the physical interpretation of these profiles further in Sect. 3.
Ramírez-Agudelo et al. (oscar (2013)) determined sinkms-1 from the LR02 and LR03 spectra, while Sana et al. (sana13 (2013)) utilised the multi-epoch nature of the dataset to search for radial velocity (RV) shifts. They found that VFTS 399 demonstrated epoch-to-epoch RV shifts with a peak-to-peak amplitude of kms-1. Given the magnitudes of the observational uncertainties (Table 2), this is significant at the level, meaning that VFTS 399 fell below the conservative threshold set by these authors for classification as a binary. We return to this issue in Sect. 3.1, noting that these observations also yield a mean RV value of kms-1.
| Mode + | -coverage | Date | RV | |
|---|---|---|---|---|
| Setting | (Å) | (km s-1) | ||
| Medusa LR02 | 3960-4564 | 7000 | 22/12/08 | |
| 24/12/08 | ||||
| 27/01/09 | ||||
| 17/02/09 | ||||
| 07/10/09 | ||||
| Medusa LR03 | 4499-5071 | 8500 | 20/12/08 | |
| 21/12/08 | ||||
| 22/12/08 | ||||
| Medusa HR15N | 6442-6817 | 16000 | 18/12/08 | - |
| 19/12/08 | - |
The He ii 4200Å, He i 4387Å and He ii 4541Å transitions were employed for determination with Medusa LR02 observations, and He i 4713Å and He i 4922Å with Medusa LR03. Note the LR02 and LR03 observations made on 2008 Dec. 22 were separated by mins.
2.2 X-ray properties
Fortuitously, VFTS 399 has been the subject of a number of X-ray observations spanning years. Both XMM-Newton (XMMU J053833.9-691157; Shtykovskiy & Gilfanov shtyk (2005)) and Chandra (CXOU J053833.4-691158 = [TBF2006] 27; Townsley et al. townsley06 (2006)) provide X-ray point source detections that may be associated with VFTS 399. Utilising data from 2001 November 19, the former study quotes erg s-1, assuming a power law spectrum with photon index, and cm-2. The latter study utilised a ks observation from 1999 September and returned erg s-1 following a power law fit with and cm-2.
Subsequently, further Chandra observations were made on 2006 January 21, 22 and 30 (Townsley et al. townsley14 (2014)). VFTS 399 is also located within the target field of the current Ms T-ReX Chandra programme (PI: L. Townsley) which runs through 2015; consequently we appraised the multiple additional observations available to us at the time of writing (Table 3), deferring an analysis of the full data set for a future paper.
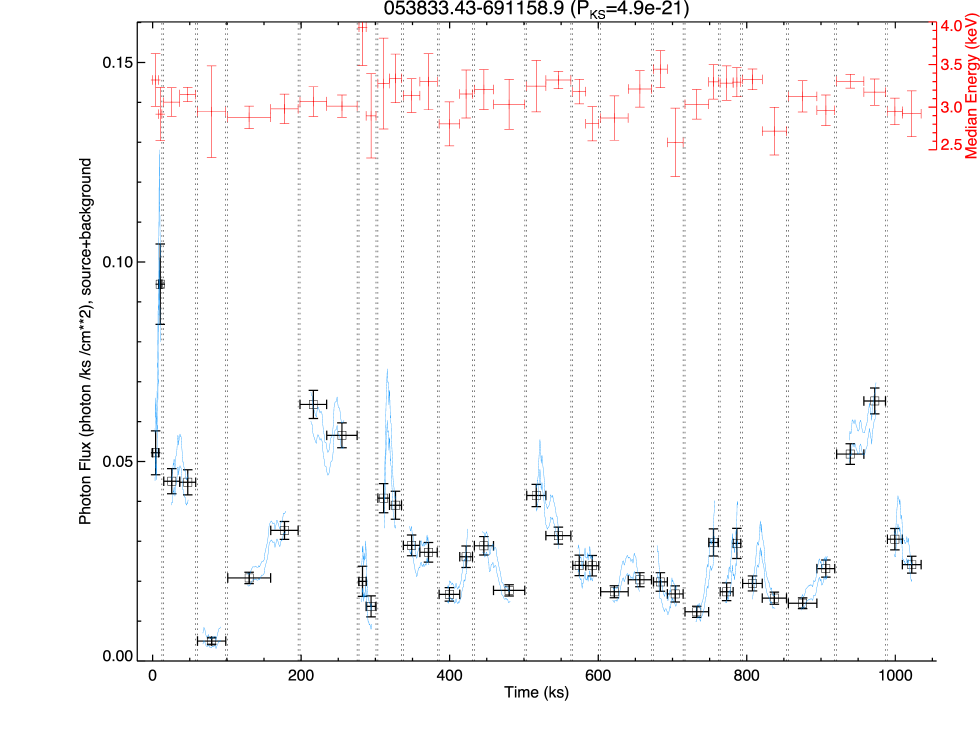
VFTS 399 was detected in each observation and was found to be well separated from other X-ray sources. The resultant lightcurve is presented in Fig. 4 and it is immediately apparent that the source is highly variable, even within a single observational segment. In order to screen for variability in the gross morphological properties of the spectra we determined the median event energy for individual observations (Fig. 4). This metric shows no evidence for spectral variability across this observational sequence. In order to consolidate this finding we analysed the first eight epochs of data which, when taken together, appear representative of the whole dataset inasmuch as they fully sample the full dynamical range found for VFTS 399 (erg s-1). Furthermore, excluding the 1999 data due to calibration issues, we also summed all remaining observations to produce a single, high S/N spectrum which we treated in the same manner.
Specifically, we first subtracted a background spectrum (corresponding to % of the extracted 0.5-8.0keV X-ray counts) before several different models within xspec (Arnaud arnaud (1996)) were employed in an attempt to fit these data. A simple absorbed power-law (tbvarabs∗pow) with was found to provide the best fit (Fig. 5): parameters returned for this model upon application to the summed spectrum were , cm-2 (corresponding to mag, suggestive of significant obscuration intrinsic to VFTS 399) and an absorption corrected erg s-1.
The results obtained from analysis of the first eight individual epochs are presented in Table 4; this yielded a range of parameters spanning , cm-2 and erg s-1. For epochs with very few counts and were held at the value determined from the summed spectrum, with only the normalisation allowed to vary. We caution that fits are provided for epochs as a whole and hence do not account for the variable behaviour of the source over the course of a given observation (cf. Fig. 4). Moreover, while some datasets are fitted by this simple model, others are not; this likely indicates deficiencies in the model, but the low count rate precludes more sophisticated treatments at this stage. Nevertheless, we conclude that there is no evidence for evolution of the gross morphological properties of the X-ray spectrum of VFTS 399 over the course of the observations.
| Obs. ID | Start Time | Exposure (s) |
|---|---|---|
| 5906 | 2006-01-21T19:04 | 12317 |
| 7263 | 2006-01-22T16:51 | 42528 |
| 7264 | 2006-01-30T15:06 | 37593 |
| 16192 | 2014-05-03T04:10 | 93760 |
| 16193 | 2014-05-08T10:15 | 75993 |
| 16612 | 2014-05-11T02:15 | 22672 |
| 16194 | 2014-05-12T20:00 | 31335 |
| 16615 | 2014-05-15T08:24 | 45170 |
| 16195 | 2014-05-24T14:09 | 44405 |
| 16196 | 2014-05-30T00:05 | 67109 |
| 16617 | 2014-05-31T01:27 | 58860 |
| 16616 | 2014-06-03T22:26 | 34529 |
| 16197 | 2014-06-06T12:32 | 67802 |
| 16198 | 2014-06-11T20:20 | 39465 |
| 16621 | 2014-06-14T14:46 | 44399 |
| 16200 | 2014-06-26T20:01 | 27360 |
| 16201 | 2014-07-21T22:13 | 58393 |
| 16640 | 2014-07-24T11:21 | 61679 |
| 16202 | 2014-08-19T15:30 | 65128 |
| 17312 | 2014-08-22T06:21 | 44895 |
| ObsID | Date | Exposure | Net | Normalisation | /DoF | log | ||
|---|---|---|---|---|---|---|---|---|
| (s) | Counts | ( cm-2) | photons cm-2 s-1 keV | (ergs-1) | ||||
| Summed | - | 975400 | 5397 | 125.5/115 | 34.7 | |||
| 5906 | 21/01/06 | 12320 | 175 | 4.8/8 | 35.1 | |||
| 7263 | 22/01/06 | 42528 | 407 | 24.1/23 | 34.9 | |||
| 7264 | 30/01/06 | 37593 | 40 | 2.7 | 1.0 | 6.7/9 | 34.0 | |
| 16192 | 03/05/14 | 93760 | 419 | 29.6/24 | 34.7 | |||
| 16193 | 08/05/14 | 75996 | 657 | 38.6/38 | 35.0 | |||
| 16612 | 11/05/14 | 22678 | 54 | 2.7 | 1.0 | 9.8/7 | 34.4 | |
| 16194 | 12/05/14 | 31335 | 238 | 2.7 | 30.6/13 | 34.8 | ||
| 16615 | 15/05/14 | 45170 | 237 | 6.4/12 | 34.7 |
Summary of the X-ray model parameters for the summed spectrum (top row) and the individual spectra derived from the first eight representative, constituent spectra. Parameters given in italics have been fixed to the properties derived from the summed spectrum due to low count rate, note also the comparatively poor fit to the spectrum of 2014 May 12. In all cases errors quoted are 90% confidence limits. The X-ray luminosities are derived after correction for extinction and for a distance to the LMC of .
2.2.1 X-ray timing analysis

Lomb-Scargle (LS; Lomb Lomb76 (1976), Scargle Scargle82 (1982), Press & Rybicki Press89 (1989)) analysis was performed on each of the single observation light curves as well as on a composite light curve, made up of all the data sets. LS analysis is ideal for detecting weak, periodic modulation in unevenly sampled data sets (such as our composite data set). A ’blind’ search for periods between 7s (approximately twice the frame interval of Chandra) and 1s was performed with a frequency step of . Foreshadowing the discussion in Sects. 3.2 and 4.1, this exceeds the observed range of pulsational periods exhibited by neutron stars in X-ray binaries with OB star primaries.
At the other extreme, long-term modulation of the lightcurve might be expected from the rotation of magnetic stars, or due to orbital modulation in colliding-wind systems or accreting high-mass X-ray binaries; in all cases the resultant period may range from several days to several years. Unfortunately, the durations of the individual observing blocks are day (with only a single exception; Table 3) meaning that none would be expected to sample a full cycle of a system with a period of a few days. Moreover, the overall time span of the observations is such that we would also not expect to fully sample a single cycle of any long-period (day) modulation. Thus, we conclude that the current dataset is ill-suited to the robust detection of any such putative period; a longer (continuous) time base of observations would be required.
Furthermore, orbital modulation of the X-ray light curves of such binaries occurs in the subset of eccentric-orbit systems, which may demonstrate high-amplitude flaring during perisatron passage due to strengthened wind/wind interactions in colliding wind systems (e.g. Corcoran corcoran (2005)) or enhanced accretion rates in X-ray binaries (e.g. Galache et al. galache (2008)). Such repetitive, periodic flaring is not immediately apparent in the lightcurve of VFTS 399, although this does not preclude its future occurrence since, in the case of X-ray binaries, such behaviour is observed to be transient.
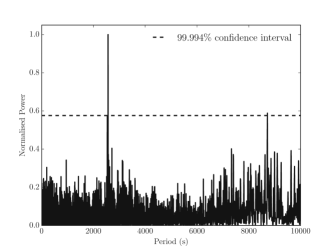
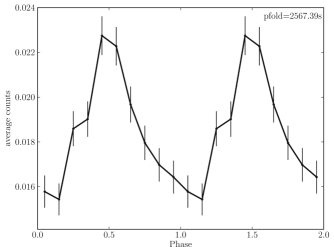
With the above constraints in mind, Fig. 6 shows the LS periodogram of the whole data set. There appears to be evidence for a period at s at level of significance. Fig. 7 shows the pulse profile, which appears asymmetric and single peaked. A peak at this period is present in the periodograms of a number of individual observation blocks, albeit inevitably at a lower level of significance. The strength of the detection of a period in a given observation depends on the S/N of the observation, the pulsed fraction and the period length: it is easier to find shorter rather than longer periods in any given observation since more ’cycles’ are present. As such it is not surprising that this period is not robustly detected in some observations; for instance our shortest observation, 5906, is only 12.3 ks in duration, which allows for <5 pulsations. Nevertheless, this latter result gives us confidence that the period is not spuriously introduced by our analysis of the composite lightcurve during the process of ‘stitching together’ its constituent parts; this assumption was quantitatively tested as described below333Such a methodology is routinely applied in e.g. the case of optical observations of X-ray binaries, where periodic gaps between distinct segments of the lightcurve are introduced by seasonal visibility constraints (e.g. Bird et al. bird (2012)). Moreover, Reig et al. (reig09 (2009)) encountered exactly this issue in their search for X-ray pulsations in the high-mass binary 4U2206+54, due to visibility gaps in their RXTE lightcurve.. Finally, a strong period at 707 s detected in the periodogram of observation 16193 is the Chandra dither period, resulting from a bad CCD column falling within the aperture.
In order to test both the robustness and statistical significance of this period a number of simulations of the data were run. LS analysis was first performed on the barycentric-corrected X-ray event timestamps with a variety of sizes to make sure that the 2567 s period was not an artefact of the binning adopted - in each case the period was still detected. The data were then bootstrapped to determine how robust the period was. This was accomplished by creating ‘fake’ data sets by using a random number generator to select % of the data points and performing a LS analysis on the resultant lightcurve. If the detected period was being driven by a small number of data points it will not be consistently detected during the bootstrapping. The period at s was detected in 96.6% of the trials, suggesting that the period is indeed robust.
We also ran a second bootstrapping analysis, this time selecting random observations (as opposed to data points) to build the simulated data sets. Anywhere from 30 to 80% of the total data were used (since there are fewer ways to randomly select 20 light curves in contrast to the full set of data points). In this instance the period at s was recovered in 85% of the trials. The discrepancy between the two analyses almost certainly arises in the low data fraction regime in the second bootstrapping, since recovering the period with only % of the original data will be unlikely.
The significance of the detected period was assessed by estimating the probability of the detection under the null hypothesis that the lightcurve is uniform. Over 15000 such light curves were generated by randomizing the X-ray event timestamps. This allows us to create simulated light curves with the same statistical properties as the original data set. LS analysis was performed on each of these light curves and the maximum LS power achieved recorded. This is shown as the dashed line in Fig. 6. The results of the Monte-Carlo analysis suggest that our s period, with a LS power of 42.8 has a less than 1 in 15787 (i.e. <0.006334%) probability of being a chance occurrence due to white noise. Although a second peak (at 8718 s) in the periodogram exceeds this significance threshold, it is not robust to the above bootstrapping analyses; specifically, the peak disappears into the noise if the three observing blocks from 2006 are excluded, suggesting that it is most likely an artefact.
We therefore conclude that the Monte-Carlo and bootstrapping analyses both suggest there is a periodic modulation in our data set although, trivially, it cannot reveal the origin of this periodicity. The s period does not correspond to the Chandra frame interval (3.241040 s), dither period (707 s) or the orbital period (198 ks), nor does it correspond to an alias (the beat frequency) of any of these three potential periods with each other (which corresponds to 3.241093, 3.255966 s and 707.5335 s; for a comprehensive discussion on aliasing and periods see Bird et al. bird (2012)). For the remainder of the paper we therefore proceed under the assumption that the period is astrophysical in origin.
Typically, in determining the error on a period one assumes that the period derivative is zero throughout the observation and hence that the dominant source of errors is the Poisson error on the counts themselves444In such circumstances one may vary the lightcurve within the errors on the individual data points in order to produce a large number (i.e. ) of synthetic lightcurves that are statistically identical to the original and subject each to a LS search. A histogram of the resultant distribution of periods is typically well approximated by a Gaussian, from which the width (i.e. standard deviation) yields a quantitative estimate of the period error.. However, given the time span of our observations we may not a priori make this assumption. This in turn prevents a robust quantitative estimate of the error on the period since we may not distinguish between random error and a systematic evolution of the period during the course of the observation.
However, this turns out to be of secondary concern as it is possible that the s period we detect could be an alias of the true astrophysical period and the Chandra frame interval (3.241040 s; note that aliasing is a common problem in the analysis of e.g. optical light curves of X-ray binaries (Bird et al. bird (2012))). This would require the true period of VFTS 399 to be s. Unfortunately following the above discussion such a period would not be directly detectable in our current dataset; observations by a different observatory such as XMM would be necessary to distinguish between these possibilities. It is, however, noteworthy that our simulations indicate the s period is robust to evolution of the period, such as those commonly seen in X-ray binaries due to accretion torques and doppler motion, but not so if it is due to an alias. Given the nature of the system (Sect. 3.2 and 4.1) this might be taken as evidence to disfavour the alias hypothesis.
Nevertheless, it is important to emphasise that either interpretation still requires a real periodicity in the X-ray lightcurve to be present. However, we are left in the uncomfortable position of having identified a statistically-significant period of apparently astrophysical origin in our dataset but not being able to conclusively determine whether the s periodicity is an alias or not. As a consequence for the remainder of the paper (e.g. Sects. 3.2 and 4) we are forced to consider the physical implications of both the ‘short’ and ‘long’ periods in parallel. Clearly, independent observations of VFTS 399 with observatories other than Chandra would be highly desirable, since one requires a much shorter frame time in order to test the alias hypothesis.
3 The nature of VFTS339
VFTS 399 is displaced from the locus occupied by the majority of OB stars in both near-IR (; Dougherty et al. dougherty (1994)) and mid-IR ([3.6]/([3.6][4.5]); Bonanos et al. bonanos (2009)) colour/colour and colour/magnitude diagrams. It is in a region populated by, amongst others, early-type stars exhibiting the classical Be phenomenon. Furthermore, photometric variability, such as that demonstrated by VFTS 399, is a well-known property of classical OeBe stars (e.g. Mennickent et al. mennickent (2002)).
Emission in the Balmer series is another key classification criterion for classical OeBe stars. Under such a scenario, the emission at large projected velocities in the line wings of H, H and He i 6678Å (Fig. 3) would result from the presence of a compact, quasi-Keplerian decretion disc; during the early stages of disc-reformation, time resolved H spectra of And revealed emission components with a comparable peak-to-peak separation (Clark et al. clark03 (2003)). Similar behaviour is also observed in both the H and He i 6678Å lines of the B0 Ve primary of the high mass X-ray binary X Per. Comparison of X Per to VFTS 399 appears particularly apposite, given that both stars demonstrate additional emission features interior to those present in the line wings. In X Per this is attributed to the presence of a gaseous circumstellar ring exterior to, and rotating more slowly than, the inner disc that is responsible for the high-velocity emission component of the line profile (Tarasov & Roche tarasov (1995), Clark et al. clark01 (2001))555In this regard we are mindful of the likelihood of nebular contamination in VFTS 399. However even if all emission interior to the high velocity wings were nebular in origin - which appears unlikely upon comparison of the relative widths of the nebular lines to this component - the global consideration that VFTS 399 is a classical OeBe star would not be affected. However, potential unresolved nebular contamination does preclude the measurement of the line equivalent widths..
The OeBe phenomenon extends to stars with spectral types as early as that of VFTS399 (e.g. Neguerueula et al. iggy04 (2004)), while such stars are also known to be rapid rotators (e.g. Townsend et al. townsend (2004)). In light of these observational properties, VFTS 399 appears to be a classical OeBe star and hence we slightly revise its formal classification to O9 IIIne.
3.1 Stellar parameters
The broad-band photometry presented in Table 1 was analysed using the Bayesian code CHORIZOS in order to determine the interstellar reddening (Maíz Apellániz maiz04 (2004), Maíz Apellániz et al. maiz14 (2014)), from which Walborn et al. (walborn (2014)) inferred , kK and log for VFTS 399. As part of a wider programme (Ramírez-Agudelo, in prep.), the LR02 and LR03 spectroscopic data were subsequently analysed with the non-local thermodynamic equilibrium code FASTWIND (Puls et al. puls (2005)), yielding kK, log and log.
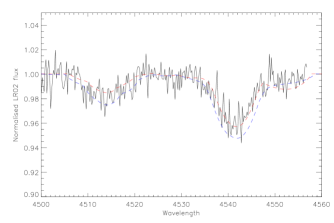
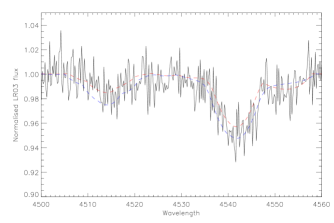
We have also attempted to estimate the nitrogen abundance in VFTS 399. Due to its large projected rotational velocity, the N ii spectrum could not be analysed but the N iii multiplet near 4515Å was observed as a blend in the LR02 and LR03 spectra. In both spectra, this region lies close to either the upper or lower wavelength limits making normalisation of the spectra difficult. We have therefore chosen to treat the spectra separately, with a simple subjective normalisation. These spectra are shown in Fig. 8, together with predictions from model atmosphere calculations. The latter were taken from the O-type star grid of Lanz & Hubeny (lanz (2003)) and have been convolved with an appropriate broadening function. The weaker theoretical N iii spectrum has been interpolated to the FASTWIND atmospheric parameters (and a microturbulence of 10kms-1) and is for a nitrogen abundance of 7.62 dex and a LMC metallicity. The stronger spectrum is for a nitrogen abundance of 7.92 dex but a galactic metallicity; this leads to more line blanketing, a hotter temperature structure and, for example, enhanced He ii absorption. Inspection of grid models with different effective temperatures implies that this will lead to an overestimation of the strength of the N iii spectra compared with an LMC metallicity.
Both the LR02 and LR03 spectra imply a nitrogen abundance of approximately 7.8 dex. However we emphasise that this value and the atmospheric parameters from the FASTWIND analysis must be treated with caution due to the limitations of classical non-LTE techniques. Both the H and H profiles are subject to infilling, with some evidence for similar behaviour in the H profile, although a definitive conclusion is complicated by possible nebular contamination. Moreover we have assumed that an isolated stellar model atmosphere is appropriate; the possible systematic errors introduced by the complexity of the system e.g the presence of an accreting secondary (see Sect. 3.2) are difficult to quantify but could be significant. Nevertheless, we are confident that our conclusion that VFTS 399 demonstrates a pronounced nitrogen enhancement is robust.
Likewise, contamination of the broad-band photometry by continuum emission from the circumstellar disc inferred for VFTS 399 has the potential to seriously compromise reddening, and hence luminosity, estimates. This is evident upon consideration of the long term photometric behaviour of the BeX-ray binary A0535+26. Over a yr period Clark et al. (clark99 (1999)) report mag and mag as a result of disc variability (in the sense the system became redder as it brightened). As a consequence if we fail to account for the presence of the circumstellar disc, we risk overestimating the bolometric luminosity of VFTS399 because (i) we will not subtract the excess disc continuum emission and (ii) because we will overestimate the interstellar reddening component and hence over correct for this.
Riquelme et al. (riquelme (2012)) investigated this problem for Be X-ray binaries in the Galaxy and Magellanic Clouds, finding it to be significant for the latter objects, where contributions from circumstellar and interstellar reddening are comparable. In the absence of contemporaneous spectroscopic and photometric observations of VFTS 399 in a discless state we may not determine the interstellar reddening. Moreover, nebular contamination of the H line prevents an equivalent width measurement and from this an estimate of the circumstellar reddening via the relationship defined by Riquelme et al. (riquelme (2012)). As a consequence we are forced to adopt a ‘worst-case’ approach, correcting for the maximum contribution from circumstellar reddening reported by Riquelme et al. (riquelme (2012)) of mag. Utilising this value, the photometry from Table 1 and the intrinsic colours of an O9 III star (Martins & Pez martins06 (2006)) we may infer an interstellar reddening. Then employing the relation from Riquelme et al. (riquelme (2012)) between total optical extinction and interstellar reddening - mag - for Be X-ray binaries and an appropriate bolometric correction (from Martins et al. martins (2005)) we determine log for VFTS 399.
This value appears surprisingly low in comparison to either log or 4.72 expected for, respectively, O9 giants and main sequence stars (Martins et al. martins (2005)). It is difficult to envisage any physical process, such as binary interaction, that would leave a star this under luminous for its spectral classification, suggesting that we have over corrected for circumstellar contamination. Therefore we favour the intrinsic luminosity of an O9 V star as an appropriate lower bound for VFTS 399666Foreshadowing the discussion in Sect. 4.1, Negueruela & Reig (negueruela (2001)) reported that the emission-line mass-donor BD (classified as O9.5 V) in the high-mass X-ray binary 4U 2206+54 demonstrates variable emission, infilling the He ii 4686Å photospheric line that forms part of the luminosity classification criteria for late O-type stars (Walborn et al. walborn (2014)). If such an effect is also present here then it could erroneously lead to the assignment of a giant rather than dwarf luminosity class for VFTS 399. and the upper bound from Walborn et al. (walborn (2014)), leading to log.
We employed the Bayesian code BONNSAI777The BONNSAI web-service is available at http://www.astro.uni-bonn.de/stars/bonnsai (Schneider et al. 2014b ) to determine the current mass () and age of VFTS 399 (Table 5). Firstly, we neglected the luminosity estimate and simultaneously matched the observed effective temperature, kK, surface gravity, log and projected surface rotational velocity, kms-1 to the rotating, single star LMC models of Brott et al. (brott (2011)) and Köhler et al. (koehler (2014)). We used a Salpeter initial mass function (Salpeter salpeter (1955)) and the observed distribution of rotational velocities of the 30 Doradus O-type stars (Ramírez-Agudelo et al. oscar (2013)) as appropriate priors, together with a uniform distribution of stellar ages and a random orientation of rotational axes. The stellar models predicted a luminosity of log, in agreement with the luminosity estimate of Walborn et al. (walborn (2014)) and the expectations from the O9 classification. A luminosity of log was excluded at more than .
Secondly, we took the luminosity estimates for VFTS 399 into account. Following from above we assumed log but, for completeness, also undertake calculations assuming both log - appropriate for the maximum expected contamination by a circumstellar disc - and log - the expected luminosity for an O9 III star (Martins et al. martins (2005)). The results are presented in Table 5. For log, the stellar models could not reproduce the observables simultaneously, likely due to the low luminosity. For our favoured range of bolometric luminosities we determined . Finally, we inferred a current age of Myr for VFTS 399, assuming single-star evolution. However, pre-empting the discussion in Sect. 3.2, we consider it likely that VFTS 399 has accreted mass from a binary companion in the past, rejuvenating the star (e.g. Schneider et al. 2014a ); therefore we consider this value as a lower limit for its true age.
Under this assumption it is of interest to determine whether the observed nitrogen enhancement in VFTS 399 is the result of binary mass transfer. Langer (langer (2012)) showed that for Galactic stars such interaction may result in an enrichment of dex. Since the initial C/N ratio is dex larger in the Galaxy in comparison to the LMC we would expect the nitrogen enrichment in the LMC to be larger by this amount; for a baseline nitrogen abundance of dex in the LMC we would predict a post-interaction abundance of dex. Unfortunately, while this is consistent with our findings for VFTS 399, it is also consistent with the predictions for rotational mixing in a single, rapidly rotating star, with BONNSAI predicting dex for our favoured range of luminosities. Therefore we are current unable to utilise the chemical abundance of VFTS 399 in isolation to distinguish between single and binary star evolution.
| log | Age | |
|---|---|---|
| (Myr) | ||
| — | ||
All four models utilise stellar temperature, surface gravity and projected equatorial rotational velocity as input parameters, while rows 2-4 present the results of including the stellar luminosity estimates (column 1) as an additional constraint. The quoted errors are uncertainties.
3.2 Understanding the X-ray emission
Single OB stars are known to be (thermal) X-ray emitters, likely due to shocks propagating through their winds. However, this emission scales as log (e.g. Berghoefer et al. berghoefer (1997), Sana et al. sana06 (2006)), while VFTS 399 is orders of magnitude brighter, with log in the observations reported above, while the emission is of a non-thermal nature. These properties also exclude membership of the class of X-ray bright and variable Cas-like OeBe stars, for which a high temperature thermal spectrum and log are expected (Smith et al. smith (2012), Rauw et al. rauw (2013)). Likewise, the peak X-ray luminosity of VFTS 399 is two orders of magnitude greater than that found for Of?p stars and the subset of strongly magnetic O-type stars which, in turn, are X-ray over-luminous with respect to the wider population of massive stars (cf. Nazé et al. naze08 (2008), Clark et al. clark09 (2009) and refs. therein). Additionally, the X-ray emission in such stars is once again thermal in origin, in contrast to VFTS 399.
At its peak luminosity, VFTS 399 is an order of magnitude brighter than any O+O colliding wind binary, although seven binaries with luminous blue variable or Wolf-Rayet primaries demonstrate logerg s-1 (Gagné et al. gagne (2012))888WR48a, Mk34, Car, R140a, WR25, R136c and CXO J1745-28.. However in each of these systems the primaries support significantly more powerful winds than are expected for VFTS 399, suggesting that its X-ray flux is unlikely to arise via wind collisions (indeed no signature of any secondary is visible in our optical spectroscopic observations). Moreover the X-ray emission from such systems is thermal in origin, with keV for those massive binaries with comparable X-ray fluxes.
We are then left with the possibility that VFTS 399 contains an accreting relativistic object and, given the nature of the primary, an obvious identification is with a Be X-ray binary. These systems are overwhelmingly comprised of OeBe stars (O9-B2 V-III; Negueruela & Coe negueruela02 (2002), McBride et al. mcbride (2008)) orbited by neutron stars and have periods days days and eccentricities (Cheng et al. cheng (2014)). The interplay between orbital phase and the intrinsically variable circumstellar disc leads to complex, variable X-ray emission (e.g. Okazaki & Negueruela okazaki (2001))999Most Be X-ray binaries are transient systems, with outbursts typically their quiescent X-ray luminosities. Following the nomenclature of Stella et al. (stella (1986)), Type I outbursts occur periodically during periastron passage and typically yield fluxes of erg s-1. Type II outbursts are much rarer, aperiodic, have a longer duration and reach erg s-1. In contrast, a subset of systems with wide ( days), low-eccentricity orbits are persistent sources with moderate luminosity (erg s-1) and comparatively low-level variability ( quiescent flux), of which X Per is an exemplar (Haberl et al. haberl98 (1998), Reig & Roche reig99 (2007)).. Haberl et al. (haberl (2008)) determined the X-ray properties of a representative sample of SMC systems from single-epoch observations, finding the majority of spectra to be best fit by power laws () with a wide range of absorbing columns ( cm-2) and luminosities spanning ergs-1. The X-ray properties of VFTS 399 therefore appear entirely consistent with its classification as a Be X-ray binary.
In such a scenario a neutron star accretor would be strongly favoured on both theoretical and observational grounds. Only one Be+black hole X-ray binary has been identified from a Galactic population of 80 such systems (Casares et al. casares (2014)), while the same study shows it to have a quiescent X-ray luminosity some three orders of magnitude lower than VFTS 399.
Mindful of the caveats in Sect. 2.2.1, the detection of periodic modulation of the X-ray lightcurve provides support for such a conclusion, being most naturally explained as the pulsational period of a rotating, accreting neutron star. Importantly, both ‘short’ (s) and ‘long’ (s) potential periodicities lie within the range of pulsational periods exhibited by neutron stars within Be X-ray binaries (e.g. Knigge et al. knigge (2011), Reig et al. reig09 (2009)) and we expand upon this further in Sect. 4.1.
4 VFTS 399 in context
An immediate question to ask is whether we may constrain the orbital parameters of the system from the extant data? Adopting for the system primary (Sect. 3.1), the observed RV variability (Table 2 and Sect. 2.1.2) implies an unexpectedly short orbital period of days for a canonical neutron star companion. For days, consistent with the commonly found lower bound for Be X-ray binaries (Cheng et al. cheng (2014)), we would infer a companion mass of , with any longer period strongly favouring a black hole, apparently excluded by the detection of X-ray pulsations101010For comparison Antoniadis et al. (antoniadis (2013)) determine for the pulsar PSR J0348+0432, while Clark et al. (clark02 (2002)) report for the non-pulsating relativistic accretor in 4U1700-37 and Casares et al. (casares (2014)) find for the black hole orbiting the Be star MWC656.. Preliminary Monte-Carlo analysis following the methodology of Sana et al. (sana13 (2013)) appears to favour a lower-mass companion with a short period. We caution that this finding should be regarded as provisional since it is primarily driven by the discrepancy in RV between two epochs separated by 0.8days (Table 2; 2008 December 21, 22). Clearly further observations in order to build an orbital RV curve for the system are required to address this issue.
4.1 The putative neutron star accretor
Is the range of orbital periods suggested by the preceding analysis consistent with one or both of the potential pulsational periods? Following the relationship between the pulsational () and orbital () periods in Be X-ray binaries delineated in the Corbet diagram (Corbet corbet (1986), Knigge et al. knigge (2011)) we would infer d for s and days for s. While the first combination appears internally consistent, the long orbital period implied by the second would appear to be in tension with our RV data.
However, with d and s (Reig et al. reig09 (2009), reig12 (2012)), the O9.5 Ve+neutron star binary 4U 2206+54 demonstrates that such a combination of long pulsation but short orbital period is viable, although this would require VFTS 399 to host the third most slowly rotating neutron star of any high mass X-ray binary, behind 4U 2206+54 and 2S 0114+650 (day and hr; Crampton et al. crampton (1985), Corbet et al. corbet99 (1999), Farrell et al. farrell (2008)). In this regard we note that both the X-ray luminosity and aperiodic variability of VFTS 399 are replicated in 4U 2206+54 - which is assumed to be powered by direct wind-fed accretion (Negueruela & Reig negueruela (2001)) - while the primaries in both systems resemble one another (Blay et al. blay (2006), Walborn et al. walborn (2014)).
In each of the systems named above the exceptionally long pulsational periods of the neutron stars are explicable under the assumption that they had been significantly spun down, first via magnetic dipole radiation and subsequently the propellor mechanism (Li & van den Heuvel li (1999), Reig et al. reig09 (2009), reig12 (2012), Popov & Turolla popov (2012)). Operating on comparatively short timescales (yr; Popov & Turolla popov (2012)), this would also be consistent with the relatively unevolved nature of VFTS 399 (cf. footnote 6), although it would require extremely high magnetic fields, G, in order to facilitate it (cf. Li & van den Heuvel li (1999) and Appendix A).
Nevertheless, under either scenario, it is of interest that VFTS 399 appears to host the second young pulsar within the 30 Dor complex after the isolated neutron star PSR J0537-6910 (5arcmin/pc distant in projection). With ms (Marshall et al. marshall (1998)), PSR J0537-6910 rotates much more rapidly than the putative pulsar within VFTS 399, naturally explicable because of the lack of accretion driven spin-down in the former. However, if the VFTS 399 pulsar is exceptionally slowly rotating due to the effects of an extreme field one would be forced to explain their different field strengths (G versus G for PSR J0537-6910; Marshall et al. marshall (1998)), despite the likelihood of both pulsars having formed from the same underlying stellar population (cf. Dufton et al. dufton (2011)).
4.2 The O-type star mass donor
VFTS 399 demonstrates notable physical similarities with VFTS 102, another member of the high rotational-velocity O-type star cohort of 30 Dor (Ramírez-Agudelo et al. oscar (2013)). Both are emission-line stars, share the same spectral classification and their temperature, luminosity and surface gravity are identical within the errors quoted (Sect. 3.1 and Table 1 of Dufton et al. dufton (2011)). Based on the proximity of VFTS 102 to the isolated pulsar PSR J0537-6910 (Marshall et al. marshall (1998)), Dufton et al. (dufton (2011)) explored a common binary evolution scenario for both objects, with the mass-transfer model of Cantiello et al. (cantiello (2007)) yielding a rapidly rotating secondary well matched to VFTS 102 at the point of supernova.
While it is tempting to adopt a comparable pre-SN evolutionary scenario for VFTS 399 - albeit with the binary remaining bound at SN - this would be hard to reconcile with the extant RV data. Specifically, a short orbital period would require the binary system to lose a large fraction of the mass and angular momentum released in the pre-SN mass-transfer process (Petrovic et al. petrovic (2005)), since conservative evolution leads to orbital periods in the range day (Wellstein et al. 2001). In other words, this observational constraint implies that VFTS399 accreted comparatively little material, noting that the accretion of only M⊙ is sufficient to spin it up to critical rotation. Had the initial mass ratio been close to one - as inferred for VFTS 102 - then the mass transfer would be expected to remain close to conservative (Langer langer (2012), de Mink et al. demink (2013)). Therefore the properties of the VFTS399 binary system are best understood if the initial mass of the NS progenitor was significantly higher than the current mass of the Oe component.
Given the current absence of a full orbital solution for VFTS 399 the calculation of a tailored evolutionary model is premature, although based on previous analysis we might expect an initial mass of for the NS progenitor; as a consequence of this we may speculate that VFTS 399 might host a high-mass NS. Under the mass-transfer scenario we favour the mass gainer is expected to quickly rejuvenate, and then behave just as a single star of its new mass, with the possible exception of rapid rotation and surface abundance anomalies. Therefore, we might expect VFTS 399 to have been born with broadly similar properties to those we infer for it now (Table 5 and Sect. 3.1), while our current age estimate (Myr; Table 5) would be only slightly lower than expected. Our hypothetical primary would be expected to explode after Myr (Brott et al. brott (2011)); fully consistent with such a scenario and implying a rather recent (Myr) SN.
As with VFTS 102, we might therefore expect the systemic velocity of VFTS 399 to have been influenced by the SN. Somewhat surprisingly, there is no indication of it being a radial velocity runaway, with kms-1 in comparison to a cluster mean of km-1 and a velocity dispersion kms-1 (Sana et al. sana12 (2012), sana13 (2013)). Nevertheless, the location of VFTS 399 - on the periphery of the complex and displaced from any recognised cluster (Fig. 1; Walborn et al. walborn (2014)) - suggests a runaway nature; our prediction of a recent SN would suggest a displacement of pc from its birth site. Ongoing Hubble Space Telescope proper motions studies (PI: D. J. Lennon; see Sabbi et al. sabbi (2013)) should provide a complementary determination of the transverse velocity in order to test this prediction.
Both VFTS 102 and VFTS 399 have been associated with a population of apparently single, rapidly-rotating O-type star runaways within the 30 Dor complex (Walborn et al. walborn (2014)). Of these, 15 stars are of spectral type O8-O9.5 III-V111111VFTS 5 (O8 Vn), 74 (O9 Vn), 91 (O9.5 IIIn), 102 (O9: Vnnne+), 138 (O9 Vn), 249 (O8 Vn), 399 (O9 IIIn), 530 (O9.5III:nn), 531(O9.5III:nn), 574 (O9.5 IIIn), 592 (O9.5 Vn), 654 (O9 Vnn), 660 (O9.5 Vnn), 768 (O8 Vn) and 843 (O9.5IIIn). and hence might be expected to exhibit the OeBe phenomenon (Negueruela et al. iggy04 (2004)). However, at the time of our spectral observations, only VFTS 102 and 399 were found to support the gaseous circumstellar discs from which a putative neutron star/black hole might accrete. Therefore the remaining stars from this grouping could also harbour relativistic companions which would remain undetectable at X-ray energies until they too formed circumstellar discs. Eldridge et al. (eldridge (2011)) examined the pre- and post-SN evolution of massive binaries and concluded that they remain bound in % of cases, with a most likely systemic velocity of kms-1. Given this prediction, long term optical and X-ray observations of this cohort would appear warranted in order to determine if a subset of these stars are indeed quiescent X-ray binaries and hence received their anomalous rotational and/or radial velocities via binary interaction and subsequent SN kick.
5 Concluding remarks
The multi-wavelength properties of the outlying, rapidly rotating O-type star VFTS 399 appear difficult to reconcile with those expected for a single star, instead favouring a binary hypothesis. The X-ray properties strongly favour the presence of a relativistic accretor, with the optical and near-IR properties consistent with classification as a Be X-ray binary, being the seventeenth such system within the LMC at the time of writing (Negueruela & Coe negueruela02 (2002), Vasilopoulos et al. vasil (2013)) and the first identified within 30 Dor.
The discovery of an apparently robust, statistically-significant periodicity in the X-ray lightcurve provides strong evidence for a neutron star in the the system. Unfortunately we are currently unable to determine conclusively whether the s period reflects or instead is an alias of the true s, although the robustness of the former period to the secular evolution common in X-ray binaries argues that it is astrophysical in origin. Breaking this degeneracy via observations with an alternative observatory such as XMM would be of considerable interest, since the former scenario would imply that the neutron star supported a magnetic field of comparable strength to those exhibited by magnetars in order to permit the dramatic spin down required to yield its current .
These findings have a number of ramifications:
(i) Identification of individual (high-mass)
X-ray binaries with their natal stellar aggregates is surprisingly rare -
LS I +63 235 lies within the halo of the cluster NGC663,
while PSR B1259-63 and IGR J00370+6122 are likely members of the Cen OB1
and Cas OB8 associations respectively (Negueruela et al. iggy11 (2011),
González-Galán et al. gonzalez (2014)). The location of VFTS 399 within the confines of the 30 Dor complex could
therefore aid
the observational assessment of the predictions of current population-synthesis models. These include the production
(and retention) rates of high mass X-ray binaries as a function of star-formation rate and the
duration of such activity. This would also inform studies of e.g. the global X-ray luminosity/star-formation rate relationship for non-active galaxies (e.g. Mineo et al. mineo (2012)).
(ii) In conjunction with determinations of both radial and transverse velocity components, characterisation of the orbital period and eccentricity of VFTS 399 should permit the dynamics of the SN explosion to be reconstructed. Given that Pfahl et al. (pfahl (2002)) and Podsiadlowski et al. (podsiadlowski (2004)) suggest that the magnitude of kick is dependent on the pre-SN binary evolution, the fact that we may place observational constraints on this for VFTS 399 via comparison to the stellar population(s) of 30 Dor is of considerable interest.
(iii) If the inference of an extreme field for the putative neutron star is confirmed, reconstruction of the pre-SN evolutionary pathway and SN dynamics will help constrain the formation requirements for such objects. Moreover, it would support the hypothesis that binarity is a common feature in the formation of magnetars, which in turn would arise from progenitors with a wide mass range
from about up to or more (Sect. 4.2 and Clark et al. clark14 (2014)).
(iv) After VFTS102, VFTS 399 is the second object drawn from the
population of rapidly rotating apparently single O-type stars for which
historical/current binarity has subsequently been inferred. Such a finding is consistent with the hypothesis that binary interactions may play a key role in the formation of this cohort (de Mink et al. demink (2013), Ramírez-Agudelo et al. oscar (2013)). If confirmed for further examples it will have considerable import for the production of the rapidly-rotating, chemically-homogeneous stars inferred to be the progenitors of long gamma-ray bursts.
Acknowledgements.
We thank the referee and Danny Lennon and Ignacio Negueruela for their insightful comments which have greatly improved the paper. SdM acknowledges support by NASA through and Einstein Fellowship grant, PF3-140105. STScI is operated by AURA, Inc. under NASA contract NASA 5-26555. LKT and PSB were supported by Chandra X-ray Observatory general observer grants GO4-15131X and GO5-6080X and by the Penn State ACIS Instrument Team Contract SV4-74018, issued by the Chandra X-ray Center, which is operated by the Smithsonian Astrophysical Observatory for and on behalf of NASA under contract NAS8-03060. The Guaranteed Time Observations included here were selected by the ACIS Instrument Principal Investigator, Gordon P. Garmire, of the Huntingdon Institute for X-ray Astronomy, LLC, which is under contract to the Smithsonian Astrophysical Observatory; Contract SV2-82024.References
- (1) Antoniadis, J., Freire, P. C. C., Wex, N. et al. 2013, Science, 340, 448
- (2) Arnaud, K. A. 1996, in Astronomical Society of the Pacific Conference Series, Vol. 101, Astronomical Data Analysis Software and Systems V, ed. G. H. Jacoby & J. Barnes, 17
- (3) Berghoefer, T. W., Schmitt, J. H. M. M., Danner, R. & Cassinelli 1997, A&A, 322, 167
- (4) Bird, A. J., Coe, M. J., McBride, V. A. & Udalski, A. 2012, MNRAS, 423, 3663
- (5) Blaauw, A. 1961, Bull. Astron. Inst. Netherlands, 15, 265
- (6) Blay, P., Negueruela, I., Reig, P. et al. 2006, A&A, 446, 1095
- (7) Bonanos, A. Z., Massa, D. L., Sewilo, M., et al. 2009, AJ, 138, 1003
- (8) Brott, I., de Mink, S. E., Cantiello, M., et al. 2011, A&A, 530, A115
- (9) Cantiello, M., Yoon, S.-C., Langer, N. & Livio, M. 2007, A&A, 465, L29
- (10) Casares, J., Negueruela, I., Ribó, M., et al. 2014, Nature, 505, 378
- (11) Cheng, Z.-Q., Shao, Y. & Li, X.-D. 2014, ApJ, 786, 128
- (12) Cioni, M.-R. L., Clementini, G., Girardi, L., et al. 2011, A&A, 527, A116
- (13) Clark, J. S., Lyuty, V. M., Zaitseva, G. V. et al. 1999, MNRAS, 302, 167
- (14) Clark, J. S., Tarasov, A. E., Okazaki, A. T., Roche, P. & Lyuty, V. M. 2001, A&A, 380, 615
- (15) Clark, J. S., Goodwin, S. P., Crowther, P. A. et al. 2002, A&A, 392 909
- (16) Clark, J. S., Tarasov, A. E. & Panko, E. A., 2003, A&A, 403, 239
- (17) Clark, J. S., Crowther, P. A. & Mikles, V. J. 2009, A&A, 507, 1567
- (18) Clark, J. S., Ritchie, B. W., Najarro, F., Langer, N. & Negueruela, I. 2014, A&A, 565, A90
- (19) Corbet, R. H. D. 1986, MNRAS, 220, 1047
- (20) Corbet, R. H. D., Finley, J. P. & Peele, A. G. 1999, ApJ, 511, 876
- (21) Corcoran, M. F. 2005, AJ, 129, 2018
- (22) Crampton, D., Hutchings, J. B. & Cowley, A. P. 1985, ApJ, 299, 839
- (23) de Mink, S. E., Pols, O. R. & Hilditch, R. W. 2007, A&A, 467, 1181
- (24) de Mink, S. E., Langer, N., Izzard, R. G., Sana, H. & de Koter, A. 2013, ApJ, 764, 166
- (25) Dougherty, S. M., Waters, L. B. F. M., Burki, G., et al. 1994, A&A, 290, 609
- (26) Dufton, P. L., Dunstall, P. R., Evans, C. J. et al. 2011, ApJ, 743, L22
- (27) Dufton, P. L., Langer, N., Dunstall, P. R., et al. 2013, A&A, 550, A109
- (28) Eldridge, J. J., Langer, N. & Tout, C. A. 2011, MNRAS, 414, 3501
- (29) Evans, C. J., Taylor, W. D., Hénault-Brunet, V., et al. 2011, A&A, 530, A108
- (30) Farrell, S. A., Sood, R. K., O’Neill, P. M. & Dieters, S. 2008, MNRAS, 389, 608
- (31) Gagné, M., Fehon, G. Savoy, M. R. et al. 2012, in Proceedings of Four Decades of Massive Star Research - A Scientific Meeting in Honour of Anthony F. J. Moffat, ASP Conference Series, Vol. 465. San Francisco: Astronomical Society of the Pacific, 2012., p.301
- (32) Galache, J. L., Corbet, R. H. D., Coe, M. J. et al. 2008, ApJS, 177, 189
- (33) Gibson, B. K., 2000, Mem. Soc. Astron. Ital., 71, 693
- (34) González-Galán, A., Negueruela, I., Castro, N., et al. 2014, A&A, 556, A131
- (35) Grebel, E. K. & Chu, Y.-H. 2000, AJ, 119, 787
- (36) Haberl, F., Angelini, L., Motch, C. & White, N. E. 1998, A&A, 330, 189
- (37) Haberl, F., Eger, P. & Pietsch, W. 2008, A&A, 489, 327
- (38) Hurley, J. R., Tout, C. A. & Pols, O. R. 2002, MNRAS, 329, 897
- (39) Kato, D., Nagashima, C., Nagayama, T., et al. 2007, PASJ, 59, 615
- (40) Knigge, C., Coe, M. J. & Podsiadlowski, P. 2011, Nature, 479, 372
- (41) Köhler, K., Langer, N., de Koter, A., et al. 2015, A&A, 573, A71
- (42) Langer, N. 2012, ARAA, 50, 107
- (43) Lanz, T. & Hubeny, I., 2003, ApJS, 146, 417
- (44) Li, X.-D. & van den Heuvel, E. P. J. 1999, ApJ, 513, L45
- (45) Lomb N. R., 1976, Ap&SS, 39, 447
- (46) Maíz Apellániz, J. 2004, PASP, 116, 859
- (47) Maíz Apellániz, J., Evans, C. J., Barbá, R. H. et al. 2014, A&A, 564, A63
- (48) Marshall, F. E., Gotthelf, E. V., Zhang, W., Middleditch, J. & Wang Q. D. 1998, ApJ, 499, L179
- (49) Martins, F., Schaerer, D. & Hillier, D. J. 2005, A&A, 436, 1065
- (50) Martins, F. & Plez, B. 2006, A&A, 457, 637
- (51) McBride, V. A., Coe, M. J., Negueruela, I. Schurch, M. P. E. & McGowan, K. E. 2008, MNRAS, 388, 1198
- (52) Meixner, M., Gordon, K. D., Indebetouw, R. et al. 2006, AJ, 132, 2268
- (53) Mennickent, R. E., Pietrzyński, G., Geiren, W. & Szewczyk, O. 2002, A&A, 393, 887
- (54) Mineo, S., Gilfanov, M. & Sunyaev, R. 2012, MNRAS, 419, 2095
- (55) Nazé, Y., Walborn, N. R. & Martins, F. 2008, RMxAA, 44, 331
- (56) Negueruela, I. & Reig, P. 2001, A&A, 371, 1056
- (57) Negueruela, I. & Coe, M. J. 2002, A&A, 385, 517
- (58) Negueruela, I., Steele, I. A. & Bernabeu G. 2004, AN, 325, 749
- (59) Negueruela, I. Ribó, M., Herrero, A. et al. 2011, ApJ, 732, L11
- (60) Okazaki, A. T., & Negueruela, I., 2001, A&A, 377, 161
- (61) Petrovic, J., Langer, N. & van der Hucht, K. A. 2005, A&A, 435, 1013
- (62) Pfahl, E. Rappaport, S., Podsiadlowski, P. & Spruit, H. 2002, ApJ, 574, 364
- (63) Podsiadlowski, Ph., Langer, N., Poelerends, A. J. T., et al. 2004, ApJ, 612, 1044
- (64) Popov, S. B. & Turolla, R. 2012, MNRAS, 421, L127
- (65) Press W. H. & Rybicki G. B., 1989, ApJ, 338, 277
- (66) Puls, J., Urbaneja, M. A., Venero, R. et al. 2005, A&A, 435, 669
- (67) Ramírez-Agudelo, O. H., Simón-Díaz, S., Sana, H., et al. 2013, A&A, 560, A29
- (68) Rauw, G., Nazé, Y., Spano, M., Morel, T., ud-Doula, A. 2013, A&A, 555, L9
- (69) Reig, P. 2007, MNRAS, 377, 867
- (70) Reig, P. & Roche, P. 1999, MNRAS, 306, 100
- (71) Reig, P., Torrejón, J. M., Negueruela, I., et al. 2009, A&A, 494, 1073
- (72) Reig, P., Torrejón, J. M. & Blay, P. 2012, MNRAS, 425, 595
- (73) Ribó, M., Negueruela, I., Blay, P., Torrejón, J. M. & Reig, P. 2006, A&A, 449, 687
- (74) Riquelme, M. S., Torrejón, J. M. & Negueruela, I. 2012, A&A, 539, A114
- (75) Sabbi, E., Anderson, J., Lennon, D. J., et al. 2013, AJ, 146, 53
- (76) Salpeter, E. E., 1955, ApJ, 121, 161
- (77) Sana, H., Rauw, G., Nazé, Y., Goset, E. & Vreux, J.-M. 2006, MNRAS, 372, 661
- (78) Sana, H., Dunstall, P. R., Hénault-Brunet, V. et al. 2012, in Proceedings of Four Decades of Massive Star Research - A Scientific Meeting in Honour of Anthony F. J. Moffat, ASP Conference Series, Vol. 465. San Francisco: Astronomical Society of the Pacific, 2012., p.284
- (79) Sana, H., de Koter, A., de Mink, S. E., et al. 2013, A&A, 550, A107
- (80) Scargle J. D., 1982, ApJ, 263, 835
- (81) Schneider, F. R. N., Izzard, R. G., de Mink, S. E., et al. 2014, ApJ, 780, 117
- (82) Schneider, F. R. N., Langer, N., de Koter, A., et al. 2014b, A&A, 570, A66
- (83) Shakura, N., Postnov, K., Kochetkova, A & Hjalmarsdotter, L. 2012, MNRAS, 420, 216
- (84) Shtykovskiy, P. & Gilfanov, M. 2005, A&A, 431, 597
- (85) Sidoli, L., Mereghetti, S., Larsson, S. et al. 2005, A&A, 440, 1033
- (86) Skrutskie, M. F., Cutri, R. M., Stiening, R. et al. 2006, AJ, 131, 1163
- (87) Smith, M. A., Lopes de Oliveira, R., Motch, C., et al. 2012, A&A, 540, A53
- (88) Stella, L., White, N. E. & Rosner, R. 1986, ApJ, 308, 669
- (89) Sturm, R., Haberl, F., Pietsch, W. et al. 2013, A&A, 558, A3
- (90) Tarasov, A. E. & Roche, P. 1995, MNRAS, 276, L19
- (91) Townsend, R. H. D., Owocki, S. P. & Howarth, I. D. 2004, MNRAS, 350, 189
- (92) Townsley, L. K., Broos, P. S., Feigelson, E. D., Garmire, G. P. & Getman, K. V. 2006, AJ, 131, 2164
- (93) Townsley, L. K., Broos, P. S., Garmire, G. P., et al. 2014, ApJS, 213, 1
- (94) Udalski, A. 2003, AcA, 53, 291
- (95) Vasilopoulos, G., Maggi, p., Haberl, F. et al. 2013, A&A, 558, A3
- (96) Walborn, N. R. & Blades, J. C. 1997, ApJS, 112, 457
- (97) Walborn, N. R., Barbá, R. H. & Sewiło, M. M. 2013, AJ, 145, 98
- (98) Walborn, N. R., Sana, H., Simón-Díaz, S., et al. 2014, A&A, 564, A40
- (99) Wellstein, S., Langer, N. & Braun, H. 2001, A&A, 369, 939
Appendix A Spin-down in the presence of extreme magnetic fields
Following the analysis of Li & van den Heuvel (li (1999)), the evolution of the spin
period of the putative neutron star companion to VFTS 399 depends on the accretion rate/torque - a function of the (currently unknown) orbital separation and wind properties of the primary - and its magnetic field. For this mechanism to yield s it must have been born with an (external) magnetic field of comparable strength to those exhibited by magnetars (G). If we make the assumption that the neutron star in VFTS 399 is rotating at its
equilibrium period we may estimate the dipolar field strength from:
(Li & van den Heuvel li (1999), Reig et al. reig09 (2009)) where G is the dipolar field strength, g s-1 the mass accretion rate and cm and M⊙ the neutron star radius and mass. We adopt s, and for erg s-1 (Reig et al. reig09 (2009); Sect. 2.2), which leads to an order-of-magnitude estimate of G for the neutron star. One might assume that a significantly lower accretion rate may alleviate the requirement for such a field. However, following Li and van den Heuvel (li (1999)) e.g. g s-1 (leading to G) results in a spin-down timescale comparable to the total lifetime of VFTS 399 (cf Dufton et al. dufton (2011)), in contrast to its current relatively unevolved nature.
Recently, Shakura et al. (shakura (2012)) proposed a new theoretical model for quasi-spherical accession onto slowly rotating neutron stars (see also Popov & Turolla popov (2012)). Reig et al. (reig12 (2012)) demonstrate that the accretor in 4U2206+54 still supports an extreme (G) field under this formulation, although this requires an anomalously slow primary wind (which is observed in this system; Ribó et al. ribo (2006)). Clearly, an orbital solution for VFTS 399 and a determination of the wind parameters of the primary (mass loss rate and velocity at the orbital radius) in order to determine would provide an empirical test of the extreme field hypothesis, as would a measure of the long term spin-period history of the putative neutron star, from which an estimate of may also be obtained.