(S.-M.Cai)
Influence network in Chinese stock market
Abstract
In a stock market, the price fluctuations are interactive, that is, one listed company can influence others. In this paper, we seek to study the influence relationships among listed companies by constructing a directed network on the basis of Chinese stock market. This influence network shows distinct topological properties, particularly, a few large companies that can lead the tendency of stock market are recognized. Furthermore, by analyzing the subnetworks of listed companies distributed in several significant economic sectors, it is found that the influence relationships are totally different from one economic sector to another, of which three types of connectivity as well as hub-like listed companies are identified. In addition, the rankings of listed companies obtained from the centrality metrics of influence network are compared with that according to the assets, which gives inspiration to uncover and understand the importance of listed companies in the stock market. These empirical results are meaningful in providing these topological properties of Chinese stock market and economic sectors as well as revealing the interactively influence relationships among listed companies.
pacs:
89.65.Gh, 89.75.Fb, 05.45.Tp1 Introducation
In modern portfolio theory, risk diversification is the most essential issue, which involves the understanding of clustering behavior and risk contagion of the assets in a portfolio. Thus, in a stock market, the price fluctuate of a listed company’s asset (i.e., stock) is parallel to others or interactively influenced by others. The widely used cross-correlation analysis is an important measurement to investigate the interactive relationships between pairs of stocks for understanding the dynamic mechanics in complex economic system. For example, the random matrix theory (RMT) suggests the eigenvalues and corresponding eigenvectors of the cross-correlation matrix of price fluctuations are relevant to clustering behavior and economic sector division (or taxonomy) of stocks [1, 2, 3, 4]. Meanwhile, with the development of complex network theory, diverse cross-correlation based stock networks are proposed to describe the interactive relationship, such as minimum spanning tree (MST) [5, 6, 7, 8], planar maximally filtered graph (PMFG) [9], and threshold networks (TN) [10, 11, 12], etc. Especially, the clustering behavior of stocks can be well associated with the communities scratched from these stock networks via complex network measurement.
In order to evaluate risk contagion, a lot of works have been devoted to analyze the influence relationships from directed network perspective. Kenett et al. [10] introduced the measurement of partial correlation to construct TN and PMFG of listed companies and uncover the dominating ones in a stock market. The Engle-Granger method [13] is an alterative way to obtain the asymmetric influences (i.e, Granger causality) among listed companies. For example, Yang et al. [14] constructed directed cointegration network of global stock markets based on Engle-Granger cointegration test, and presented ranking analysis of nodes to distinguish their importance. Besides, time-dependent cross-correlation [15, 16, 17] is also applied to determine the linking direction between a pair of listed companies due to the time shift of maximum correlation. If the time shift is non-zero, the“pulling” effect is assumed to exist in these listed companies.
As an important emerging market, the Chinese stock market possesses unique properties, such as stronger cross-correlations and less market efficiency [18]. There are few works involved the unidirectional influence relationship [19, 20]. However, these results are obtained based on daily stock returns, thus may be debatable under the consideration of efficient market. In this paper, we mainly focus on the risk contagion in Chinese stock market, by constructing a directed influence network on the basis of time series of minute-by-minute price fluctuations with the time-dependent cross-correlation method, which is well behaved in American stock market[15]. Unlike previous literatures, we analyzed not only the global topological structure, but also the subnetworks of a few significant economic sectors in aim to explore the unique economic structure of China. Empirical results reveal three types of connectivity involving with the intra-sector’s influence relationship. We also compare several measurements of node’s centrality to find out available characterization of the importance of listed companies in this influence network. The findings provide intriguing information about the topological properties of Chinese stock market and give important hint about risk contagion in portfolio management.
2 Materials and Methods
2.1 Data sets
| Sector | Number | Sector | Number |
|---|---|---|---|
| Finance | 22 | Construction | 23 |
| Mining Industry | 30 | Energy | 42 |
| Manufacturing | 418 | Real Estate | 58 |
| Wholesale&Retail | 59 | Transportation | 47 |
| Lodging&Catering Service | 3 | Agriculture | 14 |
| Information Technology | 20 | Other Service | 1 |
| Lease&Business Service | 8 | Utility | 2 |
| Science&Technology Service | 1 | Healthcare | 1 |
| Public Management | 25 | Entertainment | 5 |
The data set consists of stocks (i.e, listed companies) trading in Shanghai security exchange (SSE). These stocks belong to 18 economic sectors, of which the name and size are shown in Tab. 1. The price fluctuations are sampled with minute frequency, which can quickly respond to interactive influence relationships among stocks. The duration is whole fiscal year of 2010, totally including 242 trading days with 4 hours working time. For the price fluctuation of each stock, its return at time scale is obtained by
| (1) |
We set =1 minute because larger may smear out of the maximum. and is denoted by for simplicity.
2.2 Time-dependent Cross-Correlation
To evaluate the interactive influence relationships among stocks, their time-dependent cross-correlations are calculated. Within a trading day , the correlation between stocks and can be calculated as
| (2) |
where and are the standard deviation of and and the parameter in is time shift. Changing , the are then averaged over trading days to filter the dairy effect [21, 22, 23], and the mean value is denoted by .
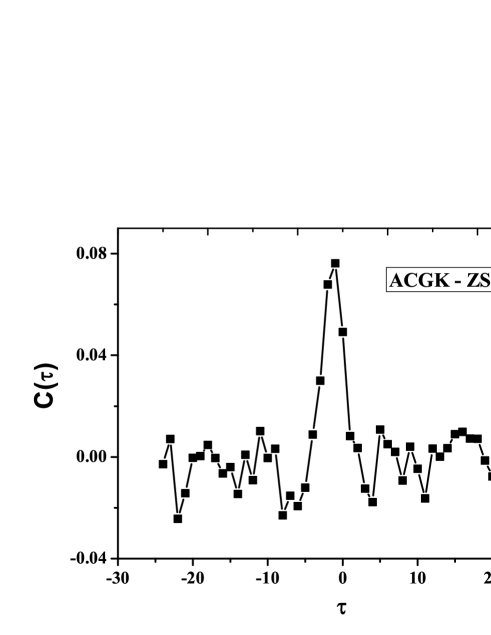
With a various value of , the corresponding are then obtained, of which the maximal value is selected, denoted as , and its related time shift as . For example, as shown in Fig. 1, between stocks (ACGK) and (ZSYH) changes with various , where is obtained at . It suggests that stock influences stock in their price fluctuations. Besides, to differentiate from to noise, the parameter is measured as the ratio of and the noise strength defined as the variance of all correlation values with time shift from the peak larger than 10 min because the largest peak width is 6 min.
2.3 Influence network construction
With time-dependent cross-correlations, the influence relationships of all pairs of stocks can be quantitatively measured. To construct a directed network describing influence relationships, we adopt the method proposed in [15], which emphasizes that three parameters , , and should exceeded certain threshold values simultaneously if the directed connection between stocks and exists. It is obvious that the topological structure of influence network has a direct relevance to these thresholds. Figure 2 shows the size of largest component as a function of and , respectively. One can see that the size of largest component decreases whenever improving the threshold value of or , because more links are filtered. And in both cases, there is a critical point when the full-connected network decomposes and the size of largest component decreases rapidly. Based on percolation-based method [11, 12], the value of phase transition point from full connection to isolated components is and . Moreover, is required.


In the influence network, link between stocks and are unidirectional, determined by the sign of . If , the current price of stock is affected by the previous one of stock , denoting the link direction from to . Otherwise, the link is directed to from if . It should be pointed out that, in our network, a directed link is set from to if influences , however, the reverse is also a feasible choice. When (i.e., the equal time cross-correlation), we recognize the mutual influence as an external effect. The price fluctuations of two stocks may be induced by the trend of stock market or environmental variation in the economic sector. Therefore, in this case, stock and aren’t connected.
In order to further get rid of the noises that the maximum of the correlation is attributed to occasional large values rather than a real association, the fiscal year are divided into three periods, in each period the is calculated, according to which an adjacent matrix is established, and only those links existed in all three periods are considered in the network to ensure the robustness of the result.
3 Empirical results
3.1 Analysis of influence network
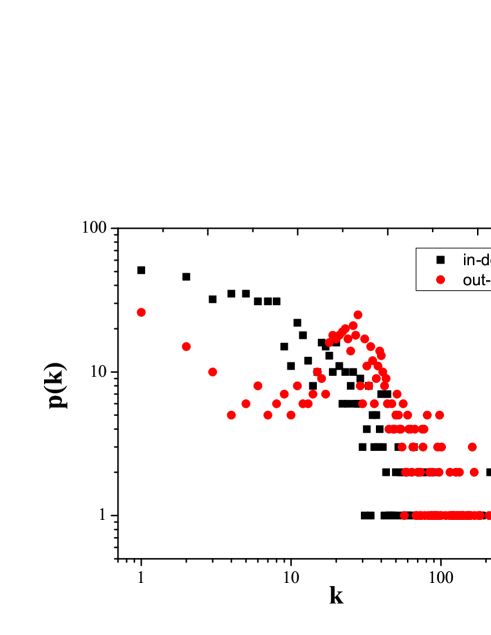
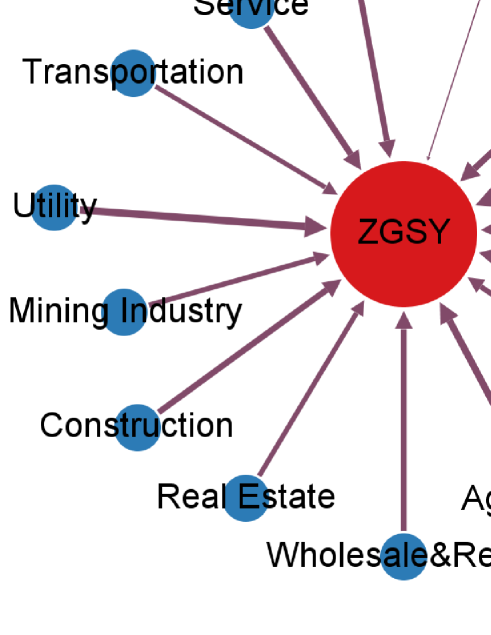
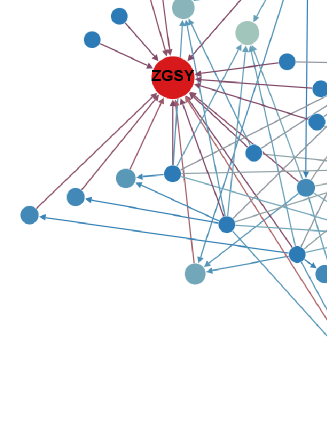
The resulting influence network has dense edges, with the average degree high to 34.84. Figure 3 shows the distributions of in-degree and out-degree, respectively. Both of them approximately decays in an exponential way when the degree is at a small scale. Nevertheless, the fat tail both in the in-degree and out-degree distributions reveals there are some hub-like nodes in the influence network. In other words, a few huge stocks can strongly influence, or even control the trend of Chinese stock market. In Tab. 2, it shows that the top-10 stocks with the highest in-degree are mainly distributed in Mining Industry and Finance sectors, and almost affect the whole stock market. For example, ZGSY, the largest listed company in China, influences the more than 600 stocks in all economic sectors, as shown in Fig. 4. However, it is interesting that the majority of all the economic sectors are influenced, except for that of finance, only a fraction of 3/22 are linked to ZGSY.
| Sector | Company | In-degree | Sector | Company | In-degree |
|---|---|---|---|---|---|
| Mining Industry | ZGSY | 616 | Finance | ZGTB | 594 |
| Finance | ZSYH | 585 | Finance | JTYH | 580 |
| Finance | HXYH | 578 | Finance | ZGRS | 551 |
| Finance | PFYH | 542 | Mining Industry | SHE | 538 |
| Finance | XYYH | 538 | Finance | BJYH | 511 |
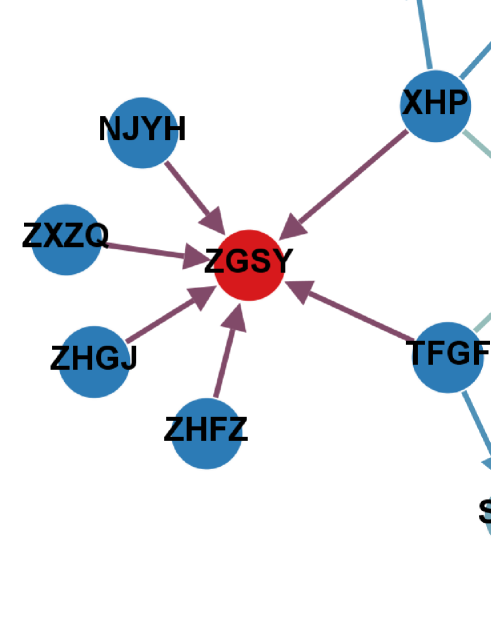
In addition, we also pay attention to the interactive influence relationships among stocks with top-50 in-degree. Figure 5 shows that there are only 12 directed connections, which suggests that these stocks are relatively independent, that is, their price fluctuations are parallel to each other. Nevertheless, ZGSY still plays an important role in this core as its in-degree is 6, equalling half of total connections.
Furthermore, we have noticed that those nodes with high in-degrees (namely more influence) have high capitalization. The positive correlation between influence and capitalization has been studied by Lo and MacKinlay [24] with weekly return data. To observe this effect in high-frequency return data, we calculate the difference of the assets of the two connected nodes as [25]
| (3) |
where represents equity capital, obtained by averaging equity capitals of the beginning and the end of 2010. Figure 6 shows the distribution of all values for the whole network. It can be found that the peak locates at rather than zero, and the shape of the peak is asymmetric, as the right side is more fatter. These properties clarify that smaller capitalized listed companies tend to be affected by bigger capitalized listed companies but not vice versa, which is in accordance with previous study, thus confirming the validity of this influence network. Take a note of the inset, the right tail tend to be growing, which is related to the fat tail of in-degree distribution.

In the above discussion, the most influential stocks are concerned. Beyond that, we also analyze the most influenced stocks represented by higher out-degree to better understand influence network. As shown in Tab. 3, the top-10 stocks with the highest out-degree are displayed, along with their economic sectors. One can see that they are completely different from those most influential ones. Compared to Tab. 2, their values of out-degree are much lower than that of in-degree, which suggests that these stocks are influenced by only a portion of other stocks, and these most influenced stocks are distributed to more diverse economic sectors, such as Manufacturing (5), Real Estate (2), Energy (1), Transportation (1), and WholesaleRetail (1). Nevertheless, it is easy to understand the difference because in stock market these influential stocks are able to pull others via cascading effect of network but those influenced stocks aren’t ensured to be attracted by all other ones.
| Sector | Company | Out-degree | Sector | Company | Out-degree |
|---|---|---|---|---|---|
| Manufacturing | SBGX | 223 | Real Estate | ZFGF | 220 |
| Manufacturing | BXGF | 210 | Manufacturing | SHSC | 183 |
| Energy | GDDL | 182 | Transportation | TJHY | 178 |
| Manufacturing | MYL | 168 | Wholesale&Retail | BHC | 167 |
| Manufacturing | FRYY | 167 | Real Estate | SQF | 162 |
3.2 Analysis of subnetworks in economic sectors
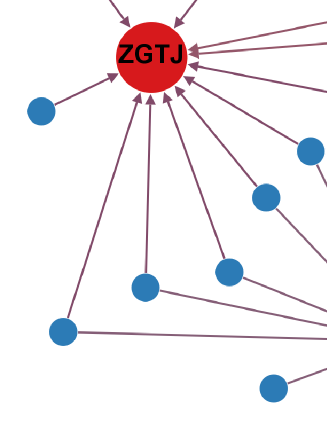
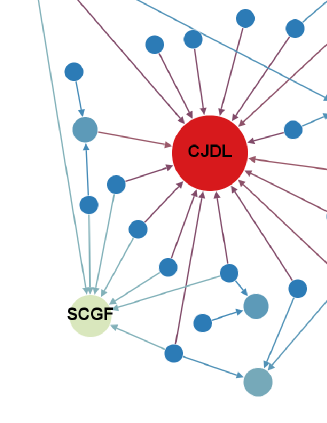
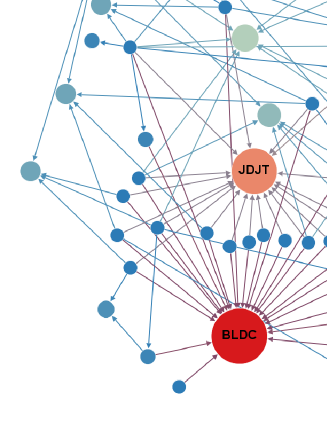
We have given an overview investigation of influence network at whole scale, however, information of interactive influence relationships in intra-sectors are required to be probed. Based on taxonomy of Chinese stock market, we obtain a series of subnetworks from whole influence network. Figure 7 shows 6 significant economic sectors, such as Construction, WholesaleRetail, Finance, Mining Industry, Energy, Real Estate. It can be found that the connection configurations are different from each other, on the basis of which the sectors can be classified into three types:
(1) There are few edges inside the sector, but hub nodes are apparent. For instance, in the sector of Construction (Fig. 7), there are two key nodes of highest in-degrees, corresponding to the industry heavyweights, ZGTJ and ZGZT. The same properties can also be found in the sector of Energy. As shown in Fig. 7, CJDL is the largest listed company in the sector of Energy, as well as the second largest one SCGF. The most susceptible vertex is GDDL.
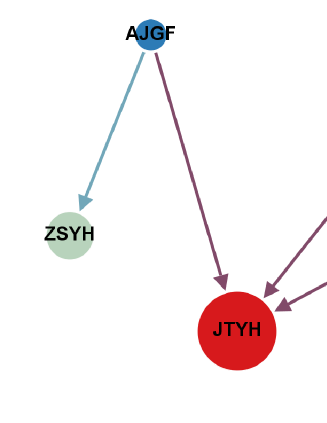
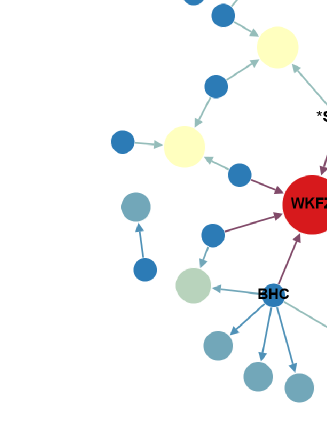
(2) The stocks rarely interact with others in the same sector, and also there are no apparent hub-like nodes as the distribution of in-degrees is approximately homogenous, such as Finance (Fig. 7) and Wholesale Retail (Fig. 7). Concretely, in Fig. 7, the relatively important nodes, denoted by red circle, is WKFZ (providing metals and metallurgical raw materials), two other susceptible nodes, *STSS and BHC, are also tagged. Although in the global network analyzed above, 8 of the top-10 in-degree nodes are financial stocks, which can affect a large quantity of nodes in the whole network, they barely influence each other, however. Furthermore, it is interesting that the Finance sector is insensitive to other sectors, yet they impact all the other sectors.
(3) The intra-sector influence relationships are much more considerable compared with the first two classes, and the industry giants can be observed easily from these subnetworks. In Fig. 7, the Mining industry has four huge listed companies, ZGSY, ZGSH, SHE, and XBKY. Besides, the two observed giants are BLDC and JDJT in the sector of Real Estate (Fig. 7).
3.3 Analysis of node centrality
| In-degree | PageRank | Eigenvector | Authority | Hub | Betweenness | |
|---|---|---|---|---|---|---|
| Equity | 0.4072 | 0.4072 | 0.4108 | 0.4072 | 0.0767 | -0.1905 |
| Assets | 0.3772 | 0.3773 | 0.3805 | 0.3773 | 0.0594 | -0.1938 |
It is a critical problem to evaluate the node importance in a directed network, and dozens of centrality metrics have been proposed, such as Betweenness Centrality (BC) [26, 27], Eigenvector Centrality (EC) [28], PageRank (PR) [29, 30], Hub and Authority [31], which derive from diversely local topological properties of influence network. However, it remains an unsolved issue which is the appropriate centrality measurement which can reflect the economic importance in a financial network. In this section, the ranking analysis of nodes based on these measurements are performed. On the other hand, the nodes are also ranked due to the capitalization of listed company, for which both total assets (including equity capital and liabilities) and equity capital are considered, denoted by assets and equity, respectively. The similarities of node ranking between assets and other centrality measurements are then calculated in terms of Kendall’s Tau (KT) coefficient [32], as well as equity. To keep our description in self-contained, we briefly introduce KT correlation. For two sequences and , , the KT coefficient is given by
| (4) |
Here for , while for , otherwise . The result is shown in Tab. 4.
One can see from Tab. 4 that all the KT coefficients of equity are higher than those of assets. This is consistent with empirical observations that the influence of a listed company is positively related to its market capitalization in the equity market. More concretely, we discuss the correlation between each centrality measurement and equity (or asset) as follows.
First, it is not surprising that BC is in negative correlation with assets. BC of a vertex is defined as the frequency that it is in the shortest path between any two other vertices. In the directed influence network, the shortest path between a pair of nodes is asymmetric. And the topological properties of the influence network have suggested that the important nodes are of large in-degrees and few out-degrees, therefore, their BC values are very small, even zero for those with zero out-degrees.
Second, Hub and Authority are two parameters of HITS. For a node, its hub is determined by the authority of out-degree neighbors, while its authority is confirmed by the hub of in-degree neighbors. Thus, in the influence network, the authority of a node with larger asset is higher due to its great number of in-degree neighbors, while its hub isn’t greatly larger than those of other nodes with less assets due to its smaller out-degree neighbors. On the other hand, most nodes with less assets connect collectively to those with larger assets, so no significant difference exists between their hub values. These explains the poor performance of hub, and better performance of authority.
Third, both PR and EC can well indicate node’s importance, suggested by the higher KT coefficient shown in Tab. 4. It is comprehensible because the two measurements have similar idea that the importance of a node depends not only on the numbers but also importance of its in-degree neighbors. Although there are some arguments of the eigenvector of a directed network [28], it is practical for nodes with high in-degree, which is suitable for the influence network in this paper. Also of note is that the low value of the KT coefficient is in concerned with the degree distribution. High in-degree nodes is of low out-degree, and the less important nodes is uniformly out-degree distributed.
4 Conclusion
In this paper, in order to investigate the interactively clustering behavior of listed companies induced by asymmetric market information, we have studied the influence network constructed from the time-dependent cross-correlation of stocks’ price fluctuations in Chinese stock market. The empirical results can be concluded in three aspects.
From the distribution of the asset difference of all pairs of connected nodes, the good performance of the network is verified in revealing the influence relationships among listed companies. However, the network is found to display singular topological properties in the in-degree distribution, which can be attributed to the existence of hub-like listed companies that can influence the majority of the Chinese stock market. The out-degree distribution, on the other hand, is more diverse.
In addition, the intra-sector influence relationship is also analyzed from subnetworks of a few economic sector involved with Chinese economy. The topological structure of the subnetworks differs among sectors in connectivity and hub nodes. Three configurations are identified: Few edges with apparent hub nodes as Construction; Few edges without hub nodes, such as WholesaleRetail trades and Finance; Lots of links with apparent hub vertices, like Mining Industry, Energy, and Real Estate. These results gives important information in price fluctuations in the stock market, that is, they implies that the asymmetric market information transferring from one economic sector to whole stock market behaves diverse dynamic patterns. These may have significant applications for portfolio management and risk diversification.
In order to figure out which algorithms can characterize critical nodes in the influence network, we calculated the similarities between several centrality measurements and assets of listed companies, which is regarded as an indicator of their importance in Chinese stock market. We found that the in-degree, PR, EC, as well as authority better characterize the importance of listed companies, while BC and hub fail to.
Acknowledgments
The authors acknowledge the support of National Natural Science Foundation of China (Grant No. 71472025) and China Postdoctoral Science Foundation (Grant No. 2014M552350).
References
References
- [1] V. Plerou, P. Gopikrishnan,B. Rosenow ,L. A. NunesAmaral, and H. E. Stanley, Physical Review Letters 83, 1471 (1999).
- [2] L. Laloux, P. Cizeau, J. P. Bouchaud, and M. Potters, Physical Review Letters 83, 1467 (1999).
- [3] D. H. Kim and H. Jeong, Physical Review E 72, 046133 (2005).
- [4] X. F. Jiang and B. Zheng, EPL 97, 48006 (2012).
- [5] R. N. Mantegna, Eur. Phys. J. B 11, 193 (1999).
- [6] G. Bonanno, G. Caldarelli, F. Lillo, and R. N. Mantegna, Physical Review E 68, 046130 (2003).
- [7] J. P. Onnela, A. Chakraborti, K. Kaski, J. Kertész, and A. Kanto, Physical Review E 68, 056110 (2003).
- [8] J. P. Onnela, K. Kaski, and J. Kertész, Eur. Phys. J. B 38, 353 (2004).
- [9] M. Tumminello, T. Aste, T. Di Matteo, and R. N. Mantegna, Proc. Natl. Acad. Sci. USA 102, 10421 (2005).
- [10] D. Y. Kenett, M. Tumminello, A. Madi, G. G. Gershgoren, and R.N. Mantegna, PLoS One 5, 0015032(2010).
- [11] S. M. Cai, Y. B. Zhou, T. Zhou, and P. L. Zhou, Int. J. Mod. Phys. C 21, 433 (2010).
- [12] Y. C. Gao, Z. W. Wei, and B. H. Wang, Int. J. Mod. Phys. C 24, 1350005 (2013).
- [13] R. F. Engle and C. W. J. Granger, Econometrica 55, 251 (1987).
- [14] C. X. Yang, Y. H. Chen, L. Niu, and Q. Li, Physica A 400, 168 (2014).
- [15] L. Kullmann, J. Kertész, and K. Kaski, Physical Review E 66, 026125 (2002).
- [16] B. Tothó, and J. Kertész, Physica A 360:505-515 (2006).
- [17] S. Y.Lee, D.Hwang, M.J.Kin, I.G.Koh, and S.Y.Kim, Physica A 390:837-846 (2011).
- [18] Y. C. Gao, S. M. Cai, and B. H. Wang, J. Stat. Mech. 12, P12016 (2012).
- [19] Y.Mai, H.Chen, and L. Meng, Physica A 396:235 (2014).
- [20] C.Y.Tu, Physica A 402:245 (2014).
- [21] L. Harris, J. Finan. Econom. 16, 99 (1986)
- [22] A. Admati and P. Pfleiderer, Rev. Financ. Stud. 1, 3 (1988)
- [23] P. D. Ekman, J. Future Markets 12, 365 (1992).
- [24] A.Lo, A.C.MacKinlay, Rev. Fiance Stud. 3:175-205 (1990).
- [25] W. J. Xie, M. X. Li, Z. Q. Jiang, and W. X. Zhou, Scientific Rep. 4, 5244(2014).
- [26] L. C. Freeman, Sociemetry 40, 35 (1977).
- [27] M. E. J. Newman, Soc. Netw. 27, 39 (2005).
- [28] M. E. J. Newman, Networks: An introduction, New York: Oxford (2010).
- [29] P. Berkhin, Internet Math. 2, 73 (2005).
- [30] K. Bryan and T. Leise, SIAM Rev. 48, 569 (2006).
- [31] J. M. Kleinberg, J. ACM 46, 604 (1999).
- [32] M. Kendall, Biometrika 30, 81 (1938).
APPENDIX
| Label 111Label is the trading ticker of each security on sale in SSE. | Symbol | Name |
|---|---|---|
| 600234 | *STSS222Companies with *ST (Special treatment) in the stock ticker is in abnormal financial situation for three consecutive years. | Guanghe landscape Culture Communication |
| 600550 | *STTW | Baoding Tianwei Baobian Electric Co. |
| 600207 | ACGK | Henan Ancai Hi-tech Co. |
| 600643 | AJGF | Shanghai Aj Corporation |
| 600721 | BHC | Xinjiang Baihuacun Co. |
| 601169 | BJYH | Bank Of Beijing Co. |
| 600048 | BLDC | Poly Real Estate Group Co. |
| 600083 | BXGF | Guangdong Boxin Investing & Holdings Co. |
| 600900 | CJDL | China Yangtze Power Co. |
| 600781 | FRYY | Furen Pharmaceutical Group Co. |
| 600310 | GDDL | Guangxi Guidong Electric Power Co. |
| 600382 | GDMZ | Guangdong Mingzhu Group Co. |
| 600109 | GJZQ | Sinolink Securities Co. |
| 600015 | HXYH | Hua Xia Bank Co. |
| 600383 | JDJT | Gemdale Corporation |
| 601328 | JTYH | Bank Of Communications Co. |
| 600993 | MYL | Mayinglong Pharmaceutical Group Stock Co. |
| 601009 | NJYH | Bank Of Nanjing Co. |
| 600000 | PFYH | Shanghai Pudong Development Bank Co. |
| 600604 | SBGX | Shanghai Shibei Hi-Tech Co. |
| 600008 | SCGF | Beijing Capital Co. |
| 600018 | SGJT | Shanghai International Port (Group) Co. |
| 601088 | SHE | China Shenhua Energy Company |
| 600009 | SHJC | Shanghai International Airport Co. |
| 600841 | SHSC | Shanghai Diesel Engine Co. |
| 600733 | SQF | Chengdu Qianfeng Electronics Co. |
| 600100 | TFGF | Tsinghua Tongfang Co. |
| 600751 | TJHY | Tianjin Marine Shipping Co. |
| 600058 | WKFZ | Minmetals Development Co. |
| 600173 | WLDC | Wolong Real Estate Group Co. |
| 601168 | XBKY | Western Mining Co. |
| 600139 | XBZY | Sichuan Western Resources Holding Co. |
| 600657 | XDDC | Cinda Real Estate Co. |
| 600638 | XHP | Shanghai New Huang Pu Real Estate Co. |
| 600755 | XMGM | Xiamen International Trade Group Corp. |
| 600369 | XNZQ | Southwest Securities Co. |
| 601166 | XYYH | Industrial Bank Co. |
| 601766 | ZGNC | CSR Corporation |
| 600890 | ZFGF | Cred Holding Co. |
| 601628 | ZGRS | China Life Insurance Company |
| 600028 | ZGSH | China Petroleum&Chemical Corporation |
| 601857 | ZGSY | Petrochina Company |
| 601601 | ZGTB | China Pacific Insurance (group) Co. |
| 601186 | ZGTJ | China Railway Construction Corporation |
| 601390 | ZGZT | China Railway Group |
| 600026 | ZHFZ | China Shipping Development Company |
| 600036 | ZSYH | China Merchants Bank Co. |
| 600030 | ZXZQ | CITIC Securities Company |