The Evolution of Interacting Spiral Galaxy NGC 5194
Abstract
NGC 5194 (M51a) is a grand-design spiral galaxy and undergoing interactions with its companion. Here we focus on investigating main properties of its star-formation history (SFH) by constructing a simple evolution model, which assumes that the disc builds up gradually by cold gas infall and the gas infall rate can be parameterizedly described by a Gaussian form. By comparing model predictions with the observed data, we discuss the probable range for free parameter in the model and then know more about the main properties of the evolution and SFH of M51a. We find that the model predictions are very sensitive to the free parameter and the model adopting a constant infall-peak time can reproduce most of the observed constraints of M51a. Although our model does not assume the gas infall time-scale of the inner disc is shorter than that of the outer disc, our model predictions still show that the disc of M51a forms inside-out. We find that the mean stellar age of M51a is younger than that of the Milky Way, but older than that of the gas-rich disc galaxy UGC 8802. In this paper, we also introduce a ’toy’ model to allow an additional cold gas infall occurred recently to imitate the influence of the interaction between M51a and its companion. Our results show that the current molecular gas surface density, the SFR and the UV-band surface brightness are important quantities to trace the effects of recent interaction on galactic SF process.
keywords:
galaxies: abundance — galaxies: photometry — galaxies: evolution — galaxies: individual: M51a — galaxies: spiral1 Introduction
M51a is one of the nearest galaxies with grand-design spiral arms. The outstanding point of this galaxy is that it is known to be interacting with its companion galaxy NGC 5195 (the interacting system NGC 5194 + NGC 5195 is often called as M51). Coupled with its large angular size, nearly face-on inclination, high surface brightness and kinematic complexity, many studies about M51a have been carried out using various wavelengths and methods.
With respect to dynamic study, M51a is a very good target to explore the nature and origin of spiral structure. Two opposite scenarios dominate the discussion in the literature. One theory considers that the spiral arms are a long lasting pattern that slowly evolves and rotates with a single angular speed (Lin & Shu, 1964), while the other assumes the arms to be transient disturbances generated, e.g., by the tidal interaction with a companion (Toomre & Toomre, 1972). In the seminal kinematic study of M51a, Tully (1974) identified the spiral pattern in the outer disc as transient feature, while the inner arms are thought to be in a steady state. Indeed, Colombo et al. (2014) showed the kinematic evidence of an wave in the inner disc of M51a, which may suggest the density-wave nature of the main spiral structure of M51a. On the other hand, many kinematic and hydrodynamical models showed evidence that, instead of quasi-steady density wave, the internal structure of M51a drives from the complicated and dynamical interaction with its companion (Dobbs et al., 2010; Salo & Laurikainen, 2000; Theis & Spinneker, 2003).
In addition to its dynamics, M51a is also a test bed to understand the effects of galaxy interacting on its star formation (SF) process by investigating its stellar populations. Early observations have already shown that the blue and yellow-red stellar populations within M51 are spatially separate structures (Zwicky, 1955). Later investigations of star clusters in M51a revealed that the star cluster formation rate increased significantly during the period of 100-250 Myr ago, which is consistent with the epoch of the dynamic encounters of these two galaxies (Lee et al., 2005; Hwang & Lee, 2008, 2010). Kaleida & Scowen (2010) also found that there was an enhancement in the number of young stellar associations in the northern arm closest to the companion, most likely triggered by the interaction of M51a and NGC 5195. Through the spectral energy distribution modeling of the multi-bands images of the M51 system, Mentuch Cooper et al. (2012) revealed a burst of star formation occurred in both galaxies roughly 340-500 Myr ago, which is in agreement with the results of the colour-magnitude diagrams of individual stars (Tikhonov et al., 2009). Moreover, Lee et al. (2011) found evidence that the tidal interaction between M51a and its companion appeared to enhance the SF process at the tidal bridge connecting the two galaxies.
On the other hand, although the parameterized models have already been applied to several individual galaxies and proven to be fruitful tools to explore galactic formation and evolution (Tinsley, 1980; Chang et al., 1999, 2012; Boissier & Prantzos, 2000; Chiappini et al., 2001; Yin et al., 2009; Kang et al., 2012), there is still lack of similar investigation on M51a partially due to the complexity caused by the on-going interacting between M51a and its companion. In this paper, we construct a simple evolution model for M51a to build a bridge between its SFH and its observed properties, especially the radial distributions of cold gas surface density, metallicity, and the radial profiles of surface brightness in multi-bands. We present a parameterized description of the gas cooling process of the disc of M51a and adopt the local SF law in the model to calculate its star formation rate (SFR) using the cold gas surface density. Then, our model can predict the SFH, the chemical and colour evolution of M51a, with the help of stellar population synthesis (SPS) method. By comparing model predictions with the observed data, we can discuss the probable ranges for free parameters in the model and then know more about the main properties of the evolution and SFH of M51a.
The paper is structured as follows. Section 2 describes the observed features of M51a disc, including the surface brightness, the cold gas content, the SFR and the metallicity. In Section 3 we present the main assumptions and ingredients of our model in details. The comparisons between model predictions and observations and our main results are shown in Section 4. Our main conclusions are presented in Section 5.
2 Observations
M51a is one of the closest (the distance: ; Walter et al., 2008), face-on (inclination: ; Tully, 1974) SA(s)bc spiral galaxy and many of its basic quantities have already been measured (Hu et al., 2013). A summary of the main properties of M51a is shown in Table 1, most of which are adopted to constrain our model.
In this Section, we summarize the current available observations of M51a, especially the radial distributions along the disc, including the surface densities of gas mass and SFR, surface brightness and metallicity.
| Hubble type | SA(s)bc | 1 |
| Distance | 8.0 Mpc | 2 |
| Inclination | 3 | |
| -24.19 mag | 4 | |
| Stellar mass | 5 | |
| Hi mass | 5, 6 | |
| H2 mass | 5, 6 | |
| SFRFUV+24μm | yr-1 | 5 |
| SFRHα | yr-1 | 7 |
| SFRRC-20cm | yr-1 | 8 |
2.1 Radial profiles of surface brightness
The radial surface brightness profiles in multi-band of a spiral galaxy contain fossil information about the SFH along the galactic disc and provide strong constraints on the models of galactic formation and evolution.
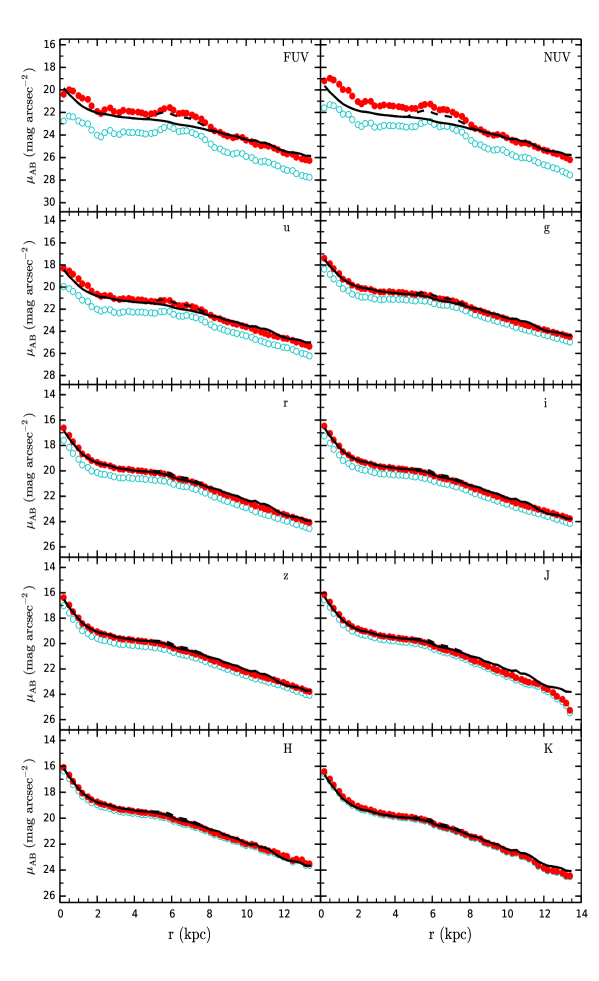
The catalog data of the radial profiles of surface brightness for M51a in the ultraviolet bands (UV; Galaxy Evolution Explorer, GALEX for short), optical bands (Sloan Digital Sky Survey, SDSS for short), and near-infrared bands (NIR; Two-Micron All-Sky Survey, 2MASS for short) have been published by Muñoz-Mateos et al. (2009, MM09I hereafter), but all these values were only corrected for foreground Galactic extinction and still in lack of internal extinction correction. We adopt the method presented by Lin et al. (2013) to estimate the internal extinction profile in the FUV band . Then, following the prescriptions of Boselli et al. (2003) and Cortese et al. (2008), we calculate the internal extinction in other wavelengths by assuming a given extinction law and a geometry for the distribution of stars and dust. The radial surface brightness profiles in FUV-, NUV-, -, -, -, -, -, -, - and -band are plotted in the left-hand side of Fig. 3 and Fig. 4, where the open circles show the observed profiles only corrected for the Galactic extinction and the filled ones also include a correction for the radial variation of internal extinction.
The surface brightness in the -band has another application. Since the -band luminosity is most sensitive to the old stellar population and less effected by dust attenuation than other bands, we adopt the -band mass-to-light ratio to be (Bell et al., 2003; Leroy et al., 2008), and then utilize the observed -band surface brightness profile (Muñoz-Mateos et al., 2009) to estimate the present-day stellar mass surface density profile , where is the cosmic age and we set according to our adopted cosmology (see Section 3). We will use derived here as our primary input parameter to constrain the total mass infalling to the disc.
2.2 Radial profiles of cold gas and SFR
During the past years, a number of data sets relating to the atomic and molecular gas surface density in M51a are becoming available.
In spirals, the CO line emissions are usually used to estimate the molecular gas mass surface density . Imaging of molecular clouds has recently been carried out in M51a with the Berkeley-Illinois-Maryland Association (BIMA) interferometer using the CO line transition (Helfer et al., 2003). Observations of the CO emission in M51a were conducted with the Institute de RadioAstronomie Millimétrique (IRAM) 30m telescope using the 18 element focal plane heterodyne receiver array HERA (Schuster et al., 2004). Observations of CO emission for M51a were also carried out using the 45-m telescope of the Nobeyama Radio Observatory (NRO) with the beam SIS heterodyne receiver array (BEARS). Schuster et al. (2007) derived with the help of the CO line from HERA focal plane array, while others used the CO line maps from BIMA and BEARS to obtain (Kennicutt et al., 2007; Leroy et al., 2008; Miyamoto et al., 2014).
To derive the surface density of neutral atomic hydrogen of M51a, Kennicutt et al. (2007), Leroy et al. (2008) and Miyamoto et al. (2014) used Very Large Array (VLA) maps of the 21 cm line obtained as part of The Hi Nearby Galaxy Survey (THINGS) (Walter et al., 2008). Schuster et al. (2007) estimated the corresponding surface density from the large-scale distribution of the 21c m line of atomic hydrogen in M51a analyzed by Rots et al. (1990) using the VLA.
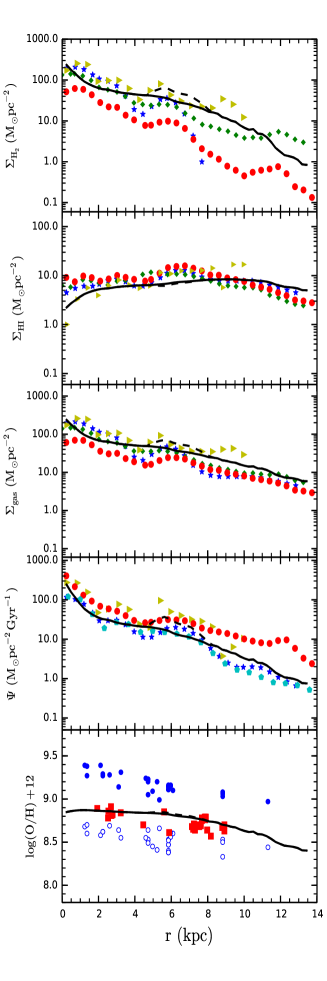
The sum of the surface density of atomic and molecular gas is often called as the total gas surface density, i.e., , and the factor 1.36 is to include the contribution of helium. The observed radial distributions of molecular, atomic and total gas mass surface density are plotted in the right-hand side of Fig. 3 and Fig. 4, where the plotted data are taken from Schuster et al. (2007) (filled circles), Kennicutt et al. (2007) (filled triangles), Leroy et al. (2008) (asterisks) and Miyamoto et al. (2014) (filled diamonds).
With respect to the radial distribution of the SFR, several groups have already measured the SFR surface density, , in the disc of M51a using different tracers. The radio-continuum at 20 cm wavelength is used to estimate by Schuster et al. (2007). Kennicutt et al. (2007) used Pa and a combination of and H emission to obtain . Leroy et al. (2008) combined FUV and maps to estimate . Heesen et al. (2014) obtained the radial distribution of the from radio-continuum emission.
The right fourth panel of Fig. 3 and Fig. 4 plots the radial profiles of SFR surface density, . The data taken from Schuster et al. (2007) and Heesen et al. (2014) are shown as filled circles ( RC emission) and the filled pentagons ( RC emission), respectively. The data obtained from Leroy et al. (2008) are represented by the the filled asterisks (24), while that from Kennicutt et al. (2007) are denoted by filled triangles (24).
2.3 Radial profiles of metallicity
The observed metallicity gradient is another important constraint on the models of the galactic evolution. Except for hydrogen and helium, oxygen is the most abundant element in the Universe (Korotin et al., 2014), and oxygen abundance is easily measured in Hii regions because of its bright emission line. In practice, the oxygen abundance is sometimes used to represent the metallicity of the galaxy.
The observed oxygen abundance gradients of Hii regions in M51a disc have been estimated by several authors. Based on analysis of a sample of 10 Hii regions with high-quality electron temperatures measurements, Bresolin et al. (2004) derived an oxygen radial gradient of . Moustakas et al. (2010) adopted two calibration methods to convert line strength to oxygen abundance and obtained two values of radial gradient. One is by using the theoretical calibration method of Kobulnicky & Kewley (2004, KK04 hereafter) and the other is by adopting the empirical calibration method of Pilyugin & Thuan (2005, PT05 hereafter). Pilyugin et al. (2014) obtained an oxygen radial gradient of .
The observed oxygen abundance profile of the M51a disc is shown in the right bottom panel of Fig. 3 and Fig. 4. The cycles represent the observed data obtained from Moustakas et al. (2010), where the open and filled circles are derived by the PT05 and KK04 calibration method, respectively. In the same panel, the data from Pilyugin et al. (2014) are shown as filled squares.
However, the true situation of the oxygen abundance gradient in the M51a disc is still not fixed. The main uncertainty comes from the calibration methods used to derive chemical abundance. In addition, the data might suffer from lack of large enough samples. In any case, a larger and homogeneous sample of Hii regions which spread the whole M51a disc is needed in order to have conclusive results about the real oxygen abundance gradients.
3 The Model
Similar to previous models of the Milky Way (Chang et al., 1999; Chiappini et al., 2001; Matteucci et al., 2009) and other nearby disc galaxies (Boissier & Prantzos, 2000; Mollá & Díaz, 2005; Dalcanton, 2007; Yin et al., 2009; Muñoz-Mateos et al., 2011; Kang et al., 2012; Chang et al., 2012; Robles-Valdez et al., 2013), we assume that the M51a disc is progressively built up by the infall of primordial gas () from its dark matter halo. The disc is basically assumed to be sheet-like and composed of a series of independently evolved rings with width 500 pc, in the sense that no radial mass flows are considered.
Throughout this paper we adopt the standard cold dark matter cosmology with , , and . Correspondingly, the cosmic time at is . The details and essentials of our model are described as follows.
3.1 Gas infall rate
We assume that there is a time delay for the disc formation, which corresponds to under the standard cosmology. After that, the disc originates and grows by continuous primordial gas infall from the dark matter halo. We adopt a Gaussian formula of the gas infall rate from Chang et al. (1999, 2012).
For the given radius , the infall rate (in units of ) is assumed to be:
| (1) |
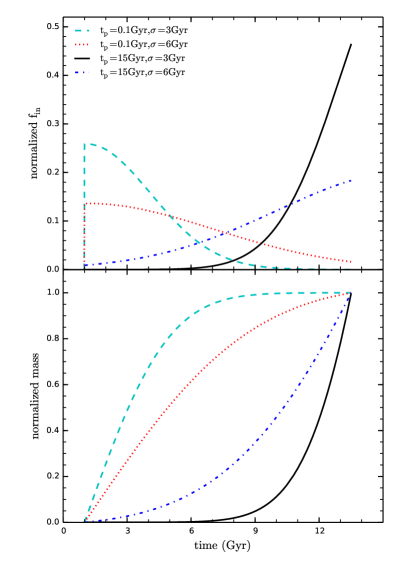
where is the infall-peak time and is the full width at the half-maximum of the peak. The is a set of normalized quantities constrained by the stellar mass surface density at the present time . To explore how and regulate the shape of the gas infall rate, Fig. 1 plots the normalized gas infall rate (upper panel) and the corresponding total infall gas surface density (lower panel), which is defined as how many cold gas have already been cooled to the given ring at time and normalized to 1 at the present time. Different line types correspond to various parameter groups . We select and to represent the extreme case which corresponds to a time-decreasing infall rate and a time-increasing one, respectively. It can be seen from Fig. 1 that the degeneracy of and does exit in that the combination of small and large results in a similar shape of mass accretion curve comparing that of large and small . Since our main aim is to investigate the main trend of SFH for M51a but not to find the exact values of free parameters, for the purpose of simplicity, we choose to reduce the number of free parameters in our model by treating as the free parameter and fixing in the following section of this paper (Chang et al., 2010, 2012).
We should point out that, in previous works by Hou et al. (2000), Chiappini et al. (2001) and Yin et al. (2009), an exponential form of gas infall rate with one free parameter is widely adopted in models of galactic chemical evolution. But, in these models, the gas infall rate always decreases with time and the most extreme case corresponds to a constant one. Therefore, we adopt a Gaussian formula of infall rate in this paper to include more possibilities, especially the time-increasing gas infall rate.
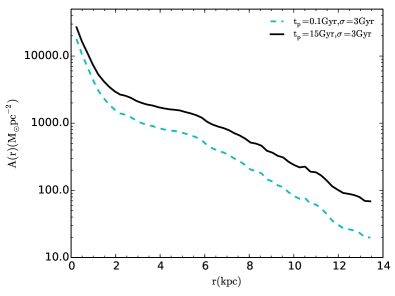
The normalized quantities in Equ. (1) control how many cold gas finally cool to the disc as a function of radius. In practice, we iteratively estimate by requiring the model resulted stellar mass surface density at the present time is equal to its observed value (Chang et al., 2010, 2012; Kang et al., 2012). In our calculation, after fixing the values of and , we give an initial value of and numerically calculate the gas evolution and the increase of stellar mass. By comparing the resulted with its observed value, we adjust the value of A(r) and repeat the calculation untill the resulted is comparable to its observed value. Fig. 2 plots the resulted radial profile of A(r), where the dashed and solid lines are corresponding to two limiting cases of and , respectively. It shows that the A(r) does vary with . But we do not treat A(r) as free parameter in our model since it is roughly fixed for given .
Regarding the stellar mass profile at the present time, in our previous works such as Chang et al. (2012) and Kang et al. (2012), we assumed that the stellar disc is a pure exponential disc and the value of is constrained by the quantities of total stellar mass and radial scale-length, which are usually obtained from the observed radial profiles of surface brightness plusing the exponential disc assumption. In this paper, we regard as a set of individual quantities and can be directly estimated from the observed radial profile of -band surface brightness by adopting a constant mass-to-light ratio (see Section 2.1 for details). Since this method includes much more spatial structures than the previous ones, it permits us to more reasonably calculate the multi-band radial profiles of surface brightness and compare with the observations in details.
3.2 Star formation law
SF process plays an important role in regulating the evolution of galaxies. Unfortunately, the SF process is so complicated that its underlaying physical nature is still not completely understood (Kennicutt et al., 2007). Most models of the galactic evolution still rely on the empirical SF law, which connects the local cold gas surface density to the SFR surface density, to describe how much cold gas converts into stellar mass in each time step (Boissier & Prantzos, 2000; Chiappini et al., 2001; Yin et al., 2009; Chang et al., 2012; Kang et al., 2012).
Based on the observed data of a sample of 97 nearby normal and star-burst galaxies, Kennicutt (1998) found a power-law correlation between the galaxy-averaged SFR surface density and the galaxy-averaged total gas surface density, which was termed as the classical Schmidt-Kennicutt SF law and widely adopted in the studies of galactic formation and evolution. But a more fundamental way is to use spatially resolved measurements of the SFR and gas surface density to examine the correlations between the observables on a point-by-point basis within galaxies. Indeed, the studies of the spatially resolved SF law have been applied to several nearby spiral galaxies (Kennicutt et al., 2007; Leroy et al., 2008; Bigiel et al., 2008; Schruba et al., 2011). In the case of M51a, using the observed multiwavelength data, Schuster et al. (2007) and Kennicutt et al. (2007) independently investigated the spatially resolved SF law along the disc of M51a. Kennicutt et al. (2007) found that the resolved SFR versus gas surface density relation is well represented by a Schmidt power law, which is similar in form and dispersion to the disc-average Schmidt-Kennicutt law.
In our model, we adopt the SF law of M51a presented by Kennicutt et al. (2007):
| (2) |
where (in units of ) is the SFR surface density, and (in units of ) is the gas surface density, which is the sum of the surface density of the atomic and molecular gas. We assume that , where and are the surface density of atomic and molecular hydrogen, and the factor 1.36 is to reflect the contribution of helium.
Regarding the ratio of molecular-to-atomic gas surface density , we adopt the formula presented by Blitz & Rosolowsky (2006) and Leroy et al. (2008),
| (3) |
where is the mid-plane pressure of the interstellar medium (ISM), and are constants derived from the observations. We adopt and derived by Hitschfeld et al. (2009) for M51a.
The mid-plane pressure of the ISM in disc galaxies can be expressed as (Elmegreen, 1989; Leroy et al., 2008):
| (4) |
where is the gravitational constant, and and are the (vertical) velocity dispersions of gas and stars, respectively. Observations reveal that is a constant along the disc and we adopt (Ostriker et al., 2010), but is estimated as , where is the scale-height of the disc and we adopt (Hitschfeld et al., 2009).
3.3 Other ingredients and basic equations
We also take into account the contribution of the gas outflow process in our model. According to the mass-dependent model of Chang et al. (2010), we assume that the gas outflow rate is proportional to the SFR and the coefficient is set to be . It should be emphasized that our final results is not sensitive to the variation of since the outflow process plays a relatively small role in the chemical evolution of such a massive galaxy as M51a (the stellar mass of M51a is about ).
We adopt the updated SPS model of Bruzual & Charlot (2003) (i.e., CB07) with the stellar initial mass function (IMF) being taken from Chabrier (2003) in our work. The lower and upper mass limits are adopted to be and , respectively.
Regarding the chemical evolution of the disc of M51a, both the instantaneous-recycling approximation and the instantaneous mixing of the gas with ejecta are assumed, that is, the gas in a fixed ring is characterized by a unique composition at each epoch of time. We take the classical set of equations of galactic chemical evolution from Tinsley (1980):
| (5) |
| (6) |
| (7) |
where is the total (star + gas) mass surface density. is the metallicity in the ring centered at galactocentric distance at evolution time . is the return fraction and we set according to the adopted IMF. is the stellar yield and we set (Chang et al., 2010; Kang et al., 2012). is the metallicity of the infalling gas and we assume the infalling gas is primordial, that is . is the metallicity of the outflowing gas and we assume that the outflow gas has the same metallicity as that of ISM, e.g., (Chang et al., 2010; Kang et al., 2012).
We emphasize that, under the condition that we have already fixed and A(r), there is only one free parameter left in our model, the infall-peak time , which regulates the shape of gas accretion history and then largely influences the main properties of SFH along the disc and then the evolution of M51a. Generally speaking, is corresponding to a time-declining infall rate, while is corresponding to a time-increasing gas infall rate. By comparing model predictions with the observed data, we can discuss the probable range of the free parameter in the model and then know more about the main properties of the evolution and SFH of M51a.
4 Model Results Versus Observations
In this section, we present our results step by step. Firstly, we investigate the influence of the free parameter on our model predictions and present the viable model of the evolution of M51a. Furthermore, we explore the properties of stellar population along the disc and compare the growth history of M51a with that of UGC 8802 and the Milky Way.
4.1 Radial profiles
| SFR | |||||
|---|---|---|---|---|---|
| (Gyr) | (mag) | () | |||
| -24.17 | 1.86 | 2.16 | 1.04 | 0.07 | |
| -24.84 | 6.92 | 2.96 | 5.02 | 0.17 | |
| -26.08 | 38.22 | 3.21 | 49.75 | 0.46 |
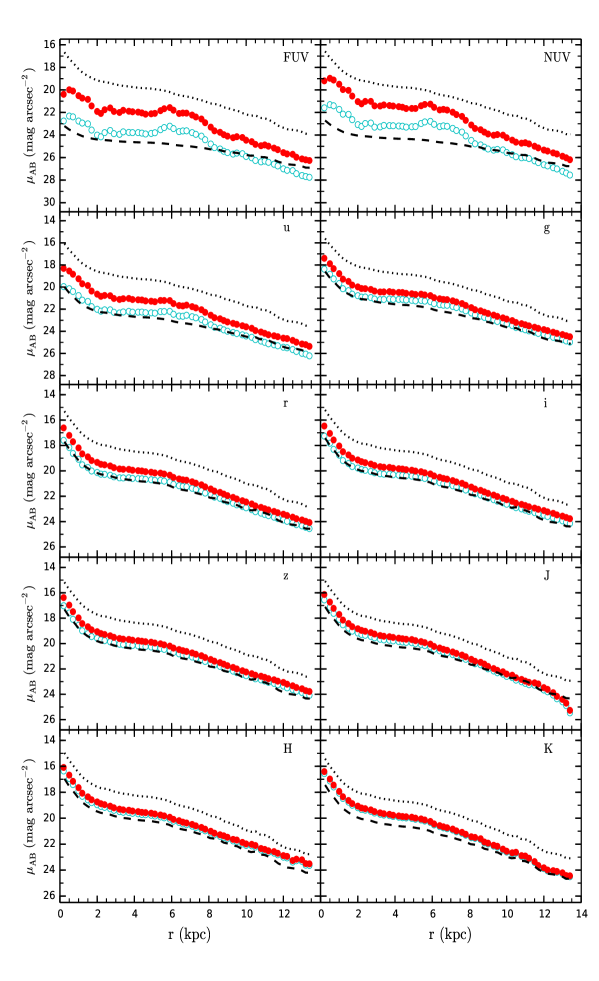
To explore the influence of free parameter on model results, we firstly consider two limiting cases of and and present the comparison between model predictions of the radial profiles and the observations in Fig. 3. The dashed and dotted lines in Fig. 3 denote the predictions of the models adopting and , respectively. The left-hand side of Fig. 3 displays the radial multi-bands surface brightness profiles from FUV-band to -band, where the open circles show the observed profiles only corrected for the Galactic extinction and the filled ones also include a correction for the radial variation of internal extinction. The right-hand side of Fig. 3 shows the , HI and total gas mass surface density, SFR surface density, and oxygen abundance radial profiles. The details of the observed data are presented in Section 2.
Large differences between dashed and dotted lines in Fig. 3 shows that the model predictions are very sensitive to the adopted . The case of (dashed lines) corresponds to a time-decreasing gas-infall rate that most of the gas has been accreted to the disc in the early period of its history, while that of (dotted lines) corresponds to a time-increasing gas infall-rate that a large fraction of cold gas is still infalling to the disc at the present time. It can be seen that the model adopting the earlier infall-peak time (dashed lines) predicts less luminous surface brightness, lower molecular gas surface density, lower SFR surface density and higher gas-phase oxygen abundance than that adopting a later infall-peak time (dotted lines). This is mainly due to the fact that, in our model, the setting of earlier infall-peak time corresponds to a faster gas accretion and higher SF process in the earlier stage of its history and then leads to the older stellar population age, higher gas-phase metallicity and lower cold gas content at the present day.
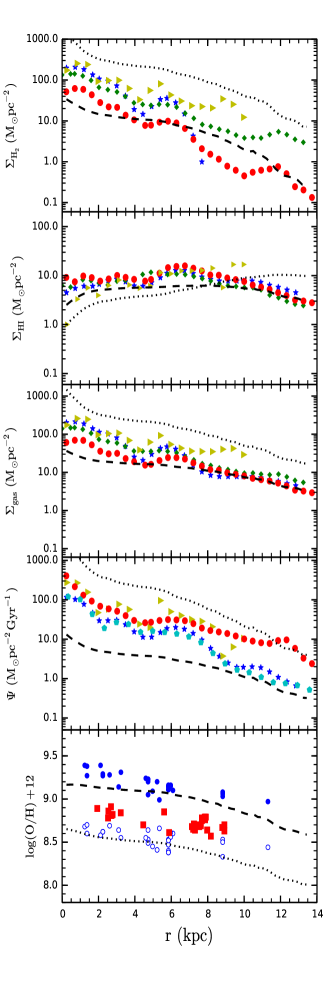
Interestingly, we can see from Fig. 3 that the area between the dashed and dotted lines brackets almost the whole region of the observations, which indicates that it is possible to construct a model that can reproduce the main features of the observations of the M51a disc. In fact, these two extreme cases ( and ) are bracketing the possible range of our model results, from where we can see the variation trends of the model predictions with different value of . After a series of calculations and comparisons, we obtain a viable model by adopting the infall-peak time and plot its results as solid lines in Fig.4. The notation of observed data is the same as that of Fig.3. We can see from Fig. 4 that the solid lines can basically reproduce most of the observational data, which indicates that our viable model includes and describes reasonably the key ingredients of the main processes that regulate the formation and evolution of M51a.
To further understand the effect of on the evolution of M51a, Table 2 summarizes the model predictions of the present total quantities of M51a, including the absolute K-band magnitude , the molecular gas mass , the atomic gas mass , SFR and the gas fraction . Three different values of () are considered, which corresponds to the dashed, dotted lines in Fig. 3 and solid lines in Fig.4. It can be seen from Table 2 that the model adopting a later infall-peak time predicts higher SFR and higher gas fraction. The predictions of the viable model adopting are in fairy agreement with the corresponding physical properties in Table 1 considering the observed uncertainties.
However, it can be seen from Fig.4 that, contrary to the smoothness of the model predictions, the observed radial profiles of cold gas and SFR surface density show peaks at and the location of these peaks coincide with the location of the most active SF region in the disc of M51a (Scheepmaker et al., 2009). In addition, bumps obviously appear on the surface brightness radial profiles in the FUV-, NUV- and -band, and the intensity of the bump decreases gradually with the increase of the wavelength, which suggests that active SF process may take place in recent years around there.
Indeed, both kinematic and hydrodynamic modeling suggest that single or multiple encounters between these two galaxies are occurred 300-500 Myr ago (Salo & Laurikainen, 2000; Theis & Spinneker, 2003; Dobbs et al., 2010). Studies of stellar populations of M51a also revealed that a burst of SF occurred ago (Mentuch Cooper et al., 2012; Tikhonov et al., 2009). Moreover, Miyamoto et al. (2014) found that the local maximum at on the radial profiles of cold gas in M51a could be caused by the kinks or fractures of the spiral arms by the interaction with its companion galaxy.
Correspondingly, we present a ’toy’ model to imitate the influence of the interaction between M51a and its companion by allowing an additional cold gas infall (with constant rate ) to the disc occurred recently (during the period ) round the region . Other ingredients of the model are the same as those of the viable model. The results of the ’toy’ model are shown by dashed lines in Fig. 4. It can be seen that the freshly infalling cold gas increases the mass surface density of both the molecular gas and the SFR, while has little effect on the atomic surface density and the gas-phase oxygen abundance. Moreover, the additional gas infall results in more luminous surface brightness in FUV-, NUV- and u-band, while the surface brightness in optical and near infrared bands are less effected. Our results suggest that the molecular gas surface density, the SFR and the UV-band luminosity are important quantities to explore the effects of recent interaction on galactic SF process.
4.2 Stellar populations along the disc
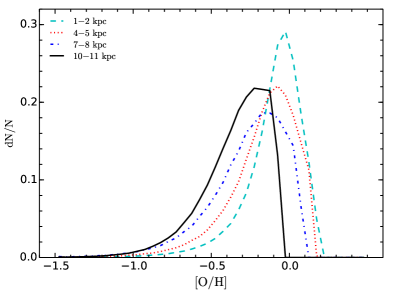
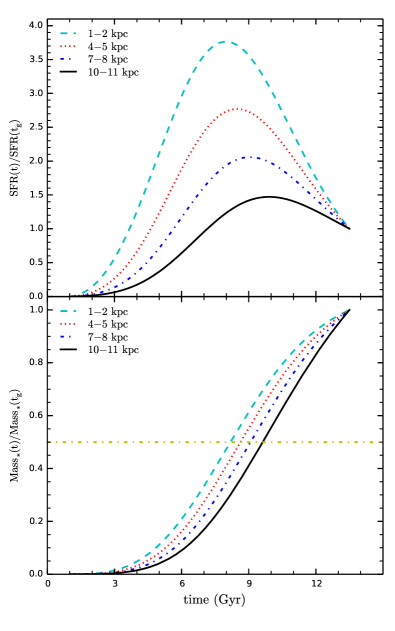
To further explore the properties of stellar population along the disc of M51a, we select four regions out and plot their viable model predictions of the SFHs and growth curves of stellar masses in Fig. 5, including 1-2 kpc (dashed line), 4-5 kpc (dotted line), 7-8 kpc (dash-dotted line), 10-11 kpc (solid line). Correspondingly, Fig. 6 displays their metallicity distribution function (MDF) predicted by the viable model. Note that both the SFRs and stellar masses in Fig. 5 are normalized by their present-day values, and the horizontal dash-dotted line in the lower panel of Fig. 5 denotes the position that each component achieves 50% of its final value.
Fig. 5 shows that the SFRs in the whole disc are very low at early stage and increase gradually due to the increase of gas infall rate. When the consumption rate of cold gas to form new stars is roughly balanced by the gas infall rate, the SFR reaches its peak and then drops down to its present-day value. It is interesting to see that the peak of the SFH moves gradually to later time from the inner to outer parts of disc. Moreover, Fig. 6 reveals that the inner disc contains a higher percentage of metal-rich stars than the outer disc. In other words, our model predictions show evidences that the disc forms inside-out. We will discuss this point again in next subsection.
4.3 Comparisons with the Milky Way and UGC 8802
| Individual | M51a | UGC 8802 | Milky Way |
|---|---|---|---|
| Input properties | (a) | ||
| and | |||
| SF law | |||
| Infal-peak time (Gyr) | 7.0 |
Notes.
(a) The observed K-band surface brightness profile taken from Muñoz-Mateos et al. (2009).
(b) The -band mass-to-light ratio taken from Bell et al. (2003) and Leroy et al. (2008).
(c) is the disc scale-length of UGC 8802 (Chang et al., 2012).
(d) is the solar Galactic radius, and is the disc scale-length of the Milky Way from Chang et al. (1999).
The Milky Way and UGC 8802 are two disc galaxies containing comparable stellar mass with M51a, and we have already investigated SFHs of the two galaxies in previous works (Chang et al., 1999, 2012). In this section, we will compare the growth history of M51a predicted by the viable model with that of the Milky Way and UGC 8802. We referred to Chang et al. (1999, 2012) for a more indepth description of the models. Here we only repeat main ingredients of the models such as the gas infall rate and the SF law, and present a summary of the models in Table 3.
In our previous models of the Milky Way and UGC 8802, an Gaussian formula of gas infall rate has been adopted. The input condition of UGC 8802 to constrain how much gas infalling to the disc is the stellar mass surface density at the present day, which is assumed to be pure exponential , with radial scale-length (Chang et al., 2012). In the case of the Milky Way, the input parameter to constrain the gas infall rate is the total (gas+star) mass surface density at the present day, i.e., , where the solar Galactic radius is set to be and the disc scale-length is (Chang et al., 1999). Regarding the SF law, the model of UGC 8802 adopted the one that the SFR is proportional to the molecular hydrogen surface density , while the model of the Milky Way adopted a radial-dependent Schmidt SF law, i.e., , to be consistent with the observed steep oxygen gradient along the disc.
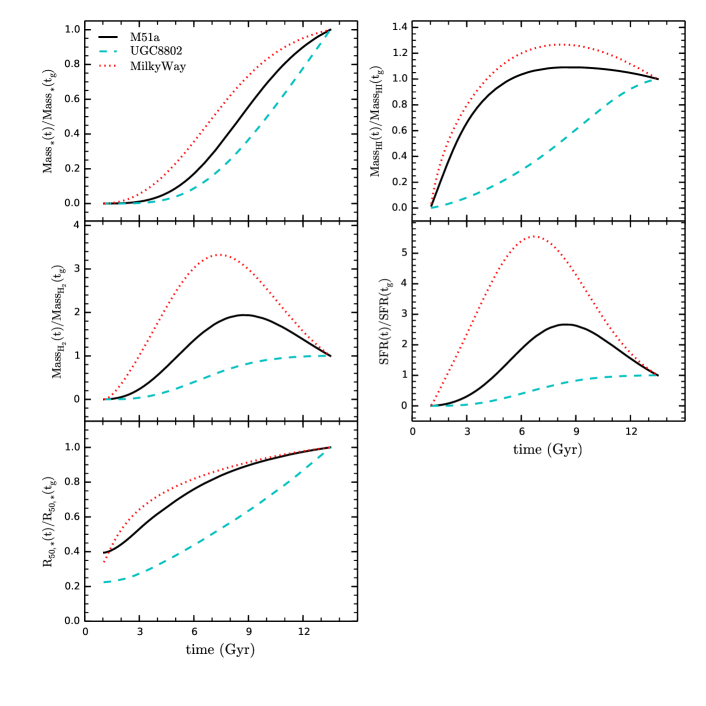
In Fig. 7, we compared model predictions of the growth history of M51a (solid lines), UGC 8802 (dashed lines) and the Milky Way (dotted lines). The upper panels plot the evolution of stellar mass (left panel) and atomic hydrogen mass (right panel). The growth history of molecular hydrogen mass and the SFHs of these three galaxies are displayed in the middle-left and middle-right panels, respectively. The bottom left panel shows the evolution of the half mass size , which is defined as the radius at which half of the total stellar mass is contained. Each quantity in Fig. 7 is normalized to its value at the present day.
From Fig. 7 we can see that, at early stage of evolution, most of the infalling cold gas is in the form of atomic gas. After atomic gas accumulates significantly enough, molecular gas begins to form and then the SFR speeds up. The middle panels of Fig. 7 show that the shape of the SFH is very similar to the evolution curve of the molecular gas, no matter whether the adopted SF law assumes the SFR proportional to the molecular gas surface density or not. This point suggests that the density of molecular gas may be the main driver of SF process, but this question is far from settled.
The growth curves of the mass of atomic gas show that, both M51a and the Milky Way reach their peaks around Gyr ago and then slowly drop down to their present-day values, while the atomic mass of UGC 8802 increases almost steadily and seems to just approach to its peak. Indeed, the outstanding point of UGC 8802 is its extremely high neutral gas content compared to other disc galaxies in this stellar mass range (Garcia-Appadoo et al., 2009; Catinella et al., 2010). According to the model of Chang et al. (2012), a late infall-peak time is necessary to explain the high neutral gas content of UGC 8802, which implies that UGC 8802 is a young galaxy and still active in SF processes. This point can also be seen from both the upper-left panel and the middle-right panel of Fig. 7. It is shown that half of the total stellar mass of M51a has been assembled during the last 5.0 Gyr, while that for the Milky Way and UGC 8802 is around 6.5 Gyr and 4.0 Gyr ago, respectively. In other words, our results suggest that the stellar population of M51a is younger than that of the Milky Way, but older than that of the gas-rich disc galaxy UGC 8802.
We also compare the evolution of the half-mass size among these three galaxies in the bottom left panel of Fig. 7. Since the models of the Milky Way and UGC 8802 both assume that the infall-peak time increases with radius (see Table 3), it is natural to see that both the dotted and dashed lines increase with time. In the case of M51a, although the model adopt a constant infall-peak time, the model predictions also support the disc inside-out formation scenario. This trend also reinforces the recent analysis of the SFH of CALIFA galaxies, which shows that galaxies more massive than grow inside-out (Pérez et al., 2013; González Delgado et al., 2014). In fact, this inside-out formation mechanism has already successfully applied to previous models of formation and evolution of disc galaxies (Chang et al., 1999, 2012; Boissier & Prantzos, 2000; Hou et al., 2000; Chiappini et al., 2001; Yin et al., 2009; Kang et al., 2012) and supported by the observations for nearby disc galaxies (Muñoz-Mateos et al., 2007; Pérez et al., 2013).
5 Summary
M51a is a grand-design spiral galaxy and well known to be interacting with its companion. In this paper, we focus on investigating the SFHs of M51a by constructing a parameterized model and comparing model predictions with the observed data, especially the radial distributions of cold gas surface density, metallicity, and the radial profiles of surface brightness in multi-bands. Our main results can be summarized as follows:
-
1.
Our results show that the model predictions are very sensitive to the adopted infall-peak time . A late infall-peak time results in more luminous surface brightness, low metallicity, high gas and SFR surface densities.
-
2.
The model adopting a constant infall-peak time can nicely reproduce most of the observed constraints of M51a. We also introduce a ’toy’ model, which allows a small amount of additional cold gas infall to the disc in recent time, to imitate the influence of the interaction between M51a and its companion. Our results show that the additional gas infall could be attributed to the observed small bumps on the radial profiles of cold gas surface density, SFR surface density and surface brightness in the UV-band.
- 3.
-
4.
We also compared the model predicted growth histories of M51a, the Milky Way and UGC 8802. We find that the mean stellar age of M51a is younger than that of the Milky Way, but older than that of the gas-rich disc galaxy UGC 8802. Our results also show that half of the total stellar mass of M51a may has been assembled during the last 5.0 Gyr and SF may still proceed actively in the disc of M51a.
We emphasize that here we only present a parameterized model. Through the comparison between model predictions and observations, our ultimate goal is to present our story of the main properties of the formation and evolution of M51a. Although the accurate value of in the viable model is not unique, the main conclusions of our results are robust. However, since M51a belongs to a dynamically complicted system and maintains grand-designed spiral structure, it is a long way to go to clearly understand its origin and evolution.
acknowledgements
We thank the referee for thoughtful comments and insightful suggestions that improved our paper greatly. Xiaoyu Kang and Fenghui Zhang are supported by the National Natural Science Foundation of China (NSFC) grant No. 11403092, 11273053, 11033008, 11373063, and Yunnan Foundation No. 2011CI053. Ruixiang Chang is supported by the NSFC grant No.11373053, 11390373, and Strategic Priority Research Program ”The Emergence of Cosmological Structures” of the Chinese Academy of Sciences (CAS; grant XDB09010100).
References
- Bell et al. (2003) Bell E. F., McIntosh D. H., Katz N., Weinberg M. D., 2003, ApJS, 149, 289
- Bigiel et al. (2008) Bigiel F., Leroy A., Walter F., Brinks E., de Blok W. J. G., Madore B., Thornley M. D., 2008, AJ, 136, 2846
- Blitz & Rosolowsky (2006) Blitz L., Rosolowsky E., 2006, ApJ, 650, 933
- Boissier & Prantzos (2000) Boissier S., Prantzos N., 2000, MNRAS, 312, 398
- Boselli et al. (2003) Boselli A., Gavazzi G., Sanvito G., 2003, A&A, 402, 37
- Bresolin et al. (2004) Bresolin F., Garnett D. R., Kennicutt Jr. R. C., 2004, ApJ, 615, 228
- Bruzual & Charlot (2003) Bruzual G., Charlot S., 2003, MNRAS, 344, 1000
- Catinella et al. (2010) Catinella B., Schiminovich D., Kauffmann G., Fabello S., Wang J., Hummels C., Lemonias J., Wild V., Wyder T. K., 2010, MNRAS, 403, 683
- Chabrier (2003) Chabrier G., 2003, ApJ, 586, L133
- Chang et al. (2010) Chang R. X., Hou J. L., Shen S. Y., Shu C. G., 2010, ApJ, 722, 380
- Chang et al. (1999) Chang R. X., Hou J. L., Shu C. G., Fu C. Q., 1999, A&A, 350, 38
- Chang et al. (2012) Chang R. X., Shen S. Y., Hou J. L., 2012, ApJ, 753, L10
- Chiappini et al. (2001) Chiappini C., Matteucci F., Romano D., 2001, ApJ, 554, 1044
- Colombo et al. (2014) Colombo D., Meidt S. E., Schinnerer E., García-Burillo S., Hughes A., Pety J., Leroy A. K., Dobbs C. L., Dumas G., Thompson T. A., Schuster K. F., Kramer C., 2014, ApJ, 784, 4
- Cortese et al. (2008) Cortese L., Boselli A., Franzetti P., Decarli R., Gavazzi G., Boissier S., Buat V., 2008, MNRAS, 386, 1157
- Dalcanton (2007) Dalcanton J. J., 2007, ApJ, 658, 941
- Dobbs et al. (2010) Dobbs C. L., Theis C., Pringle J. E., Bate M. R., 2010, MNRAS, 403, 625
- Elmegreen (1989) Elmegreen B. G., 1989, ApJ, 338, 178
- Garcia-Appadoo et al. (2009) Garcia-Appadoo D. A., West A. A., Dalcanton J. J., Cortese L., Disney M. J., 2009, MNRAS, 394, 340
- González Delgado et al. (2014) González Delgado R. M., Pérez E., Cid Fernandes R., García-Benito R., de Amorim A. L., Sánchez S. F., Marino R. A., Quirrenbach A., Vílchez J. M., Wisotzki L., 2014, A&A, 562, A47
- Heesen et al. (2014) Heesen V., Brinks E., Leroy A. K., Heald G., Braun R., Bigiel F., Beck R., 2014, AJ, 147, 103
- Helfer et al. (2003) Helfer T. T., Thornley M. D., Regan M. W., Wong T., Sheth K., Vogel S. N., Blitz L., Bock D. C.-J., 2003, ApJS, 145, 259
- Hitschfeld et al. (2009) Hitschfeld M., Kramer C., Schuster K. F., Garcia-Burillo S., Stutzki J., 2009, A&A, 495, 795
- Hou et al. (2000) Hou J. L., Prantzos N., Boissier S., 2000, A&A, 362, 921
- Hu et al. (2013) Hu T., Shao Z., Peng Q., 2013, ApJ, 762, L27
- Hwang & Lee (2008) Hwang N., Lee M. G., 2008, AJ, 135, 1567
- Hwang & Lee (2010) Hwang N., Lee M. G., 2010, ApJ, 709, 411
- Jarrett et al. (2003) Jarrett T. H., Chester T., Cutri R., Schneider S. E., Huchra J. P., 2003, AJ, 125, 525
- Kaleida & Scowen (2010) Kaleida C., Scowen P. A., 2010, AJ, 140, 379
- Kang et al. (2012) Kang X., Chang R., Yin J., Hou J., Zhang F., Zhang Y., Han Z., 2012, MNRAS, 426, 1455
- Kennicutt (1998) Kennicutt Jr. R. C., 1998, ARA&A, 36, 189
- Kennicutt et al. (2003) Kennicutt Jr. R. C., Armus L., Bendo G., Calzetti D., Dale D. A., Draine B. T., Engelbracht C. W., Rieke M. J., Roussel H., Smith J.-D. T., Thornley M. D., Walter F., 2003, PASP, 115, 928
- Kennicutt et al. (2007) Kennicutt Jr. R. C., Calzetti D., Walter F., Helou G., Hollenbach D. J., Armus L., Bendo G., de Mello D., Meyer M., Moustakas J., Murphy E. J., Sheth K., Smith J. D. T., 2007, ApJ, 671, 333
- Kobulnicky & Kewley (2004) Kobulnicky H. A., Kewley L. J., 2004, ApJ, 617, 240
- Korotin et al. (2014) Korotin S. A., Andrievsky S. M., Luck R. E., Lépine J. R. D., Maciel W. J., Kovtyukh V. V., 2014, MNRAS, 444, 3301
- Lee et al. (2011) Lee J. H., Kim S. C., Park H. S., Ree C. H., Kyeong J., Chung J., 2011, ApJ, 740, 42
- Lee et al. (2005) Lee M. G., Chandar R., Whitmore B. C., 2005, AJ, 130, 2128
- Leroy et al. (2008) Leroy A. K., Walter F., Brinks E., Bigiel F., de Blok W. J. G., Madore B., Thornley M. D., 2008, AJ, 136, 2782
- Lin & Shu (1964) Lin C. C., Shu F. H., 1964, ApJ, 140, 646
- Lin et al. (2013) Lin L., Zou H., Kong X., Lin X., Mao Y., Cheng F., Jiang Z., Zhou X., 2013, ApJ, 769, 127
- Matteucci et al. (2009) Matteucci F., Spitoni E., Recchi S., Valiante R., 2009, A&A, 501, 531
- Mentuch Cooper et al. (2012) Mentuch Cooper E., Wilson C. D., Foyle K., Bendo G., Koda J., Baes M., Boquien M., Boselli A., Ciesla L., Cooray A., Eales S., Sauvage M., Spinoglio L., Smith M. W. L., 2012, ApJ, 755, 165
- Miyamoto et al. (2014) Miyamoto Y., Nakai N., Kuno N., 2014, PASJ, 66, 36
- Mollá & Díaz (2005) Mollá M., Díaz A. I., 2005, MNRAS, 358, 521
- Moustakas et al. (2010) Moustakas J., Kennicutt Jr. R. C., Tremonti C. A., Dale D. A., Smith J.-D. T., Calzetti D., 2010, ApJS, 190, 233
- Muñoz-Mateos et al. (2011) Muñoz-Mateos J. C., Boissier S., Gil de Paz A., Zamorano J., Kennicutt Jr. R. C., Moustakas J., Prantzos N., Gallego J., 2011, ApJ, 731, 10
- Muñoz-Mateos et al. (2007) Muñoz-Mateos J. C., Gil de Paz A., Boissier S., Zamorano J., Jarrett T., Gallego J., Madore B. F., 2007, ApJ, 658, 1006
- Muñoz-Mateos et al. (2009) Muñoz-Mateos J. C., Gil de Paz A., Zamorano J., Boissier S., Dale D. A., Pérez-González P. G., Gallego J., Madore B. F., Bendo G., Boselli A., Buat V., Calzetti D., Moustakas J., Kennicutt Jr. R. C., 2009, ApJ, 703, 1569
- Ostriker et al. (2010) Ostriker E. C., McKee C. F., Leroy A. K., 2010, ApJ, 721, 975
- Pérez et al. (2013) Pérez E., Cid Fernandes R., González Delgado R. M., García-Benito R., Sánchez S. F., Husemann B., de Amorim A. L., van de Ven G., Walcher J., Wisotzki L., Cortijo-Ferrero C., CALIFA Collaboration 2013, ApJ, 764, L1
- Pilyugin et al. (2014) Pilyugin L. S., Grebel E. K., Kniazev A. Y., 2014, AJ, 147, 131
- Pilyugin & Thuan (2005) Pilyugin L. S., Thuan T. X., 2005, ApJ, 631, 231
- Robles-Valdez et al. (2013) Robles-Valdez F., Carigi L., Peimbert M., 2013, MNRAS, 429, 2351
- Rots et al. (1990) Rots A. H., Bosma A., van der Hulst J. M., Athanassoula E., Crane P. C., 1990, AJ, 100, 387
- Salo & Laurikainen (2000) Salo H., Laurikainen E., 2000, MNRAS, 319, 377
- Scheepmaker et al. (2009) Scheepmaker R. A., Lamers H. J. G. L. M., Anders P., Larsen S. S., 2009, A&A, 494, 81
- Schruba et al. (2011) Schruba A., Leroy A. K., Walter F., Bigiel F., Brinks E., de Blok W. J. G., Dumas G., Kramer C., Rosolowsky E., Sandstrom K., Schuster K., Usero A., Weiss A., Wiesemeyer H., 2011, AJ, 142, 37
- Schuster et al. (2004) Schuster K.-F., Boucher C., Brunswig W., Carter M., Chenu J.-Y., Foullieux B., Greve A., John D., Lazareff B., Navarro S., Perrigouard A., Pollet J.-L., Sievers A., Thum C., Wiesemeyer H., 2004, A&A, 423, 1171
- Schuster et al. (2007) Schuster K. F., Kramer C., Hitschfeld M., Garcia-Burillo S., Mookerjea B., 2007, A&A, 461, 143
- Theis & Spinneker (2003) Theis C., Spinneker C., 2003, Ap&SS, 284, 495
- Tikhonov et al. (2009) Tikhonov N. A., Galazutdinova O. A., Tikhonov E. N., 2009, Astro.Lett., 35, 599
- Tinsley (1980) Tinsley B. M., 1980, Fundam.Cosm.Phys., 5, 287
- Toomre & Toomre (1972) Toomre A., Toomre J., 1972, ApJ, 178, 623
- Tully (1974) Tully R. B., 1974, ApJS, 27, 437
- Walter et al. (2008) Walter F., Brinks E., de Blok W. J. G., Bigiel F., Kennicutt Jr. R. C., Thornley M. D., Leroy A., 2008, AJ, 136, 2563
- Yin et al. (2009) Yin J., Hou J. L., Prantzos N., Boissier S., Chang R. X., Shen S. Y., Zhang B., 2009, A&A, 505, 497
- Zwicky (1955) Zwicky F., 1955, PASP, 67, 232