ICREA-Institució Catalana de Recerca i Estudis Avançats, 08015 Barcelona, Spain 22institutetext: 22email: morgan.mitchell@icfo.es
Generation, characterization and use of atom-resonant indistinguishable photon pairs
Abstract
We describe the generation of atom-resonant indistinguishable photon pairs using nonlinear optical techniques, their spectral purification using atomic filters, characterization using multi-photon interference, and application to quantum-enhanced sensing with atoms. Using either type-I or type-II cavity-enhanced spontaneous parametric down-conversion, we generate pairs of photons in the resonant modes of optical cavities with linewidths comparable to the 6 MHz natural linewidth of the D1 line of atomic rubidium. The cavities and pump lasers are tuned so that emission occurs in a mode or a pair of orthogonally-polarized modes that are resonant to the D1 line, at 794.7 nm. The emission from these frequency-degenerate modes is separated from other cavity emission using ultra-narrow atomic frequency filters, either a Faraday anomalous dispersion optical filter (FADOF) with a 445 MHz linewidth and 57 dB of out-of-band rejection or an induced dichroism filter with an 80 MHz linewidth and 35 dB out-of-band rejection. Using the type-I source, we demonstrate interference of photon pair amplitudes against a coherent state and a new method for full characterization of the temporal wave-function of narrow-band photon pairs. With the type-II source we demonstrate high-visibility super-resolving interference, a high-fidelity atom-tuned NooN state, and quantum enhanced sensing of atoms using indistinguishable photon pairs.
1 Introduction
Interference of indistinguishable photons is one of the most striking non-classical phenomena. When two indistinguishable photons meet at a beamsplitter, each entering from a different port, an interference of two-photon amplitudes leads them to “coalesce” and to exit in the same direction, even though there is no force causing them to interact HongPRL1987 ; ShihPRL1988 . This and similar multi-photon interference effects have been harnessed for quantum teleportation BouwmeesterN1997 , entanglement swapping PanPRL1998 , linear optics quantum information processing OBrienN2003 , quantum-enhanced sensing MitchellN2004 , and quantum simulation AaronsonARX2010 , among other applications. A similar effect concerns the interference of indistinguishable photon pairs sharing a single mode against other sources of photon pairs. This is the mechanism by which squeezed vacuum, which consists of pairs of indistinguishable photons, alters the noise distribution in an interferometer WuPRL1986 , an phenomenon central to quantum-enhanced sensing LIGONP2011 ; AasiNP2013 and continuous-variable quantum information processing BraunsteinBOOK2010 .
Most of the above-mentioned applications were developed with broadband photons that, due to a strong spectral mismatch, could at best interact inefficiently with atoms or other material systems. Generation of indistinguishable, atom-resonant photons is an attractive goal if we wish to interact states exhibiting non-classical interference with atomic quantum information processors (see chapters by Leuchs & Sondermann, Piro & Eschner, and Slodička, Hétet, Hennrich & Blatt), atomic quantum memories (see chapter by Chuu & Du), or atomic sensors WolfgrammPRL2010 ; KoschorreckPRL2010a ; KoschorreckPRL2010b ; SewellPRL2012 ; SewellPRX2014 . Using cavity-QED methods, atom-resonant indistinguishable photons can be produced with exquisite control over their wave-functions (see the chapter by A. Kuhn), but at a high cost in system complexity.
In this chapter we describe generation of pairs of indistinguishable photons using cavity-enhanced spontaneous parametric down-conversion (CESPDC) PredojevicPRA2008 ; WolfgrammOE2008 ; WolfgrammJOSAB2010 and extremely narrow-band optical filters ZielinskaOE2014 ; ZielinskaOL2012 to select the atom-resonant component of the emission. We describe also applications: using pairs of indistinguishable high-coherence photons, we demonstrate a full measurement of the two-photon temporal wave function, including both amplitude and phase BeduiniPRL2014 , generate an atom-tuned NooN state WolfgrammJOSAB2010 , and use this state to probe an atomic magnetometer, demonstrating the use of indistinguishable photon pairs for sensing of an atomic system beyond the standard quantum limit WolfgrammNPhot2013 .
1.1 CESPDC Sources
Spontaneous parametric down-conversion (SPDC) is a proven method to generate non-classical states of light, including single-mode and two-mode squeezed states, entangled photon pairs, and states with multiple pairs of photons. Although photon production by SPDC is probabilistic, heralded single photons, heralded entangled states, and heralded versions of more exotic states including so-called “Schrödinger kitten” states, can be generated from SPDC output using single-photon detectors to indicate when the source has produced the desired state. Quantum states can also be generated “on demand” if active elements are also incorporated (see the chapter by Yoshikawa & Furusawa).
A strength of SPDC is the simplicity of the parametric interaction, which can produce very pure correlations in frequency, polarization, and photon number. In contrast, parametric interactions do not naturally produce narrowband output, and some engineering is required to generate SPDC output that is bandwidth-compatible with atomic resonance lines or other material spectroscopic features. Due to the strong frequency correlations, narrow-band filtering of one SPDC output can be used to select desired frequency content in the other output, as in the chapter by Piro & Eschner. Placing the SPDC process inside a resonant cavity, “cavity-enhanced SPDC,” (CESPDC) OuPRL1999 gives a resonant enhancement to photon pairs coinciding with the cavity modes while suppressing those frequencies that do not fit. Cavity-enhancement techniques often benefit from techniques such as group-velocity mismatching and even backward-wave phase-matching that further restrict the SPDC output (see the chapters by Chuu & Du, de Riedmatten & Afzelius and Zhao, Bao, Zhao & Pan).
In this chapter we will describe two very similar CESPDC sources, the first using type-I phase matching, and thus capable of producing fully-degenerate photon pairs, i.e. produced in the same cavity mode and thus with the same frequency, polarization, and spatial mode. The second CESPDC source uses type-II phase matching, and is tuned so that one -polarized mode, and one -polarized mode are both resonant at half the frequency of the pump. In this way, we generate photon pairs that are indistinguishable in all respects except for polarization. We will sometimes refer to these devices as sub-threshold optical parametric oscillators (OPOs), the term usually used in frequency conversion and continuous-variable quantum optics for these same devices.
1.2 Atomic frequency filters
Atomic filters use atomic media, usually atomic vapors, to generate intrinsically narrow-band spectral features, and typically achieve transmission bandwidths from a few MHz to a few GHz. The “traditional” uses of atomic filters are in astronomy OhmanSOA1956 , laser ranging and surveying, and daylight optical communications, where they are used to detect signals at specific frequencies while giving excellent blocking, better than 1:, over a very wide rejection band. As we will describe, these features combine well with the output of our CESPDC source, which has a linewidth of only a few MHz, free-spectral range (FSR) of a few hundred MHz and emission extending over hundreds of GHz. Proper matching of an atomic filter to a CESPDC source can then select a single output line while efficiently rejecting the rest of the SPDC output.
While atomic media naturally present strong and narrow absorption features, what we require is a filter with narrowband transmission. This requires some kind of optical trickery, to convert the absorption resonances into transmission features. Equally importantly, the filter must have a strong rejection of the unwanted frequencies. While traditional optics, in the form of cascaded optical cavities, can in principle perform this task perfectly, i.e. with arbitrarily high rejection and unit transmission, this approach requires careful mode-matching and active tuning of the filters, and is ultimately limited by the quality of the cavity optics Neergaard-NielsenOE2007 ; HaaseOL2009 ; PalittapongarnpimRSI2012 . Atomic filters are an interesting option for their stability, multi-mode capability, high transmission, and very high out-of-band rejection, limited by the quality of the polarizers. To date, atomic filters continue to outperform cavity filters in these figures of merit.
2 Atom-resonant indistinguishable photon pairs in a single mode
In this section we describe a series of experiments to generate indistinguishable photon pairs in a single polarization mode, using type-I parametric downconversion. Subsection 2.1 describes the source, subsection 2.2 describes the atomic filter, subsection 2.3 describes measurements of the spectral purity achieved, subsection 2.4 demonstrates interference of two-photon amplitudes between a narrow-band SPDC source and a CW laser, and subsection 2.5 applies this interference to biphoton wave-function measurement. Additional details can be found in ZielinskaOL2012 ; ZielinskaOE2014 ; BeduiniPRL2014 ; ZielinskaARX2014b .
2.1 Type-I CESPDC source
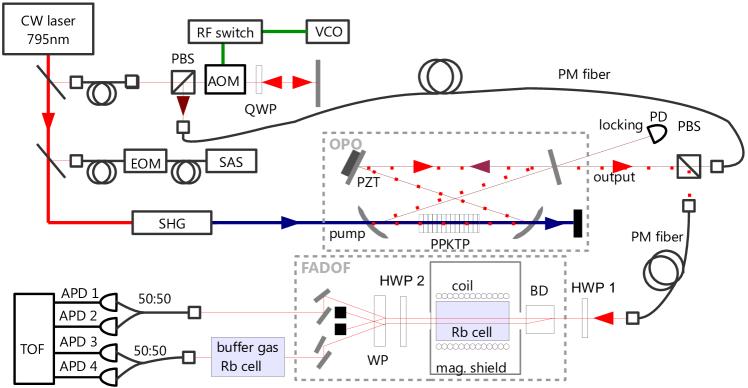
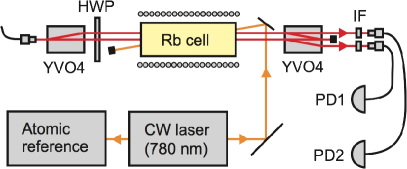
We use a doubly-resonant degenerate OPO Anacavity containing a type-I PPKTP crystal, phase-matched for second-harmonic generation from 794.7 nm to 397.4 nm. A schematic is shown in Fig. 1. A continuous wave external cavity diode laser at 794.7 nm is stabilised at a frequency , 2.7 GHz to the red of the Rb D1 line centre. As described in ZielinskaOL2012 , an electro-optic modulator (EOM) adds sidebands to a saturated spectroscopy absorption signal in order to get an error signal at the desired frequency. We double the laser frequency by cavity-enhanced second harmonic generation using a LBO crystal to generate a 397.4 nm pump beam for the OPO. The cavity length is stabilized to maintain a TEM00, -polarized cavity mode at frequency , thus resonating the SPDC production of indistinguishable photon pairs at this frequency.
With this configuration, photon pairs are generated at all the resonance frequencies of the OPO cavity that fall inside the 150 GHz-wide phase matching envelope of the PPKTP crystal. The OPO output is thus composed of hundreds of frequency modes, each of 8.4 MHz bandwidth, separated by the 501 MHz FSR. We note that in this type-I scenario, group velocity mismatching techniques are not applicable, because the pairs of generated photons differ only in longitudinal mode. Filtering can in principle separate the desired, degenerate-mode photon pairs from the background pairs, but the requirements are quite stringent: The filter must be able to distinguish between one cavity mode and the next, separated by the FSR. Moreover, to achieve a high spectral purity in the output, the filter needs a very high out-of-band rejection. Finally, high transmission efficiency is always desirable so as to not lose the photon pairs. As we shall see, these requirements are well-matched to a specific kind of atomic frequency filter.
2.2 A FADOF at the Rb D1 line
We now describe a Faraday Anomalous-Dispersion Optical Filter (FADOF) at the D1 line of Rb at 795 nm. This line, efficiently detected with Si detectors, accessible with a variety of laser technologies, and showing large hyperfine splittings, is a favorite for coherent and quantum optics with warm atomic vapors. Applications include electromagnetically-induced transparency EIT4WM , stopped light stopped , optical magnetometry EITmag ; WolfgrammPRL2010 , laser oscillators RbLaser , polarization squeezing PolSqueezedLvovsky ; AghaOE2010 , quantum memory memoryHosseini , and high-coherence heralded single photons CereOL2009 ; WolfgrammPRL2011 .
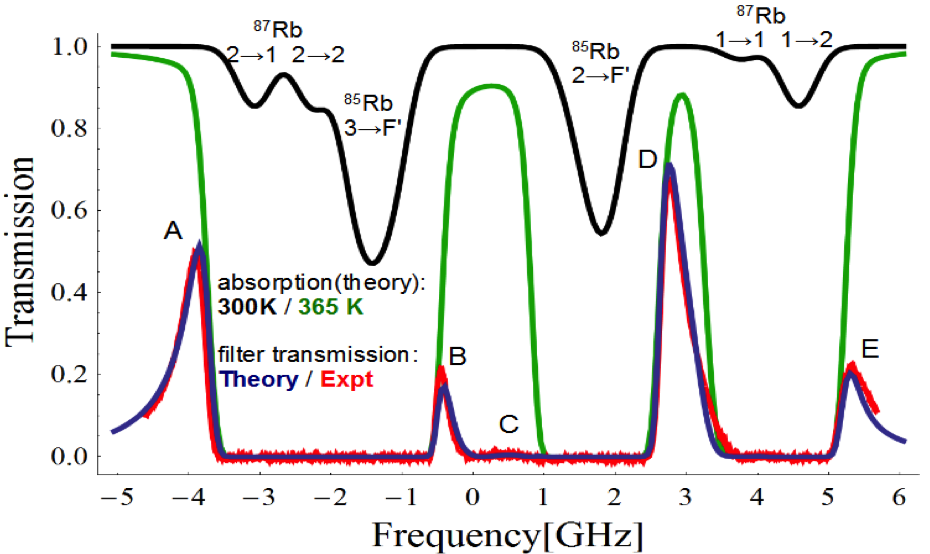
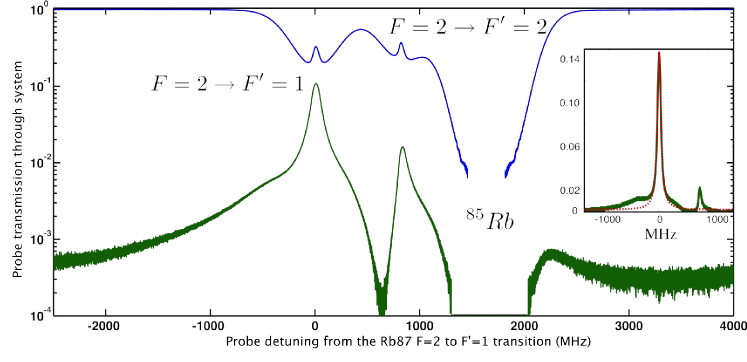
A FADOF consists of an atomic vapor cell between two crossed polarizers, while a homogeneous magnetic field along the propagation direction induces circular birefringence in the vapor. The crossed polarizers block transmission away from the absorption line, while the absorption itself blocks resonant light. Between these, Faraday rotation just outside the Doppler profile can give high transmission for a narrow range of frequencies. FADOF is simple and robust, but performance depends critically on optical properties of the atomic vapor. Fortunately, first-principles modeling of the atomic vapor agrees very well with experiment, as shown in Fig. 2. Public-domain codes for calculating Rb ZielinskaOL2012 and Na GerhardtNaFadofCode ; KieferSR2014 FADOF spectra are available.
Similar FADOFs have been developed for several other alkali atom resonances – Cs D2 MendersOL1991 and YinPTL1992 ; WangOE2012 lines, Rb D2 line RbD2report ; RbD2 , Rb LingOL2014 , K (three lines) KD1 , Na D lines Sodium , and for Ca Chan1993 . Several of these show transmission above 90%, and/or linewidths below 1 GHz. Filter figures of merit are shown in Table 1. An important figure of merit used in the FADOF literature is the Equivalent Noise Bandwidth , where is the filter transmission versus frequency RbD2 . For narrowband signals in broadband noise, a filter achieves the signal-to-noise of an ideal filter with bandwidth ENBW.
| Atom | [nm] | Ref. | Tmax | BT[GHz] | BN[GHz] | ||
| K | 405 | KD1 | 0.93 | 1.2 | 6 | ||
| 87Rb | 420 | LingOL2014 | 0.98 | 2.5 | 5.9 | ||
| Ca | 423 | Chan1993 | 0.55 | 1.5 | - | ||
| Cs | 455 | YinPTL1992 | 0.96 | 0.9 | 3.3 | ||
| Cs | 455 | WangOE2012 | 0.86 | 1.5 | - | ||
| Na | 589 | Sodium | 0.85 | 1.9 | 5.1 | ||
| Na | 590 | Sodium | 0.37 | 10.5 | 8.3 | ||
| K | 766 | KD1 | 0.96 | 0.9 | 5 | ||
| K | 770 | KD1 | - | - | - | ||
| Rb | 780 | RbD2 | 0.93 | 1.3 | 4.7 | ||
| Cs | 852 | MendersOL1991 | 0.90 | 0.6 | - | ||
| B[mT] | T[K] | ||||||
| Rb | 795 | ZielinskaOL2012 | 18.0 | 353 | 0.92 | 0.48 | 2.1 |
| Rb | 795 | ZielinskaOL2012 | 5.9 | 378 | 0.91 | 1.10 | 2.7 |
| Rb | 795 | ZielinskaOL2012 | 4.5 | 365 | 0.71 | 0.45 | 1.2 |
| Rb | 795 | ZielinskaOL2012 | 2.0 | 345 | 0.04 | 0.32 | 0.8 |
When quantified by the ENBW, the Rb D1 line gives superior performance to other species and lines, due to what appears to be a fortunate accident of the hyperfine splittings. For either pure 85Rb or pure 87Rb, the FADOF transmission at these field strengths shows four peaks, with the strongest ones at the extremes of the spectrum and with long tails. The strong 87Rb peaks are visible as peak A and E of Fig. 2. The strong 85Rb peaks include the peak D and one at , but in the natural-abundance vapor this latter peak is completely obscured by the 87Rb absorption. The long tail of peak D is blocked by absorption from the 87Rb transition, improving the ENBW.
A dual-channel FADOF
The filter used here is a small modification of that described in Section 2.2 and in ZielinskaOL2012 . We take advantage of the multi-mode, imaging property of the FADOF to filter simultaneously two orthogonal polarizations: instead of the crossed polarizers, we use a beam displacer before the cell, so that the two orthogonal polarizations travel along independent parallel paths in the cell. After the cell we use a Wollaston prism to separate the near-resonant filtered light from the unrotated one. The optical axes of the two polarizing elements are oriented with precision mounts, and an extinction ratio of is reached.
Additionally, the setup has been supplemented with a half-waveplate placed before the Wollaston prism (HWP 2 in Fig. 1), which enables us to, in effect, turn on and off the filter. In the “FADOF on” condition, the waveplate axis is set parallel to the Wollaston axis (and thus the waveplate has no effect on the filter behaviour), the magnetic field is 4.5 mT and the temperature is 365 K. In the “FADOF off” condition, no magnetic field is applied, the temperature of the cell is also 365 K and HWP 2 is set to rotate the polarization by 90 degrees, in effect swapping the outputs, so that almost all the light is transmitted through the setup without being filtered.
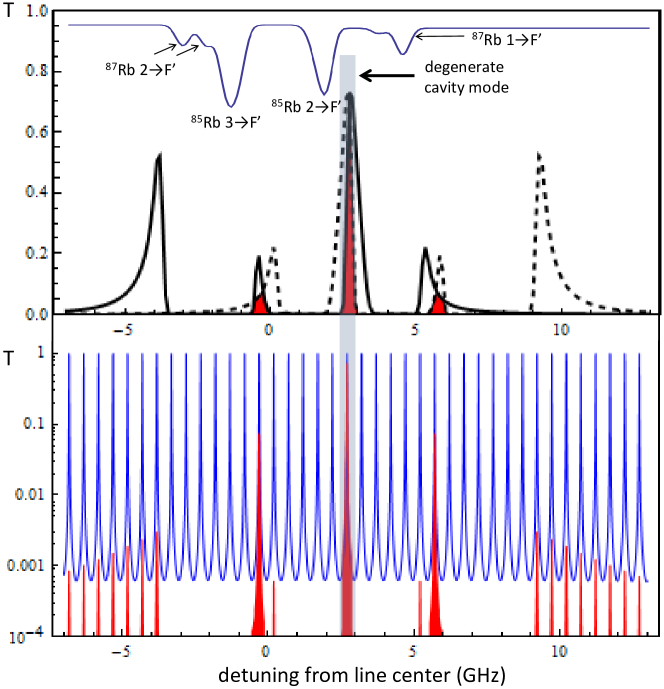
We optimized the filter using a common criterion for experiments with photon pairs: we maximize the ratio of coincidences due to photon pairs belonging to the degenerate mode to coincidences due to other photon pairs. Because of energy conservation, the two photons in any SPDC pair will have frequencies symmetrically placed with respect to the degenerate mode; to prevent the pair from reaching the detectors, it suffices to block at least one of the photons. In terms of filter performance, this means that it is possible to have near-perfect filtering even with transmission in some spectral windows away from the degenerate mode, provided the transmission is asymmetrical (Fig. 3). Using this criterion we find the optimal conditions for the filter performance at the field and temperature values given above.
The optimum filter performance requires the degenerate mode that should be filtered to coincide with the FADOF transmission peak at a fixed frequency (2.7 GHz to the red from the center of the Rb D1 line).
2.3 Spectral purification of degenerate photon pairs from type-I CESPDC
We now show how such an atomic filter can separate indistinguishable, atom-resonant photon pairs from a much stronger broadband background of non-degenerate photon pairs, the natural output of a sub-threshold OPO or CESPDC source.
Using the FADOF described in Section 1.2 we observe 70% transmission of the degenerate mode through the filter, simultaneous with out-of-band rejection by 57 dB, sufficient to reduce the combined non-degenerate emission to a small fraction of the desired, degenerate mode emission. For comparison, a recently-described monolithic filter cavity achieved 60% transmission and 45 dB out-of-band rejection PalittapongarnpimRSI2012 . We test the filter by coincidence detection of photon pairs from the OPO output, which provides a stringent test of the suitability for use at the single-photon level. We observe for the first time fully-degenerate, near atom-resonant photon pairs, as evidenced by correlation functions and atomic absorption measurements. The 96% spectral purity we observe surpasses the previous record of 94% WolfgrammPRL2011 , and is in agreement with theoretical predictions.
Detection
The distribution of arrival times of photons in a Hanbury-Brown-Twiss configuration is useful to check that the filter effectively suppresses the non-degenerate modes of the type-I OPO described in the previous section. We collect the OPO output in a polarization maintaining fiber and send it through the filter setup. The filtered light is then coupled into balanced fiber beam splitters that send the photons to avalanche photo-detectors (APDs), connected to a time-of-flight analyzer (TOF) that allows us to measure the second order correlation function (see Fig. 1).
Since we are using single photon detectors, we need to reduce as much as possible the background due to stray light sources in the setup. The main source of background light is the counter-propagating beam that we inject in the OPO in order to lock the cavity length to be resonant at . We solve this problem using a chopped lock: the experiment switches at 85 Hz between periods of data acquisition and periods of stabilization. During periods of data acquisition, the AOM is off, and thus no locking beam is present. During periods of stabilization, the AOM is on, and an electronic gate circuit is used to block electronic signals from the APDs, preventing recording of detections due to the locking beam photons. In addition, the polarization of the locking beam is orthogonal to that of the OPO output.
Effect of filtering on arrival time distribution
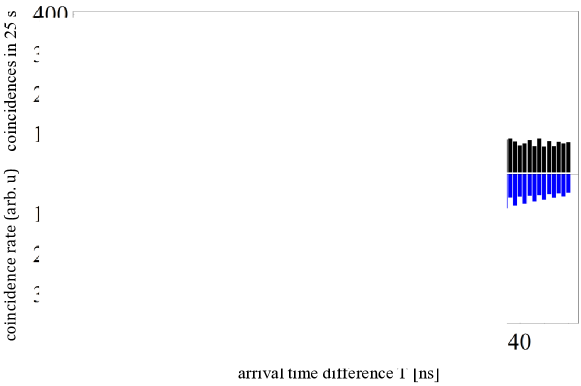
The relative arrival-time distribution for photon pairs produced by the CESPDC source is a Dirac comb, with a separation given by the cavity round-trip time, times a double exponential with a time constant given by the cavity ring-down time KuklewiczPRL2006 ; ZielinskaARX2014b . Here the cavity round-trip time is slightly less than 2 ns, whereas the resolution of our time-to-digital converter is 1 ns. Evidence for the comb structure is visible in the measured distribution, shown in Fig. 4. This agrees well with the theoretical expectation, described in the Appendix, as does the 26 ns full-width at half-maximum (FWHM) of the double-exponential envelope. When the filter is “on,” we expect to see an unmodulated double exponential of the same width. While the filter blocks the unwanted modes, it has little reshaping effect on the degenerate mode, which is much narrower than, and centred on, the peak of the filter pass-band. In agreement with these expectations we observe a double-exponential distribution with no visible modulation with the same FWHM width. This is shown in Fig. 5.
Spectral purity
According to the theoretical filter spectrum from ZielinskaOL2012 , we estimate that 98% of the atom-resonant photon pairs come from degenerate mode (see Fig. 3). In order to test how much light outside the Rubidium D1 line can pass through our FADOF, we split the light equally between the two different polarization paths of the filter setup by means of a half-wave plate put before the beam displacer (HWP 1 in Fig. 1). A natural-abundance Rb vapor cell, with 10 Torr of N2 buffer gas and heated until it is opaque for resonant light, is inserted in one of the paths after the filter. The collisionally-broadened absorption from this cell blocks the entire FADOF transmission window, allowing us to compare the arrival time histograms with and without the resonant component.
The number of photons detected after passing through the hot Rb cell is comparable to the detector dark counts, meaning that most of the filtered light is at the chosen frequency . We define the spectral purity of the FADOF as , where () is the number of photon pairs which were recorded within a coincidence windows of 50 ns in the path with (without) the hot cell. Considering raw coincidences (no background subtraction), we obtain , meaning that the filtered signal is remarkably pure, as only the of the recorded pairs are out of the filter spectrum. This agrees with measurements of the polarization extinction ratio with the FADOF off, i.e., it is due to technical limitations of the polarization optics and could in principle be improved. Knowing that of the photon pairs transmitted through the filter within the Rb resonance come from the degenerate cavity mode (due to filter spectrum), we conclude that of the pairs exiting the filter come from the degenerate mode.
2.4 Interference of biphoton amplitudes from distinct sources
An SPDC process naturally generates a state of the form
| (1) |
where and index the modes of the signal and idler fields, respectively, and is a complex-valued function analogous to the wave function encountered in non-relativistic quantum mechanics. Following this analogy, one might expect that observations can only indicate up to an unobservable global phase. A bit of reflection shows, however, that even the global phase of is observable, so long as the two-photon part of the wave-function exists in superposition with other parts, most importantly the zero-photon contribution .
Consider the simplest scenario, in which signal and idler are the same mode, and differ at most by their times of arrival , . This is in fact the case when we consider the filtered output of the CESPDC source described above. The SPDC state becomes
| (2) |
where now plays the role of . The phase of can be made visible by interfering the state against another state containing both a zero-photon and a two-photon component. A natural candidate is the continuous-wave coherent state with amplitude :
| (3) |
We can imagine combining at a polarizing beamsplitter the states , with vertical polarization, and , with horizontal polarization, to obtain a state
| (5) | |||||
with a two-photon component
| (6) |
Interference of these two terms can be obtained by coincidence detection in a basis that is neither nor . For example, the rate of detection of a photon pair, at times and , both in the state , is found by projection onto to give
| (7) |
which clearly depends on the phase of . It should be noted that observing this interference requires both narrow-band photon pairs, so that the detection times can be resolved, and a stable phase relation between and . To maintain this phase relationship, we use the OPO also as a phase-sensitive amplifier, a well-established technique from continuous-variable quantum optics.
The experimental setup is shown in Fig. 6. A continuous-wave diode laser at 794.7 nm generates both the coherent reference beam and, after being amplified and doubled in frequency, a 397.4 nm pump beam for the OPO, described in PredojevicPRA2008 , which generates a vertically-polarized (V) squeezed vacuum state via SPDC in a periodically poled KTP crystal. The cavity length is actively stabilized with a Pound-Drever-Hall lock, to keep one longitudinal V mode resonant at the laser frequency. The locking beam is H polarized, counter-propagating, and shifted in frequency by an acousto-optic modulator (AOM), to match the frequency of an H-polarized mode. The AOM RF power is chopped and the detectors are electronically gated: coincidence data are acquired only when the locking light is off. With these measures, the contribution of locking light to the accidental coincidences background is minimised.
The V-polarized squeezed vacuum is combined with the H-polarized coherent reference at a polarizing beamsplitter to generate a beam with co-propagating squeezed and reference components. A polarization transformation, chosen so that arrives to one detector, is implemented with a quarter- and a half-waveplate, before coupling into a polarization-maintaining fiber.
At the fiber output, the two polarization components are filtered with the two-polarization FADOF described in Section 2.3, in order to isolate the squeezed vacuum and block with high efficiency the hundreds of non-degenerate frequency modes generated by the OPO. The maximum transmission frequency of this filter is located at 2.7 GHz to the red of the center of the rubidium D1 line, and the laser frequency is stabilised at this particular frequency by using an integrated electro-optic modulator to add sidebands to the laser prior to the saturated absorption spectroscopy.
The relative phase between the coherent and the squeezed beam is stabilized by a quantum noise lock: One Stokes component is detected with a balanced polarimeter, and the noise power in a 3 Hz bandwidth above 500 kHz is computed analogically using a multiplier circuit. This signal is fed back by a servo loop to a piezo-electric actuator on a mirror in the pump path, to stabilize the pump phase by a side-of-fringe lock. A galvanometer mirror is used to switch between the single-photon counting and stabilisation setups at a frequency of 100 Hz. The reference beam power is increased during the stabilization part of the cycle, to reach the shot-noise-limited regime optimal for detection of the squeezing and operation of the noise lock. Two cascaded AOMs, whose RF power is chopped synchronously with the galvanometer mirror, modulate the coherent reference beam power, so that it has high power when the light is entering the stabilisation setup and low power when the photon counting part is active. The system can maintain a fixed over several hours.
Results are shown in Fig. 7, and clearly show both constructive and destructive interference of the two-photon wave-function against the coherent state.
2.5 Full reconstruction of the biphoton wave-function
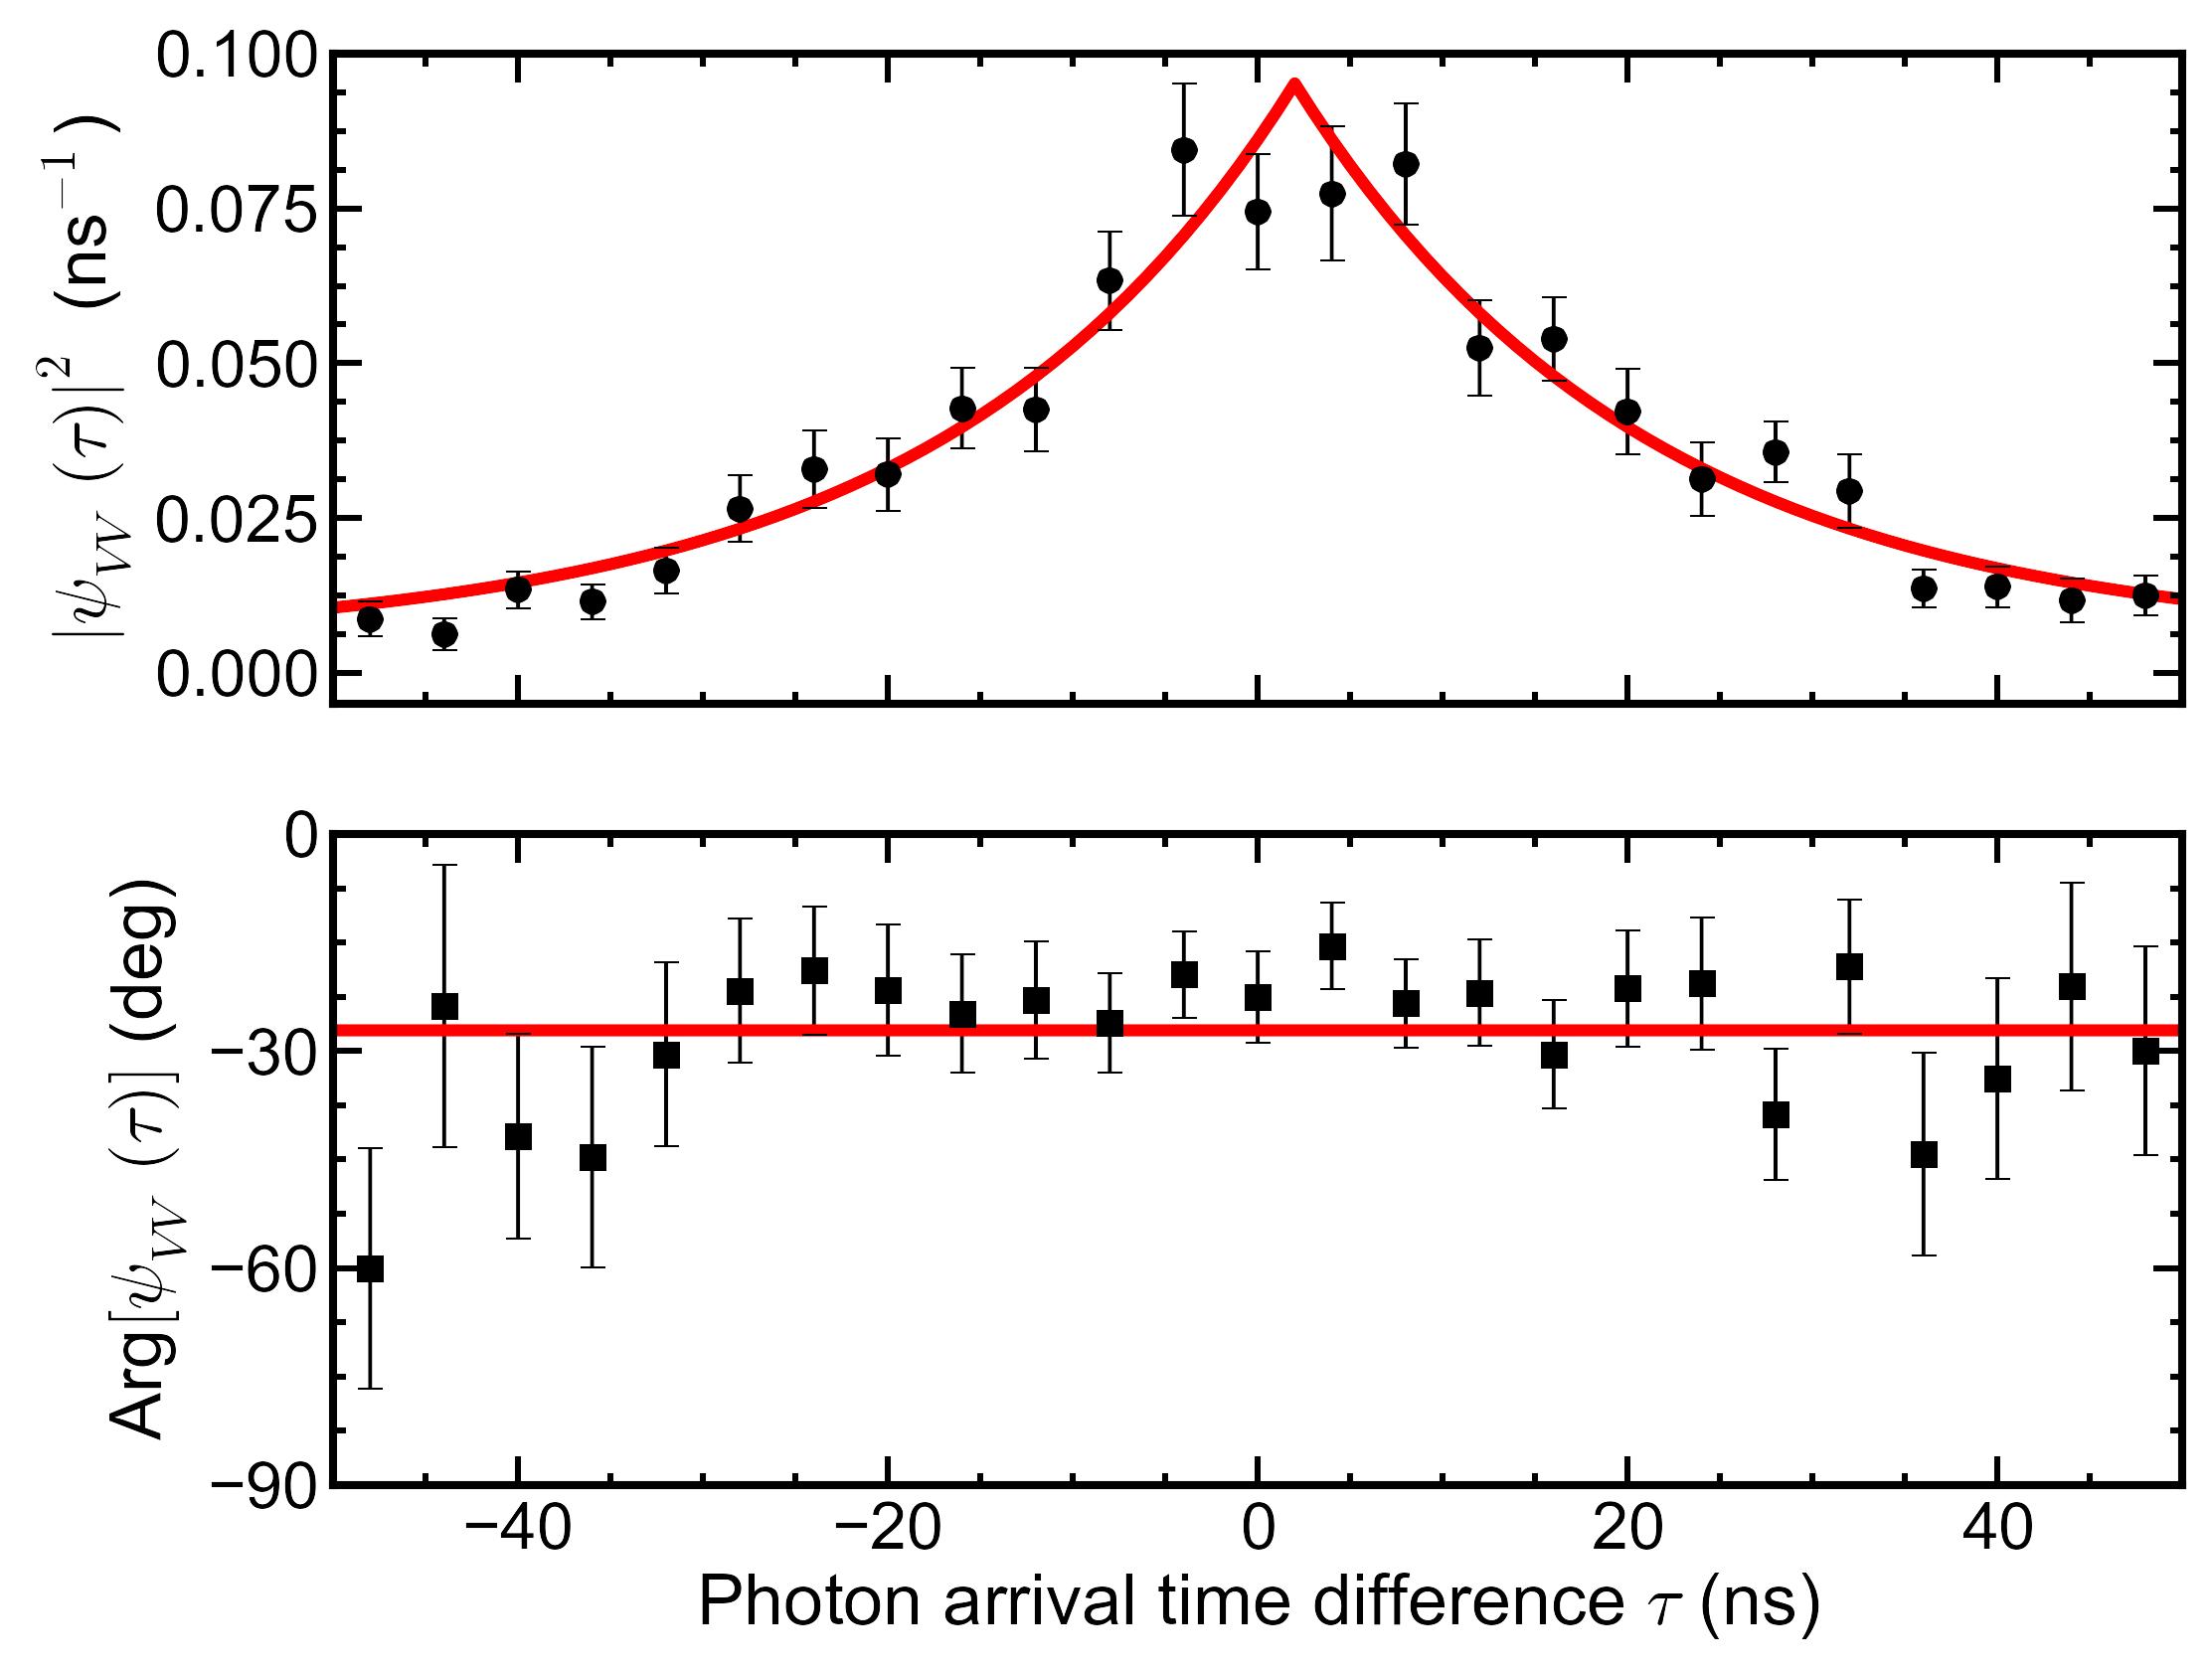
The form of Eq. (7) suggests a method to measure the two-photon wave-function, including not only its amplitude, but also its phase. If the term is under our control, it should be possible by setting this term and measuring the resulting coincidence rates, to infer the complex value of . This idea was made precise in BeduiniPRL2014 , and the above setup was used to reconstruct the biphoton wave-function shown in Fig. 8.
The results are consistent with a double-exponential amplitude with 26 ns full-width at half-maximum (FWHM), as expected for a squeezed vacuum state from an OPO with the 8.1 MHz FWHM bandwidth independently-measured on our system. The phase of , consistent with a non-zero constant value, is reconstructed with a statistical uncertainty that decreases with increasing , reaching degree near . A constant phase is expected for an ideal OPO, while a phase defect could signal cavity or crystal imperfections KuzucuPRA2008 ; ODonnellPRL2009 . The phase offset is tunable via the side-of-fringe lock that sets the relative phase of the squeezed vacuum and reference, and is another indication of interference at the two-photon level.
3 Generation of spectrally-pure, atom-resonant NooN states
In this section we describe a series of experiments to generate atom-tuned photon pairs from Type-II SPDC. Subsection 3.1 presents a motivation in terms of NooN states and their interest for quantum-enhanced sensing, subsection 3.2 describes the SPDC source and characterization of the generated states, subsection 3.3 describes the atomic filter, subsection 3.4 describes measurements of the spectral purity achieved, and subsection 3.5 describes the application of atom-tuned NooN states to quantum-enhanced sensing of magnetic fields using an atomic ensemble as a sensor.
3.1 NooN states
We now describe the generation of atom-tuned photon pairs of orthogonal polarization, with one photon -polarized and one -polarized, but indistinguishable in all other degrees of freedom. A state of one state can be written
| (8) |
where the circular polarization modes are defined by , . When written in terms of the photon numbers , and in the modes respectively, and using the notation , this state is
| (9) |
with , an example of a “NooN” state, named for the letters that appear in the kets .
Consider a linear polarization interferometer that operates by Faraday rotation. This imposes a differential phase between the and parts of the state, transforming the NooN state as
| (10) |
Note that the phase acts times on the second part of the state, because it contains photons. This implies that any signal derived from this state must vary with , implying an -fold acceleration of any interferometric signal. If we consider that is an unknown phase, this accelerated interference implies an -fold increase in the Fisher information PezzeISEF2014 , allowing estimation of with uncertainty , improving upon the standard quantum limit of , the best obtainable with non-entangled states.
A major motivation of this work is to test the suitability of entangled states for quantum enhanced sensing with atoms. In atomic media, interferometric phase shifts are necessarily accompanied by absorption, implying deposition of energy in the probed medium. Absorption also degrades any quantum advantage, as described by recent theory DornerPRL2009 ; EscherNP2011 . To further complicate matters, in real media the phase shift and absorption may depend on the same unknown quantity. In a trade-off of rotation strength versus transparency, we employ a NooN state in a spectral window detuned four Doppler widths from the nearest 85Rb resonance. We generate this, as above, with a CESPDC source and an ultra-narrow atom-based filter.
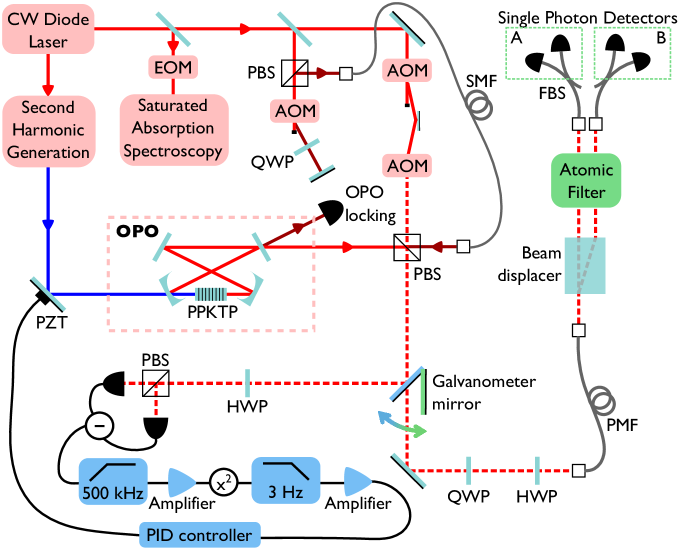
3.2 Type-II CESPDC source
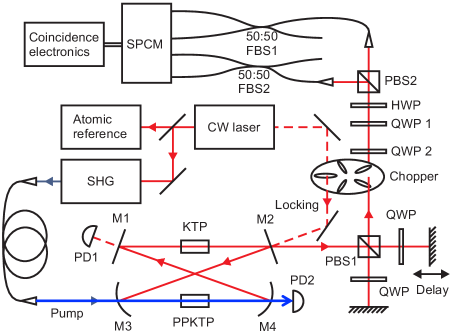
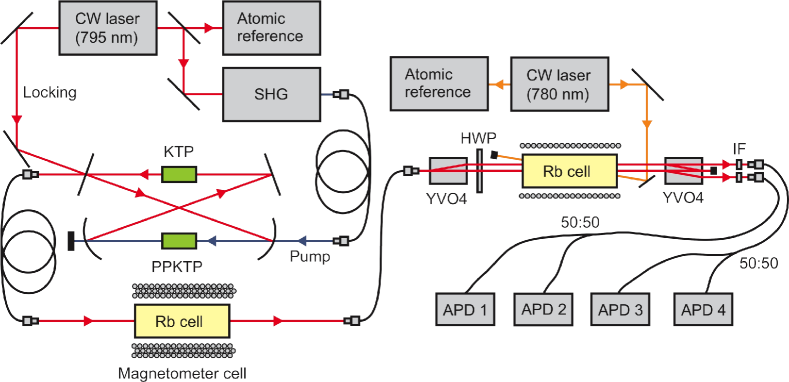
As laser source we use a continuous-wave (CW) diode laser, stabilized to the D1 transition of atomic rubidium at 795 nm and then frequency doubled to generate a 397.5 nm pump that is passed through a mode-cleaning single-mode fiber and then focused into the center of a 20 mm-long periodically-poled KTiOPO4 (PPKTP) crystal in a cavity, forming the OPO (Fig. 9). A pump beam waist of 30 is achieved with a telescope. This beam waist was chosen to be larger than the optimum for degenerate down-conversion according to Boyd and Kleinman BoydJAP1968 in order to reduce possible effects of thermal lensing LeTargatOC2005 and gray-tracking BoulangerAPL1994 . The crystal is poled for type-II degenerate down-conversion, and produces orthogonally-polarized signal and idler photons. Due to crystal birefringence, these photons experience temporal walk-off that would, if un-compensated, render the photons temporally distinguishable. A second KTP crystal of the same length and crystal cut, but not phase-matched and rotated about the beam direction by 90∘, is added to the long arm of the cavity in order to introduce a second walk-off equal in magnitude but opposite in sign KuklewiczPRL2006 .
The ring cavity is formed by two flat mirrors (M1, M2) and two concave mirrors (M3, M4) with a radius of curvature of 100 mm. The effective cavity length of 610 mm corresponds to a FSR of 490 MHz. This geometry provides a beam waist of 42 for the resonant down-converted beam at the center of the crystal, which matches the 30 pump beam waist. Cavity length is controlled by a piezoelectric transducer on mirror M1. The output coupler M2 has a reflectivity of 93% at 795 nm. All other cavity mirrors are highly reflecting (R 99.9%) at 795 nm and highly transmitting at 397.5 nm (R 3%) resulting in a single-pass through the nonlinear crystal for the blue pump beam. The crystal end faces are AR coated for 397.5 nm and 795 nm. The measured cavity finesse of 70 results in a cavity linewidth of 7 MHz.
While the walk-off per round trip is compensated by the KTP crystal, there is an uncompensated walk-off of in average half a crystal-length, because of the different positions inside the PPKTP, where a photon pair could be generated. This leads to a remaining temporal distinguishability at the output of the cavity that is completely removed by delaying the horizontally polarized photon of each pair with a Michelson-geometry compensator: a polarizing beam splitter, retro-reflecting mirrors, and quarter wave-plates set to 45∘ introduce an adjustable delay while preserving spatial mode overlap. After recombination the pairs are sent through a half wave plate (HWP2) that together with PBS2 determines the measurement basis. Both output ports of PBS2 are coupled into single-mode fibers (SMF) connected to single photon counting modules (Perkin Elmer SPCM-AQ4C). The pulse events are registered and processed by coincidence electronics (FAST ComTec P7888) with a resolution of 1 ns.
The OPO cavity is actively stabilized by injecting an auxiliary beam, derived from the same diode laser, into the cavity via the output coupler (M2). This light is detected in transmission by a photodiode (PD1). Frequency modulation at 20 MHz, applied via the laser diode current, is used to lock to the peak of the cavity transmission. To eliminate the background noise caused by this auxiliary beam and to protect the SPCMs, the locking and measuring intervals are alternated using a mechanical chopper at a frequency of about 80 Hz with a duty cycle of 24%.
A general polarization analyzer, consisting of a quarter wave plate (QWP1) followed by a half wave plate (HWP) and a polarizing beam splitter (PBS2) is used to determine the measurement basis as shown in Fig. 9. To generate a NOON state in the / basis another quarter wave plate (QWP2) can be added. The two output ports of PBS2 are coupled to single-mode fibers and split with 50:50 fiber beam splitters. The four outputs are connected to a set of single photon counting modules (Perkin Elmer SPCM-AQ4C). Time-stamping was performed by coincidence electronics with a resolution of 2 ns. By considering a time window of 150 ns, which is longer than the coherence time of each individual photon, we can evaluate the coincidences between any two of the four channels.
Characterization of the NooN state
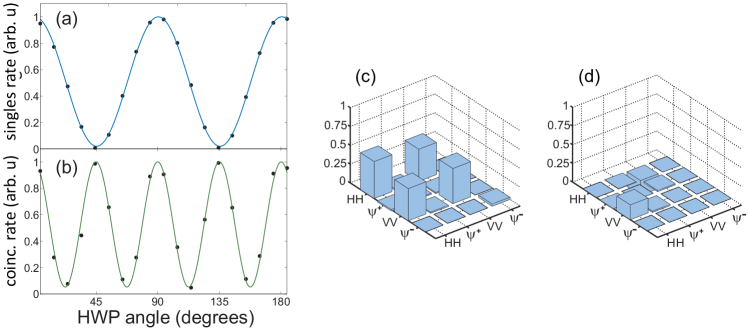
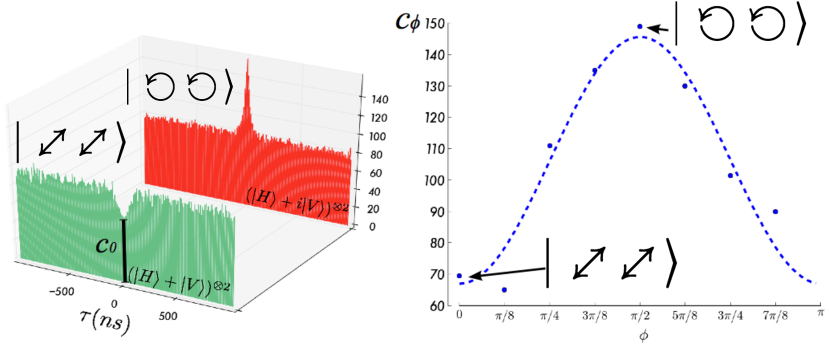
Rotating the HWP before the detection setup allows us to demonstrate the greater resolution available with the NooN state, as shown in Fig. 10 (left). First, sending just a single polarization and detecting the rate of single-photon arrivals, we observe the expected oscillations with a period, in HWP angle, of 90∘. Then, sending NooN states and detecting in coincidence, we observe a two-fold reduction in the oscillation period simultaneous with high visibility, due to the two-photon coherence of the NooN state. The sinusoidal fit function of the coincidences shows a visibility of 90%.
The achieved high visibility of the state is the requirement for a high-fidelity NOON state. We introduce another quarter wave plate (QWP2) before the analyzing part of the setup to create a two-photon NOON state in the / basis, which can be written . Since the output state of the cavity is already a NOON state in the circular basis , this state can be transferred into a NOON state in the / basis by sending it through an additional quarter wave plate at 45 degrees.
We also use quantum state tomography, as in AdamsonPRL2007 , to measure the polarization density matrix of the NooN state WolfgrammJOSAB2010 . In Fig. 10 (right) real and imaginary parts of the reconstructed density matrix of a NOON state are displayed. The coherence of the state is partly imaginary leading to a phase of between and components (Fig. 10(b)), which is however of no importance in the following. The fidelity of this state with the corresponding ideal two-photon NOON state is 99%, making the state suitable for applications such as phase estimation MitchellN2004 .
3.3 Induced dichroism atomic filter
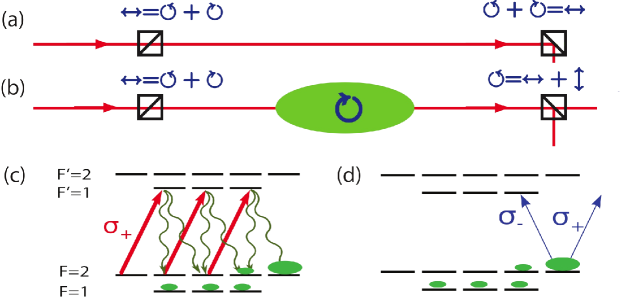
As with the Type-I OPO described earlier, only a small portion of the SPDC output of the Type-II OPO is atom-resonant, and a narrow-band filter is necessary to select this atom-resonant portion. We use an induced dichroism atomic filter, similar in several ways to the FADOF of Section 1.2, to separate the frequency-degenerate output of the CESPDC from the rest of the output. The filter, described in references CereOL2009 ; WolfgrammPRL2011 , has an 80 MHz FWHM passband centered on and 35 dB out-of-band rejection, so that only atom-tuned photons are detected. A representative spectrum is shown in Fig. 17.
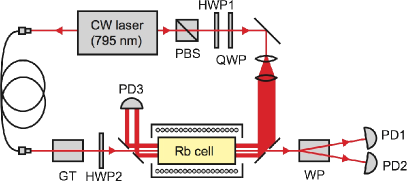
As shown in Fig. 15 (right), a YVO4 crystal separates horizontally and vertically polarized photons by 1 mm. The polarization modes travel parallel to each other through a hot rubidium cell of isotopically pure 87Rb, optically pumped by a single-frequency laser resonant to the F=2F’=3 transition of the D2 line of 87Rb (not shown). Due to Doppler shifts, the optical pumping only effects a portion of the thermal velocity distribution, and creates a circular dichroism with a sub-Doppler linewidth of about 80 MHz. A second YVO4 crystal introduces a second relative displacement, which can re-combine or further separate the photons, depending on polarization. Separated photons are collected, while re-combined photons are blocked. A half wave plate is used to switch between the “active” configuration, in which only photons that change polarization in the cell are collected, and the “inactive” configuration, in which photons that do not change are collected. In the “active” configuration, the system acts as an IFM detector for polarized atoms: a photon is collected only if it experiences a polarization change, i.e., if it is resonant with the optically pumped atoms, which absorb one circular component of the photon polarization state. Neighboring modes of the degenerate mode at the rubidium transition are already 490 MHz detuned and therefore outside of the filter linewidth of 80 MHz. The out-of-band extinction ratio is 35 dB. The filter transmission is optimized by adjusting the overlap between pump and single-photon mode, the rubidium vapor temperature and the magnitude of a small orienting applied magnetic field. The temperature is set to 65∘C, which corresponds to an atomic density of cm-3. The measured filter transmission of 10.0 % for horizontal polarization and 9.5 % for vertical polarization is limited by pump power and in principle can reach 25% CereOL2009 .
To avoid contamination of the single-photon mode by scattered pump light, the pump enters the vapor cell at a small angle and counter-propagating to the single-photon mode. Interference filters centered on 795 nm further reject the 780 nm pump light with an extinction ratio of . The measured contribution from pump photons is below the detectors’ dark count rate. Each output is coupled into single-mode fiber. One is detected directly on a fiber-coupled avalanche photo diode (APD, Perkin Elmer SPCM-AQ4C). The other is used for subsequent experiments. Photon detections are recorded by a counting board (FAST ComTec P7888) for later analysis.
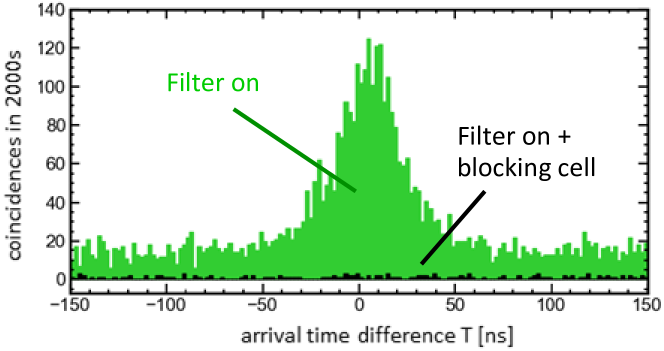
3.4 Spectral purity measurement
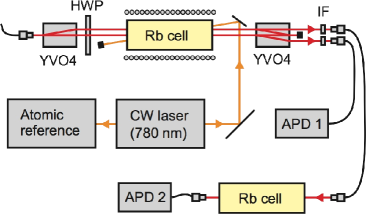
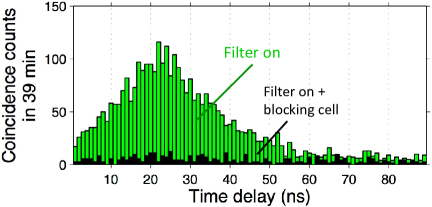
The CESPDC source, shown in Fig. 9, was filtered using the geometry of Fig. 15 (right), to produce in-principle spectrally pure photon pairs. The geometry of the filter and detection setup are shown in Fig. 14 (left). To test the spectral purity, one photon was detected as a herald, and the other subjected to further spectral filtering using a cell of Rb vapor. The cell could be maintained at room temperature, causing little absorption, or at a high temperature, in which case it efficiently blocked resonant photons. Fig. 14 (right) shows the results: with the cold blocking cell, a double-exponental arrival-time distribution is observed, as expected. When the blocking cell is heated, the coincidences drop to the dark-count level. We estimate the fraction of atom-resonant photons among the heralded single photons is at least 94 % WolfgrammPRL2011 .
3.5 Quantum-enhanced sensing of atoms using atom-tuned NooN states.
We now apply the atom-tuned NooN states for sensing of Faraday rotation in a hot atomic ensemble. Because the Faraday rotation is a resonant phenomenon, it is essential to have near-resonant photons for this purpose. We use a 85Rb atomic spin ensemble, similar to ensembles used for optical quantum memories JulsgaardN2004 and quantum-enhanced atom interferometry SewellPRL2012 ; SewellNP2013 ; SewellPRX2014 . Non-destructive dispersive measurements on these systems, used for storage and readout of quantum information or to produce spin squeezing, are fundamentally limited by scattering-induced depolarization MadsenPRA2004 ; JulsgaardN2004 ; KoschorreckPRL2010b ; NapolitanoN2011 . This provides an experimentally-grounded motivation for the idea that the number of probe photons is a limiting resource when measuring this system; the number of probe photons cannot be increased without increasing the damage to the spin ensemble.
The setup is shown schematically in Fig. 15. Narrowband NooN states at , the optical frequency of the == transition of the D1 line of 87Rb, are generated by CESPDC, as described above, and sent through the ensemble. The ensemble of 85Rb atoms is contained in an anti-reflection coated vapor cell with internal length mm, in a temperature-controlled oven at 70∘ C, together with a 0.5% residual 87Rb component. An applied axial magnetic field of up to 60 mT produces resonantly-enhanced Faraday rotation of the optical polarization. After leaving the vapor cell, the photons are separated in polarization, frequency filtered, and detected with single-photon counters. Two counters on each polarization output record all possible outcomes, i.e., coincidences of HH, HV, and VV polarizations.
Physics of near-resonant Faraday rotation

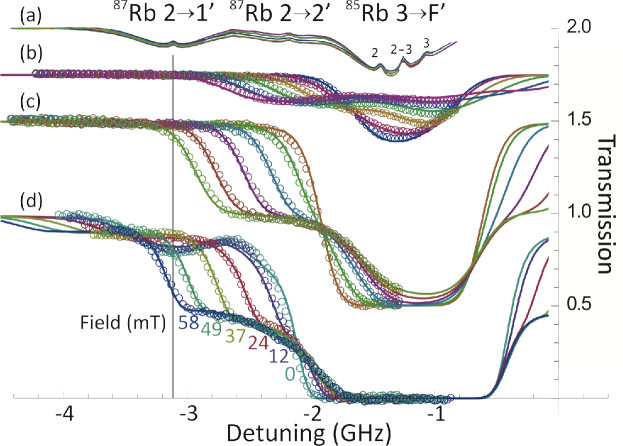
The cell, with an internal path of 75 mm and containing purified 85Rb with a small (%) admixture of 87Rb, no buffer gas, and no wall coatings that might preserve polarization, is modeled as a thermal equilibrium, Doppler-broadened vapor subject to Zeeman shifts in the intermediate regime. The atomic structure is calculated by diagonalization of the atomic Hamiltonians , where is the energy structure of the isotope isoRb including fine-structure contribution, is the hyperfine contribution, and is the Zeeman contribution. All atomic parameters are taken from references steckRb85 , steckRb87 . The matrices are numerically diagonalized to find field-dependent energy eigenstates, illustrated in Fig. 16, from which the complex linear optical polarizability is calculated, including radiative damping. The complex refractive index for polarizations is computed including Doppler broadening and a temperature-dependent atom density given by the vapor pressure times the isotope fraction, and the transfer function for the cell is calculated from the integral of the index along the beam path, including the measured drop in field strength of 15% from the center to the faces of the cell. Transmission spectroscopy, shown in Fig. 17, agrees well with theory.
Figs. 16 and 17 illustrate the optical physics of this magneto-optic rotation: The probe photons are red detuned from the 85Rb transitions, and experience the same positive contribution to the refractive index at zero field. When the B-field is applied, however, the nearby 85Rb transitions split, with the now circularly-polarized transitions moving closer or farther from the probe frequency in function of their polarization. This provides a growing refractive index contribution for one circular polarization, and a decreasing contribution for the other, i.e. a circular birefringence giving rise to polarization rotation. Due to the proximity to resonance, the rotation angle increases non-linearly with B until at around B = 50 mT the 85Rb lines begin to overlap with the probe frequency and significant absorption begins.
Faraday rotation signals with atom-tuned NooN states
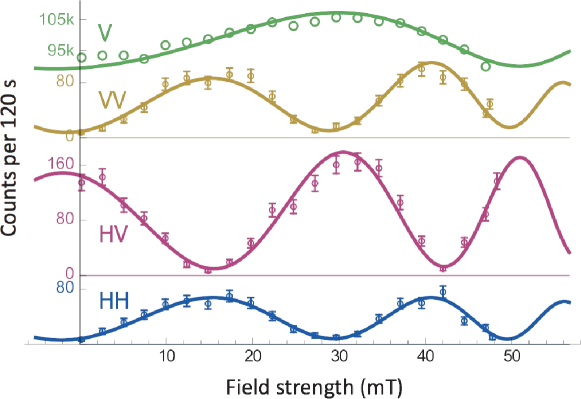
As seen in Fig. 18, all coincidence outcomes oscillate as a function of , with two-fold super-resolution relative to the single-photon oscillation, visible in the singles counts due to a small imbalance between H and V in the input state. The interference visibilities are all %, well above the 33% classical limit for HH and VV visibility AfekPRL2010 . Also shown are predicted coincidence rates WolfgrammNPhot2013 , which show good agreement.
An analysis of the Fisher information from these coincidence rates confirm the utility of entangled states for probing atomic ensembles. The NooN state achieves a factor 1.300.05 more Fisher information per photon than the standard quantum limit (SQL). I.e. it gives more information per photon than can be extracted using any state consisting of non-entangled photons. It achieves this advantage at a field of mT, near the point at which absorption begins to become important. Perhaps more important to eventual application, the NooN state gives also an advantage in Fisher information per scattered photon, the figure of merit for low-damage probing. As described in WolfgrammNPhot2013 the NooN state gives an advantage of 0.06 over the SQL.
Among other things, this exercise uncovered a previously unknown feature of quantum-enhanced sensing in imperfect interferometers, in this case those with losses. Here, as one can expect for most interferometric measurements on material systems, the loss depends on the measured quantity (here ). This dependence makes a positive contribution to the Fisher information, offsetting the well-known ThomasPeterPRL2011 reduction of Fisher information due to loss of photons.
4 Conclusions
We have described two experimental projects to generate high-spectral purity indistinguishable photon pairs using cavity-enhanced SPDC and extremely narrowband optical filters based on resonant optical effects in atomic ensembles. Combining these techniques, we have demonstrated bright sources of entangled photons pairs, with both high two-photon coherence, for example 99% fidelity with a two-photon NooN state, and high spectral purity, 94% atom-resonant heralded single photons for a type-II source and 98% atom resonant photon pairs for a type-I source. The potential for interaction with atoms is clearly shown by the generation and use of atom-tuned NooN states to beat the standard quantum limit in non-destructive probing of an atomic magnetometer. As this work goes forward, it will be interesting to see how indistinguishable photon pairs can interact with other atomic systems, for example atomic quantum memories and atomic quantum information processors.
Appendix: Second-order correlation functions of filtered output
In this section we consider the second order correlation function of the field operators in a form:
| (11) |
for multimode (unfiltered) and single-mode (filtered) output of the OPO.
As shown by Lu et al. LuPRA2000 , describing the output of a single-mode, far-below-threshold OPO has the form of double exponential decay
| (12) |
where the reflectivity of the output coupler is , the effective reflectivity resulting from intracavity losses is and is the cavity round-trip time. An ideal narrowband filter would remove all the nondegenerate cavity-enhanced spontaneous down-conversion CESPDC modes, reducing the to . This filtering effect was demonstrated in WolfgrammPRL2011 for a type-II OPO and an induced dichroism atomic filter.
In LuPRA2000 it is also predicted that when the filter is off, so that the output consists of cavity modes, takes the form
| (13) | |||||
| (14) |
i.e., with the same double exponential decay but modulated by a comb with a period equal to the cavity round-trip time . In our case the bandwidth of the output contains more than 200 cavity modes, and the fraction in Eq. (13) is well approximated by a comb of Dirac delta functions.
The comb period of ns is comparable to the ns resolution of our counting electronics, a digital time-of-flight counter (Fast ComTec P7888). This counter assigns arrival times to the signal and idler arrivals relative to an internal clock. We take the “window function” for the th bin, i.e., the probability of an arrival at time being assigned to that bin, to be
| (15) |
Without loss of generality we assign the signal photon’s bin as , and we include an unknown relative delay between signal and idler due to path length, electronics, cabling, and so forth. For a given signal arrival time , the rate of idler arrivals in the th bin is ( is the idler arrival time). This expression must be averaged over the possible within bin . We also include the “accidental” coincidence rate , where are the singles detection rates at detectors , respectively. The rate at which coincidence events are registered with bins of separation is then
| (16) | |||||
| (17) |
We take is a free parameter in fitting to the data. Note that if we write then the simultaneous events fall into th bin and determines where the histogram has the maximum visibility due to the beating between the 1 ns sampling frequency of the detection system and the 1.99 ns comb period. APD time resolution is estimated to be ps FWHM (manufacturer’s specification), i.e. significantly less than the TOF uncertainty, and is not included here.
Acknowledgements.
The work reported here involved many people over many years. I would especially like to thank Marta Abad, Federica Beduini, Alessandro Cerè, Nicolas Godbout, Valentina Parigi, Ana Predojević, Chiara Vitelli, Florian Wolfgramm, Xinxing Xing, and Joanna Zielińska, each of whom contributed something unique and essential to the work reported here, e.g. inventing a first-of-its-kind source or filter, providing insights into the physics of atomic optical instruments, or persuading difficult lasers (and their suppliers) to cooperate with our plans. Aephraim Steinberg was essential to getting the photon pair research started. The contributions of Zehui Zhai, Yannick de Icaza Astiz and Gianvito Lucivero are also much appreciated. The research was supported by various Catalan, Spanish, European, Canadian and philanthropic grants over the years. The writing of this chapter was supported by the Spanish MINECO project MAGO (Ref. FIS2011-23520), by the European Research Council project AQUMET, and by Fundació Privada CELLEX.References
- (1) Hong, C. K., Ou, Z. Y., and Mandel, L. Measurement of subpicosecond time intervals between two photons by interference. Phys. Rev. Lett. 59, 2044–2046 (1987).
- (2) Shih, Y. H. and Alley, C. O. New type of Einstein-Podolsky-Rosen-Bohm experiment using pairs of light quanta produced by optical parametric down conversion. Phys. Rev. Lett. 61, 2921–2924 (1988).
- (3) Bouwmeester, D. et al. Experimental quantum teleportation. Nature 390, 575–579 (1997).
- (4) Pan, J.-W., Bouwmeester, D., Weinfurter, H., and Zeilinger, A. Experimental entanglement swapping: Entangling photons that never interacted. Phys. Rev. Lett. 80, 3891–3894 (1998).
- (5) O’Brien, J. L., Pryde, G. J., White, A. G., Ralph, T. C., and Branning, D. Demonstration of an all-optical quantum controlled-not gate. Nature 426, 264–267 (2003).
- (6) Mitchell, M. W., Lundeen, J. S., and Steinberg, A. M. Super-resolving phase measurements with a multiphoton entangled state. Nature 429, 161–164 (2004).
- (7) Aaronson, S. and Arkhipov, A. The computational complexity of linear optics, (2010).
- (8) Wu, L.-A., Kimble, H. J., Hall, J. L., and Wu, H. Generation of squeezed states by parametric down conversion. Phys. Rev. Lett. 57, 2520–2523 (1986).
- (9) The LIGO Scientific Collaboration. A gravitational wave observatory operating beyond the quantum shot-noise limit. Nat Phys 7, 962–965 (2011).
- (10) Aasi, J. et al. Enhanced sensitivity of the ligo gravitational wave detector by using squeezed states of light. Nat Photon 7, 613–619 (2013).
- (11) Braunstein, S. and Pati, A. Quantum Information with Continuous Variables. Springer, (2010).
- (12) Wolfgramm, F. et al. Squeezed-light optical magnetometry. Phys. Rev. Lett. 105, 053601 (2010).
- (13) Koschorreck, M., Napolitano, M., Dubost, B., and Mitchell, M. W. Sub-projection-noise sensitivity in broadband atomic magnetometry. Phys. Rev. Lett. 104, 093602 (2010).
- (14) Koschorreck, M., Napolitano, M., Dubost, B., and Mitchell, M. W. Quantum nondemolition measurement of large-spin ensembles by dynamical decoupling. Phys. Rev. Lett. 105, 093602 (2010).
- (15) Sewell, R. J. et al. Magnetic sensitivity beyond the projection noise limit by spin squeezing. Phys. Rev. Lett. 109, 253605 (2012).
- (16) Sewell, R. J. et al. Ultrasensitive atomic spin measurements with a nonlinear interferometer. Phys. Rev. X 4, 021045 (2014).
- (17) Predojević, A., Zhai, Z., Caballero, J. M., and Mitchell, M. W. Rubidium resonant squeezed light from a diode-pumped optical-parametric oscillator. Phys. Rev. A 78, 063820 (2008).
- (18) Wolfgramm, F. et al. Bright filter-free source of indistinguishable photon pairs. Opt. Express 16, 18145–18151 (2008).
- (19) Wolfgramm, F., Cerè, A., and Mitchell, M. W. Noon states from cavity-enhanced down-conversion: high quality and super-resolution. J. Opt. Soc. Am. B 27, A25–A29 (2010).
- (20) Zielińska, J. A., Beduini, F. A., Lucivero, V. G., and Mitchell, M. W. Atomic filtering for hybrid continuous-variable/discrete-variable quantum optics. Opt. Express 22, 25307–25317 (2014).
- (21) Zielińska, J. A., Beduini, F. A., Godbout, N., and Mitchell, M. W. Ultranarrow Faraday rotation filter at the Rb D1 line. Opt. Lett. 37, 524–526 (2012).
- (22) Beduini, F. A., Zielińska, J. A., Lucivero, V. G., de Icaza Astiz, Y. A., and Mitchell, M. W. Interferometric measurement of the biphoton wave function. Phys. Rev. Lett. 113, 183602 (2014).
- (23) Wolfgramm, F., Vitelli, C., Beduini, F. A., Godbout, N., and Mitchell, M. W. Entanglement-enhanced probing of a delicate material system. Nat Photon 7, 28–32 (2013).
- (24) Ou, Z. Y. and Lu, Y. J. Cavity enhanced spontaneous parametric down-conversion for the prolongation of correlation time between conjugate photons. Phys. Rev. Lett. 83, 2556–2559 (1999).
- (25) Öhman, Y. On some new auxiliary instruments in astrophysical research VI. a tentative monochromator for solar work based on the principle of selective magnetic rotation Stockholms Obs. Ann. 19, 9–11 (1956).
- (26) Neergaard-Nielsen, J. S., Nielsen, B. M., Takahashi, H., Vistnes, A. I., and Polzik, E. S. High purity bright single photon source. Opt. Express 15, 7940–7949 (2007).
- (27) Haase, A., Piro, N., Eschner, J., and Mitchell, M. W. Tunable narrowband entangled photon pair source for resonant single-photon single-atom interaction. Opt. Lett. 34, 55–57 (2009).
- (28) Palittapongarnpim, P., MacRae, A., and Lvovsky, A. I. Note: A monolithic filter cavity for experiments in quantum optics. Review of Scientific Instruments 83, 066101 (2012).
- (29) Zielińska, J. A. and Mitchell, M. W. Theory of high gain cavity-enhanced spontaneous parametric down-conversion, (2014).
- (30) Predojević, A., Zhai, Z., Caballero, J. M., and Mitchell, M. W. Rubidium resonant squeezed light from a diode-pumped optical-parametric oscillator. Phys. Rev. A 78, 063820 (2008).
- (31) Yang, X., Li, S., Zhang, C., and Wang, H. Enhanced cross-kerr nonlinearity via electromagnetically induced transparency in a four-level tripod atomic system. J. Opt. Soc. Am. B 26, 1423–1434 (2009).
- (32) Camacho, R. M., Vudyasetu, P. K., and Howell, J. C. Four-wave-mixing stopped light in hot atomic rubidium vapour. Nat Photon 3, 103–106 (2009).
- (33) Yudin, V. I. et al. Vector magnetometry based on electromagnetically induced transparency in linearly polarized light. Phys. Rev. A 82, 033807 (2010).
- (34) Krupke, W. F., Beach, R. J., Kanz, V. K., and Payne, S. A. Resonance transition 795-nm rubidium laser. Opt. Lett. 28, 2336–2338 (2003).
- (35) Ries, J., Brezger, B., and Lvovsky, A. I. Experimental vacuum squeezing in rubidium vapor via self-rotation. Phys. Rev. A 68, 025801 (2003).
- (36) Agha, I. H., Messin, G., and Grangier, P. Generation of pulsed and continuous-wave squeezed light with 87Rb vapor. Opt. Express 18, 4198–4205 (2010).
- (37) Hosseini, M., Campbell, G., Sparkes, B. M., Lam, P. K., and Buchler, B. C. Unconditional room-temperature quantum memory. Nat Phys 7, 794–798 (2011).
- (38) Cere, A. et al. Narrowband tunable filter based on velocity-selective optical pumping in an atomic vapor. Opt. Lett. 34, 1012–1014 (2009).
- (39) Wolfgramm, F., de Icaza Astiz, Y. A., Beduini, F. A., Cerè, A., and Mitchell, M. W. Atom-resonant heralded single photons by interaction-free measurement. Phys. Rev. Lett. 106, 053602 (2011).
- (40) Gerhardt, I. Software - sodium data. Available at http://gerhardt.ch/sodium.php.
- (41) Kiefer, W., Low, R., Wrachtrup, J., and Gerhardt, I. Na-Faraday rotation filtering: The optimal point. Sci. Rep. 4 (2014).
- (42) Menders, J., Benson, K., Bloom, S. H., Liu, C. S., and Korevaar, E. Ultranarrow line filtering using a cs faraday filter at 852 nm. Opt. Lett. 16, 846–848 (1991).
- (43) Yin, B. and Shay, T. Faraday anomalous dispersion optical filter for the Cs 455 nm transition. Photonics Technology Letters, IEEE 4, 488–490 (1992).
- (44) Wang, Y. et al. Cs faraday optical filter with a single transmission peak resonant with the atomic transition at 455 nm. Opt. Express 20, 25817–25825 (2012).
- (45) Yin, B., Alvarez, L. S., and Shay, T. M. The rb 780-nanometer faraday anomalous dispersion optical filter: Theory and experiment. Technical report, Jet Propulsion Laboratory, (1994).
- (46) Dick, D. J. and Shay, T. M. Ultrahigh-noise rejection optical filter. Opt. Lett. 16, 867–869 (1991).
- (47) Ling, L. and Bi, G. Isotope 87Rb Faraday anomalous dispersion optical filter at 420 nm. Opt. Lett. 39, 3324–3327 (2014).
- (48) Yin, B. and Shay, T. A potassium Faraday anomalous dispersion optical filter. Optics Communications 94, 30 – 32 (1992).
- (49) Chen, H., She, C. Y., Searcy, P., and Korevaar, E. Sodium-vapor dispersive faraday filter. Opt. Lett. 18, 1019–1021 (1993).
- (50) Chan, Y. C. and Gelbwachs, J. A Fraunhofer-wavelength magnetooptic atomic filter at 422.7 nm. IEEE Journal of Quantum Electronics 29, 2379–2384 (1993).
- (51) Kuklewicz, C. E., Wong, F. N. C., and Shapiro, J. H. Time-bin-modulated biphotons from cavity-enhanced down-conversion. Phys. Rev. Lett. 97, 223601 (2006).
- (52) Kuzucu, O. and Wong, F. N. C. Pulsed sagnac source of narrow-band polarization-entangled photons. Phys. Rev. A 77, 032314 (2008).
- (53) O’Donnell, K. A. and U’Ren, A. B. Time-resolved up-conversion of entangled photon pairs. Phys. Rev. Lett. 103, 123602 (2009).
- (54) Pezzè, L. and Smerzi, A. Quantum theory of phase estimation In: Proceedings of the International School of Physics “Enrico Fermi”, Tino, G. M. and Kasevich, M. A. (eds.), volume 188 Atom Interferometry, 691 – 741 (IOS Press, Amsterdam, 2014).
- (55) Dorner, U. et al. Optimal quantum phase estimation. Phys. Rev. Lett. 102, 040403 (2009).
- (56) Escher, B. M., de Matos Filho, R. L., and Davidovich, L. General framework for estimating the ultimate precision limit in noisy quantum-enhanced metrology. Nat Phys 7, 406–411 (2011).
- (57) Boyd, G. D. and Kleinman, D. A. Parametric interaction of focused gaussian light beams. Journal of Applied Physics 39, 3597–3639 (1968).
- (58) Targat, R. L., Zondy, J.-J., and Lemonde, P. 75%-efficiency blue generation from an intracavity PPKTP frequency doubler. Optics Communications 247, 471 – 481 (2005).
- (59) Boulanger, B., Fejer, M. M., Blachman, R., and Bordui, P. F. Study of KTiOPO4 gray‐tracking at 1064, 532, and 355 nm. Applied Physics Letters 65, 2401–2403 (1994).
- (60) Adamson, R. B. A., Shalm, L. K., Mitchell, M. W., and Steinberg, A. M. Multiparticle state tomography: Hidden differences. Phys. Rev. Lett. 98, 043601 (2007).
- (61) Julsgaard, B., Sherson, J., Cirac, J. I., Fiurasek, J., and Polzik, E. S. Experimental demonstration of quantum memory for light. Nature 432, 482–486 (2004).
- (62) Sewell, R. J., Napolitano, M., Behbood, N., Colangelo, G., and Mitchell, M. W. Certified quantum non-demolition measurement of a macroscopic material system. Nat Photon 7, 517–520 (2013).
- (63) Madsen, L. B. and Mølmer, K. Spin squeezing and precision probing with light and samples of atoms in the gaussian description. Phys. Rev. A 70, 052324 (2004).
- (64) Napolitano, M. et al. Interaction-based quantum metrology showing scaling beyond the Heisenberg limit. Nature 471, 486–489 (2011).
- (65) Steck, D. A. Rubidium 85 D line data, revision 2.1.4. Available online at http://steck.us/alkalidata, (23 December 2010).
- (66) Steck, D. A. Rubidium 87 D line data, revision 2.1.4. Available online at http://steck.us/alkalidata, (23 December 2010).
- (67) Afek, I., Ambar, O., and Silberberg, Y. Classical bound for mach-zehnder superresolution. Phys. Rev. Lett. 104, 123602 (2010).
- (68) Thomas-Peter, N. et al. Real-world quantum sensors: Evaluating resources for precision measurement. Phys. Rev. Lett. 107, 113603 (2011).
- (69) Lu, Y. J. and Ou, Z. Y. Optical parametric oscillator far below threshold: Experiment versus theory. Phys. Rev. A 62, 033804 (2000).