Pressure-induced electronic phase separation of magnetism and superconductivity in CrAs
Abstract
The recent discovery of pressure induced superconductivity in the binary helimagnet CrAs has attracted much attention. How superconductivity emerges from the magnetic state and what is the mechanism of the superconducting pairing are two important issues which need to be resolved. In the present work, the suppression of magnetism and the occurrence of superconductivity in CrAs as a function of pressure () were studied by means of muon spin rotation. The magnetism remains bulk up to kbar while its volume fraction gradually decreases with increasing pressure until it vanishes at 7 kbar. At 3.5 kbar superconductivity abruptly appears with its maximum K which decreases upon increasing the pressure. In the intermediate pressure region ( kbar) the superconducting and the magnetic volume fractions are spatially phase separated and compete for phase volume. Our results indicate that the less conductive magnetic phase provides additional carriers (doping) to the superconducting parts of the CrAs sample thus leading to an increase of the transition temperature () and of the superfluid density (). A scaling of with as well as the phase separation between magnetism and superconductivity point to a conventional mechanism of the Cooper-pairing in CrAs.
The pressure-induced superconductivity in the binary helimagnet CrAs has recently attracted much attention Wu_Arxiv_14 ; Kotegawa_JPSJ_14 ; Kotegawa_Arxiv_14 ; Keller_Arxiv_14 ; Shen_Arxiv_14 . At ambient pressure CrAs is characterized by a relatively high Néel temperature K Watanabe_69 ; Selte_71 ; Boller_71 . decreases approximately by a factor of three for pressures () approaching kbar, above which the magnetism completely disappears Wu_Arxiv_14 ; Kotegawa_JPSJ_14 ; Kotegawa_Arxiv_14 . On the other hand superconductivity sets in for pressures exceeding kbar thus revealing a range of kbar where superconductivity and magnetism coexist.
The close proximity of superconductivity to magnetism, the similarity of the phase diagram of CrAs with that of some Fe-based superconductors, as well as the absence of the coherent Hebel-Slichter peak in the nuclear relaxation rate made the authors of Refs. Wu_Arxiv_14, ; Kotegawa_JPSJ_14, ; Kotegawa_Arxiv_14, ; Shen_Arxiv_14, to suggest an unconventional pairing mechanism. It should be noted, however, that the similarity of the phase diagram does not necessarily requires a similar mechanism of Cooper-pairing. The Hebel-Slichter peak can also be suppressed in conventional wave superconductors. This is e.g. the case for superconductors in the strong coupling limit Ohsugi_JPSJ_91 , for superconductors having a spread of over the sample, or for slight gap anisotropies Stenger_PRL_91 . Whether a coherence peak is present at all in the archetypical two-gap superconductor MgB2 is still subject of discussion Jung_PRB_01 ; Baek_PRB_02 . One needs, therefore, a more detailed investigation of the superconducting response of CrAs as well as an understanding on how superconductivity emerges from a compound being initially in a strong magnetic state.
In this paper we report on muon spin rotation (SR) studies of the magnetic and the superconducting properties of CrAs. We first discuss separately the magnetic and the superconducting responses as a function of pressure, and concentrate later on the issue of coexistence between magnetism and superconductivity.
Results
Magnetism in CrAs.
The magnetic response of CrAs powder samples was studied by zero field (ZF) and weak transverse field (wTF) SR
experiments. In the following we discuss the SR data for three different pressure regions.
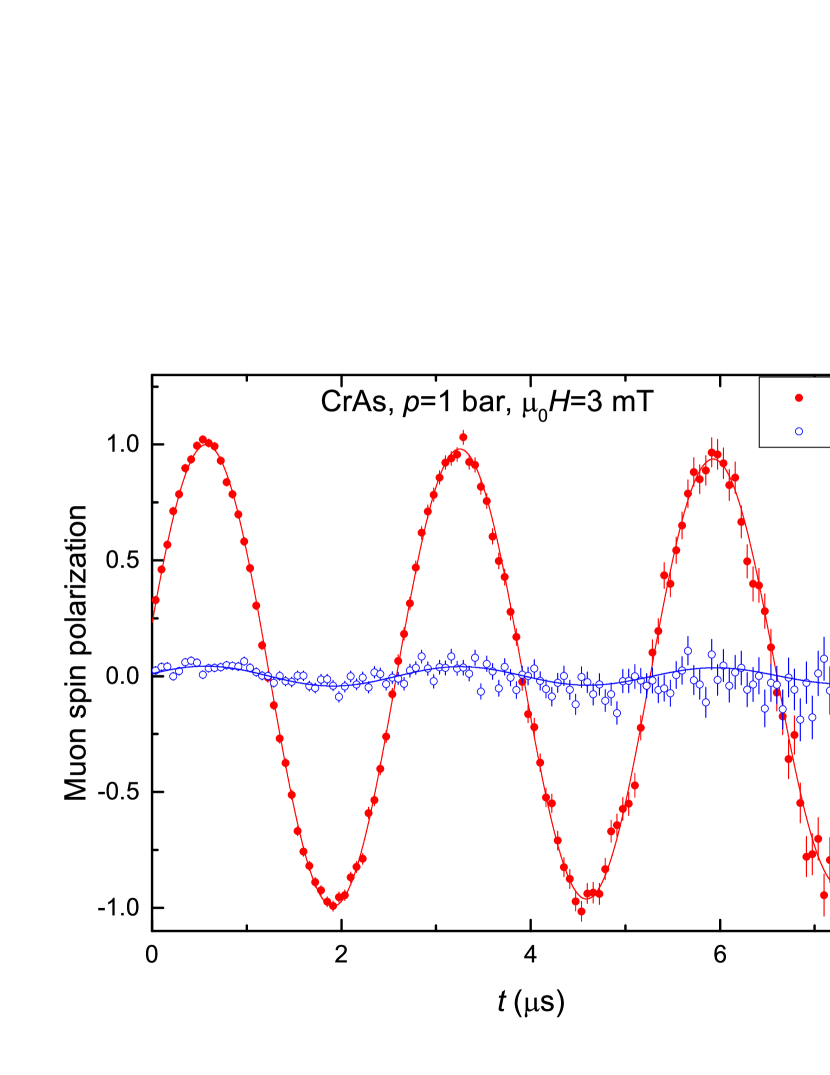
In the low-pressure region, bar kbar, spontaneous muon spin precession is clearly seen in the ZF SR time spectra (see Fig. 1 a) thus confirming that long range magnetic order is established below . The oscillating part of the signal is accurately described by a field distribution characterized by a minimum () and a maximum () cutoff field (see the inset in Fig. 1 a), which is consistent with the observation of helimagnetic incommensurate magnetic order Keller_Arxiv_14 ; Shen_Arxiv_14 ; Watanabe_69 ; Selte_71 ; Boller_71 . The relatively high values of the cutoff fields ( T and T at bar) are in agreement with the large moments bar as obtained by means of neutron powder diffraction Keller_Arxiv_14 . The wTF SR experiments performed at ambient pressure and at kbar show relatively sharp transitions to the magnetic state and prove that the magnetism occupies close to 100% of the sample volume (see Fig. 1 b and Fig. Sup 3 in the Supplementary material). The hysteresis in signifies a first order magnetic phase transition.
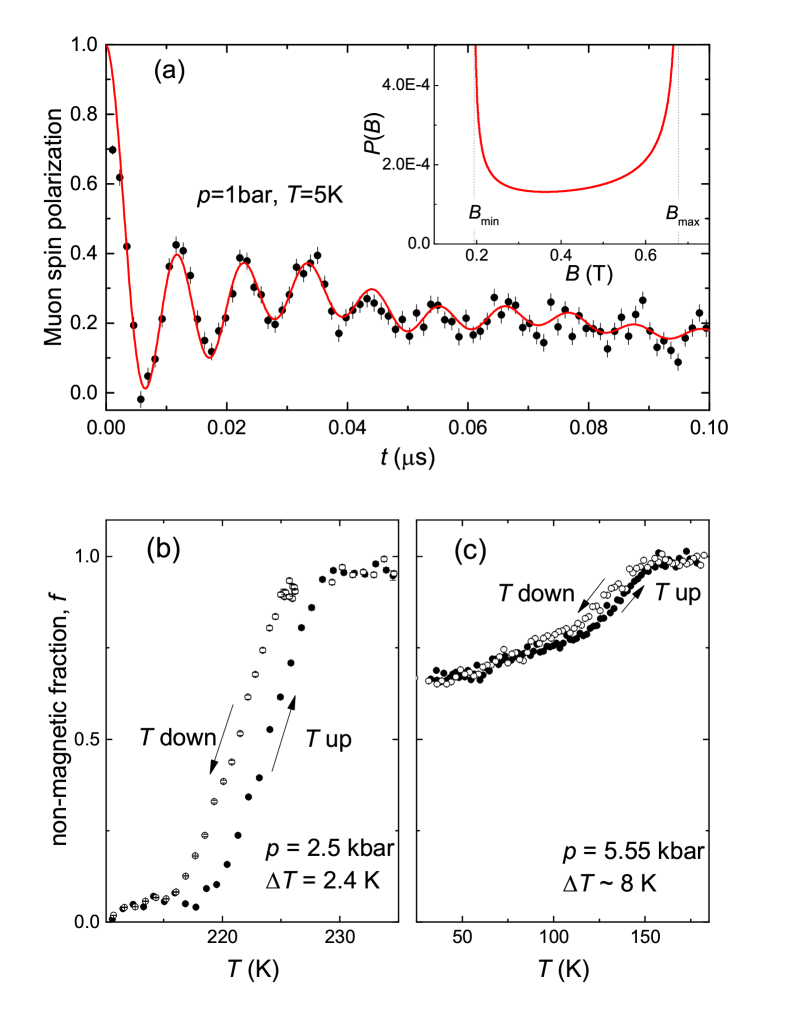
In the intermediate pressure region ( kbar) the cutoff fields, which are proportional to the ordered moment, decrease continuously and reach at kbar T and T (see Fig. Sup 1 in the Supplementary materials). This is consistent with a decrease of the ordered magnetic moment to kbar . The wTF SR experiments reveal that the low temperature value of the non-magnetic fraction gradually increases with increasing pressure by reaching for pressures exceeding 7 kbar (see Fig. 1 c and Fig. Sup 3 in the Supplementary materials). Therefore in the intermediate pressure region the sample is separated into a magnetically ordered phase and a non-magnetic phase. The hysteresis in confirms that the magnetic transition remains of first order at all pressures (see Fig. 1 c).
For pressures above 7 kbar the ZF SR experiments prove the absence of any type of magnetic order as exemplified by the weakly damped wTF SR time spectra.
Superconductivity in CrAs.
The superconducting response of CrAs was studied in transverse field (TF) SR experiments (applied field mT). From the experimental data we have extracted the magnetic penetration depth , which is related to the superfluid density in terms of ( charge carrier concentration and carrier effective mass). The magnetic penetration depth was determined from the Gaussian muon-spin depolarization rate , which reflects the second moment of the magnetic field distribution in the superconductor in the mixed state Zimmermann_PRB_95 . is related to via Brandt_PRB_88 ( Wb is the magnetic flux quantum, and MHz/T is the muon gyromagnetic ratio).
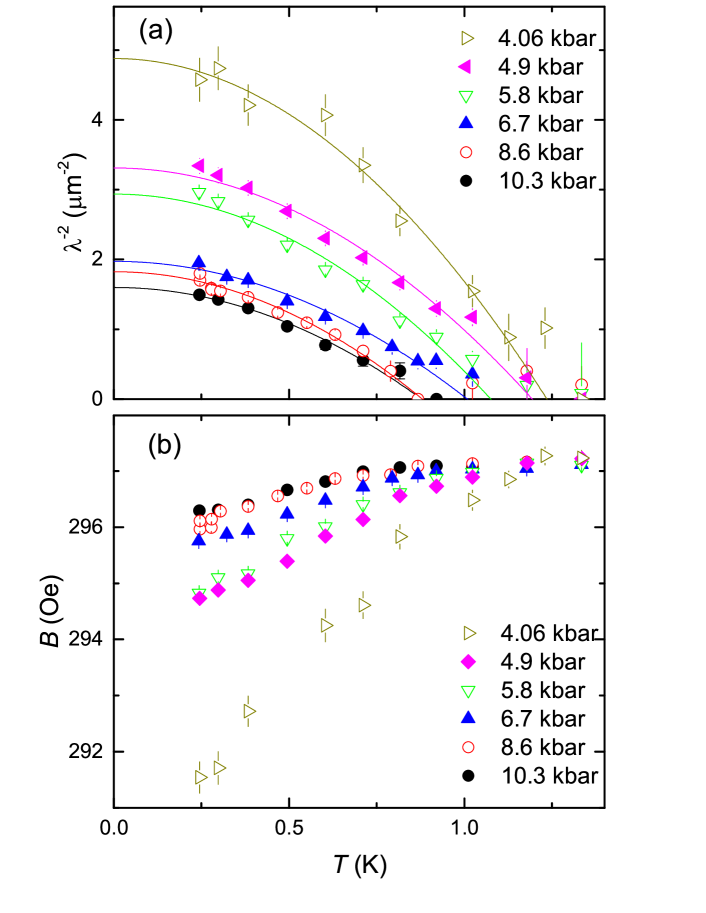
The measured and the internal field of CrAs for , 4.9, 5.8, 6.7, 8.6 and 10.3 kbar are shown in Figs. 2 a and 2 b. Note that and were derived from the fraction of the sample remaining in the non-magnetic state down to the lowest temperature (see Fig. 3 a). Due to the strongly damped signal in the magnetic phase one is unable to measure any superconducting response in the magnetic fraction of the sample. We believe, however that superconductivity in CrAs cannot emerge in the magnetically ordered parts for two following reasons. First, Wu et al. Wu_Arxiv_14 have shown that the low-temperature diamagnetic susceptibility () of CrAs is nearly zero for pressures kbar, increases linearly in the range and reaches its maximum value, close to the ideal , for pressures exceeding 7.85 kbar. It follows almost exactly the pressure dependence of the non-magnetic fraction as observed in our wTF and TF SR experiments (see Fig.3 a) comment1 . Second, the large magnetic moment and its weak reduction as a function of pressure (see Fig. 3 b) require the separation of CrAs in superconducting and magnetic domains. This is e.g. the case for the so-called ’245’ family of Fe-based superconductors Li_NatPh_12 ; Maletz_PRB_13 , which is characterized by the high value of both, magnetic moment ( ) and Néel temperature ( K) Shermadini_PRL_11 ; Bao_ChPL_11 ; Wang_NatCom_11 ; Li_PRB_11 . Note that within the full pressure range studied here the value of the ordered magnetic moment in CrAs is only a factor of two smaller than that in ’245’ superconductors.
The absence of experimental points below K does not allow us to draw any conclusion about the possible gap symmetry in CrAs based on the data. Therefore, they were fitted to a power law with the common exponent for all data sets. Values for the superconducting transition temperature and the inverse squared zero-temperature magnetic penetration depth obtained from these fits are plotted in Figs. 3 c and 3 d.
Discussion
Interplay between magnetism and superconductivity.
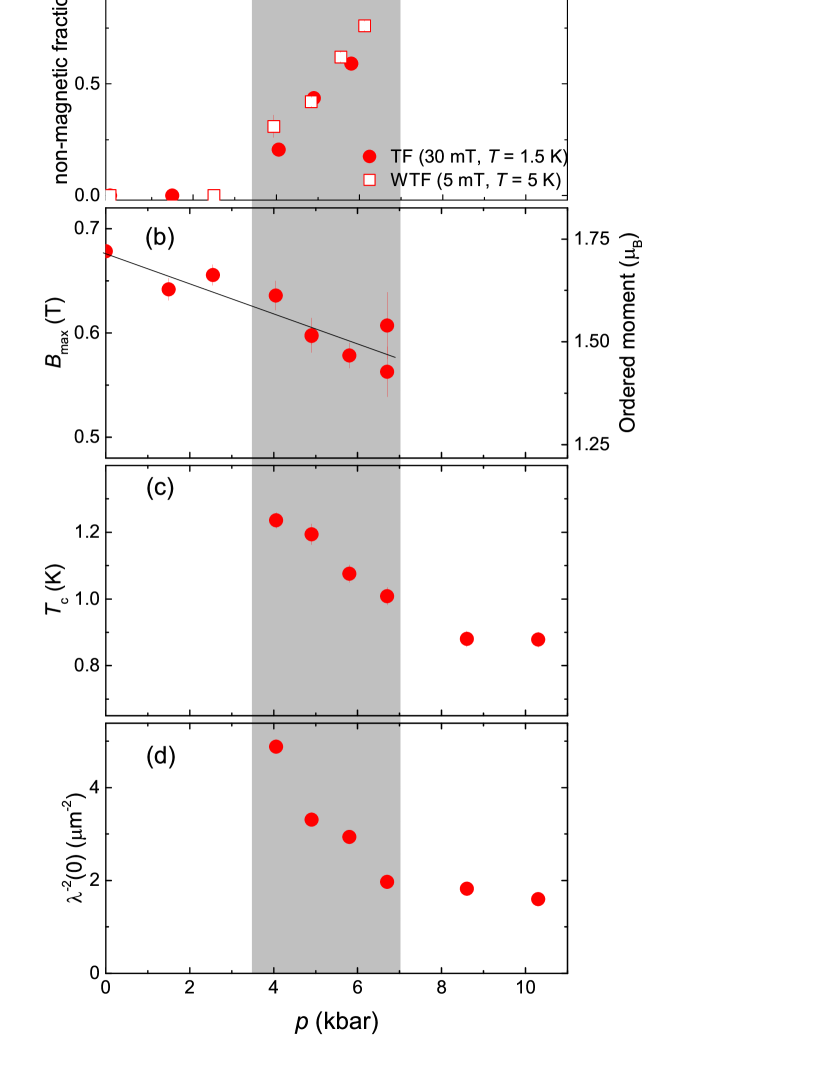
Figure 3 summarizes our results on the magnetism and superconductivity in CrAs as a function of pressure.
CrAs remains purely magnetic up to kbar. Above this pressure and up to kbar both, magnetic and
superconducting responses are clearly detected in a set of ZF, wTF, and TF SR experiments. CrAs is phase separated into
volumes where long range magnetic order is established below the Néel temperature and into non-magnetic volumes becoming superconducting below the critical temperature .
It is interesting to note that, besides the competition for the volume, there is no evidence for a competition between the magnetic and superconducting order parameter in CrAs. This is in
contrast to various Fe-based and cuprate superconductors where it is generally observed. Indeed, the ordered magnetic moment
stays almost constant, by changing less than 15% from 1.73 at bar to 1.47 at kbar, see
Fig. 3 b. , in their turn, evolves smoothly with pressure without showing any pronounced features at kbar, i.e. where the non-magnetic phase starts to develop (see
Refs. Wu_Arxiv_14, ; Kotegawa_JPSJ_14, ; Kotegawa_Arxiv_14, ; Shen_Arxiv_14, ).
Figs. 3 a and 3 d demonstrate that the maximum value of the superfluid density is observed at the low pressure side of the phase separated region i.e. in the region where the non-magnetic volume fraction is the smallest. With further increasing , the superfluid density decreases until it saturates when . By neglecting the pressure effect on the charge carrier mass , the superfluid density is simply proportional to the carrier concentration . We may assume, therefore, that within the phase separated region carriers from the ’less conductive’ magnetically ordered parts of the sample can be supplied to the ’more conductive’ non-magnetic parts, which become superconducting at low temperatures. The effect of supplying additional carriers, which can be considered as ”doping”, is expected to be the strongest if the magnetic volume fraction exceeds substantially the paramagnetic one (), while it should decrease and even vanishes completely for approaching 1. Figs. 3 a and 3 d imply that this is exactly the case for CrAs. Effectively, the non-magnetic volume fraction anticorrelates with the superfluid density .
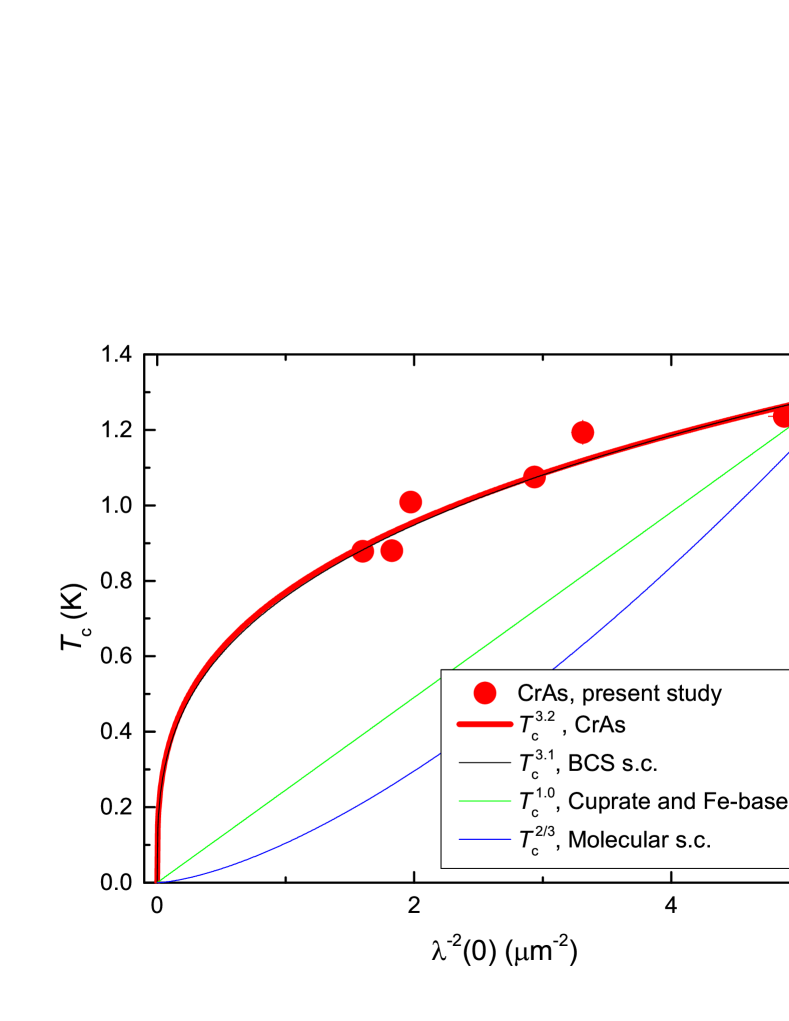
Correlation between and . Figs. 3 c and 3 d show that and have similar pressure dependences, which could point to a possible correlation between these quantities. The famous ”Uemura line” establishes a linear relation between and for various families of underdoped cuprate high-temperature superconductors Uemura_PRL_89 ; Uemura_PRL_91 . A similar linear relation was observed in recently discovered Fe-based superconductors Luetkens_PRL_08 ; Khasanov_PRB_08 ; Goko_PRB_09 ; Pratt_PRB_09 . In molecular superconductors was found to be proportional to Pratt_PRL_05 , while in some phonon mediated BCS superconductors Khasanov_PRB_08_2 . Figure 4 shows that in CrAs the data scales as thus suggesting that superconductivity in CrAs is most probably BCS like and is mediated by phonons.
A further indication of conventional electron-phonon coupling in CrAs comes from the observed macroscopic phase separation of the magnetic and the superconducting phases. Following Ref. Fernandes_PRB_10, , the relative phase difference () of the superconducting order parameter between different parts of Fermi surface or Fermi surface sheets may lead either to stabilization of microscopic coexistence of the magnetic and superconducting phases or drive both to repel each other. This happens because the staggered magnetic moment (M) plays in a superconductor the role of an intrinsic Josephson coupling with the free energy term (, are the superconducting order parameters at different parts of the Fermi surface or Fermi surface sheets). If the superconducting order is a conventional one, (i.e. there is no internal phase change, ), this term increases the total energy, thus making both phases unlikely to coexist. On the contrary, if the phases are opposite such that the Josephson coupling term in the free energy is negative. As a result both the superconducting and the magnetic phases like to coexist. This explains why the magnetic and superconducting orders do coexist microscopically in some unconventional superconductors like ferropnictides, electron-doped cuprates, and heavy-fermion systems where the order parameter has an internal phase shift. In CrAs, however, the phase diagram points towards an isotropic wave symmetry of the superconducting order parameter driven by electron-phonon interaction.
Conclusions
To conclude, the magnetic and the superconducting properties of CrAs as a function of pressure were studied by means of muon
spin rotation. The bulk magnetism exists up to kbar, while the purely non-magnetic state develops for pressures
above kbar. In the intermediate pressure region ( kbar) the magnetic phase volume
decreases continuously and superconductivity develops in parts of the sample remaining non-magnetic down to the lowest
temperatures. Both, the superconducting transition temperature and the zero-temperature superfluid density
decrease with increasing pressure in the intermediate pressure region and saturate for exceeding kbar i.e. in the region where magnetism is completely suppressed.
Our results suggest that the pressure-induced transition of CrAs from a magnetic to a superconducting state is characterized by a separation in macroscopic size magnetic and superconducting volumes. The less conductive magnetic phase provides additional carriers (doping) to the superconducting parts of CrAs. This would naturally explain the substantial increase of both, the transition temperature (from 0.9 K to 1.2 K) and the superfluid density (up to %), in the phase coexistence region. The superfluid density was found to scale with as , which, together with the clear phase separation between magnetism and superconductivity, points towards a conventional mechanism of the Cooper-pairing in CrAs.
References
- (1) Wu, W. et al. Superconductivity in the vicinity of antiferromagnetic order in CrAs. Nat. Commun. 5, 5508 (2014).
- (2) Kotegawa, H., Nakahara, S., Tou, H. & Sugawara, H. Superconductivity of 2.2 K under Pressure in Helimagnet CrAs. J. Phys. Soc. Jpn. 83, 093702 (2014).
- (3) Kotegawa, H., Tou, H., Sugawara, H. & Harima, H. Unconventional Superconductivity in the Vicinity of Strong First-Order Helimagnetic Transition in CrAs: 75As-Nuclear Quadrupole Resonance Study. arXiv:1408.3185.
- (4) Keller, L. et al. Pressure dependence of the magnetic order in CrAs: A neutron diffraction investigation. Phys. Rev. B 91, 020409(R) (2015).
- (5) Shen, Y. et al. Structural and magnetic phase diagram of CrAs and its relationship with pressure-induced superconductivity. arXiv:1409.6615.
- (6) Watanabe, H., Kazama, N., Yamaguchi, Y. & Ohashi, M. Magnetic structure of CrAs and Mn-substituted CrAs. J. Appl. Phys. 40, 1128 (1969).
- (7) Selte, K., Kjekshus, A., Jamison, W.E., Andresen, A.F. & Engebretsen, J. E. Magnetic structure and properties of CrAs. Acta Chem. Scand. 26, 1703 (1971).
- (8) Boller, H. & Kallel, A. First order crystallographic and magnetic phase transition in CrAs. Solid State Comm. 9, 1699 (1971).
- (9) Ohsugi, S., Kitaoka, Y., Kyogaku, M., Ishida, K., Asayama, K. & Ohtani, T. Nuclear Relaxation Study in Strong Coupling Superconductors –A Comparison with High- Superconductors. J. Phys. Soc. Jpn. 61, 3054-3057 (1992).
- (10) Stenger, V.A., Pennington, C.H., Buffinger, D.R. & Ziebarth, R.P. Nuclear Magnetic Resonance of A3C60 Superconductors. Phys. Rev. Lett. 74, 1649-1652 (1995).
- (11) Jung, J.K., Baek, S.H., Borsa, F., Bud’ko, S.L., Lapertot, G. & Canfield, P.C. 11B NMR and relaxation in the MgB2 superconductor. Phys. Rev. B 64, 012514 (2001).
- (12) Baek, S.H. et al. NMR spectroscopy of the normal and superconducting states of MgB2 and comparison to AlB2. Phys. Rev. B 66, 104510 (2002).
- (13) Zimmermann, P. et al. Muon-spin-rotation studies of the temperature dependence of the magnetic penetration depth in the YBa2Cu3Ox family and related compounds. Phys. Rev. B 52, 541-552 (1995).
- (14) Brandt, E.H. Flux distribution and penetration depth measured by muon spin rotation in high- superconductors. Phys. Rev. B 37, 2349-2352 (1988).
- (15) There is approximately 0.8 kbar systematic shift between reported in Ref. Wu_Arxiv_14, and measured here. It could be caused by the sample difference or/and by the pressure determination procedure.
- (16) Li, W. et al. Phase separation and magnetic order in K-doped iron selenide superconductor. Na. Phys. 8, 126-130 (2012).
- (17) Maletz, J. et al. Photoemission and muon spin relaxation spectroscopy of the iron-based Rb0.77Fe1.61Se2 superconductor: Crucial role of the cigar-shaped Fermi surface. Phys. Rev. B 88, 134501 (2013).
- (18) Shermadini, Z. et al. Coexistence of Magnetism and Superconductivity in the Iron-Based Compound Cs0.8(FeSe0.98)2. Phys. Rev. Lett. 106, 117602 (2011).
- (19) Bao, W., Huang, Q.-Z., Chen, G.-F., Wang, D.-M., He, J.-B. & Qiu, Y.-M. A Novel Large Moment Antiferromagnetic Order in K0.8Fe1.6Se2 Superconductor. Chin. Phys. Lett. 28, 086104 (2011).
- (20) Wang, M. et al. Spin waves and magnetic exchange interactions in insulating Rb0.89Fe1.58Se2. Nat. Commun. 2, 580 (2011).
- (21) Li, C.-H., Shen, B., Han, F., Zhu, X. & Wen, H.-H. Transport properties and anisotropy of Rb1−xFe2−ySe2 single crystals. Phys. Rev. B 83, 184521 (2011).
- (22) Uemura, Y.J. et al. Universal Correlations between and (Carrier Density over Effective Mass) in High- Cuprate Superconductors. Phys. Rev. Lett. 62, 2317-2320 (1989).
- (23) Uemura, Y.J. et al. Basic similarities among cuprate, bismuthate, organic, Chevrel-phase, and heavy-fermion superconductors shown by penetration-depth measurements. Phys. Rev. Lett. 66, 2665-2668 (1991).
- (24) Luetkens, H. et al. Field and Temperature Dependence of the Superfluid Density in LaFeAsO1-xFx Superconductors: A Muon Spin Relaxation Study. Phys. Rev. Lett. 101, 097009 (2008).
- (25) Khasanov, R. et al. Muon spin rotation studies of SmFeAsO0.85 and NdFeAsO0.85 superconductors. Phys. Rev. B 78, 092506 (2008).
- (26) Goko, T. et al. Superconducting state coexisting with a phase-separated static magnetic order in (Ba,K)Fe2As2, (Sr,Na)Fe2As2, and CaFe2As2. Phys. Rev. B 80, 024508 (2009).
- (27) Pratt, F.L. et al. Enhanced superfluid stiffness, lowered superconducting transition temperature, and field-induced magnetic state of the pnictide superconductor LiFeAs. Phys. Rev. B 79, 052508 (2009).
- (28) Pratt, F.L. & Blundell, S.J. Universal Scaling Relations in Molecular Superconductors. Phys. Rev. Lett. 94, 097006 (2005).
- (29) Khasanov, R., Shengelaya, A., Maisuradze, A., Di Castro, D., Escamilla, R. & Keller, H. Correlation between the transition temperature and the superfluid density in BCS superconductor NbB2+x. Phys. Rev. B 77, 064506 (2008).
- (30) Fernandes, R.M & Schmalian, J. Competing order and nature of the pairing state in the iron pnictides. Phys. Rev. B 82, 014521 (2010).
- (31) Zhigadlo, N.D. et al. High-pressure flux growth, structural, and superconducting properties of LnFeAsO (Ln = Pr, Nd, Sm) single crystals. Phys. Rev. B 86, 214509 (2012).
- (32) Saparov, B., Mitchell, J.E. & Sefat A.S. Properties of Binary Transition-Metal Arsenides (TAs). Supercond. Sci. Technol. 25, 084016 (2012).
- (33) Andreica, D. Magnetic phase diagram in some Kondo-lattice compounds. Ph.D. thesis, ETH-Zurich (2001).
Methods
Sample preparation.
Two type of policristalline CrAs samples were used during our studies.
The first type of samples was prepared by means of high-pressure synthesis. Overall details of the sample cell assembly and high-pressure synthesis process can be found in Ref. Zhigadlo_PRB_12, . The mixture of Cr (99.9%) and As (99.99%) powders in a molar ratio 1:1 was enclosed in a boron nitride (BN) crucible and placed inside a pyrophylite cube with a graphite heater. In a typical run, the sample was compressed to 15 kbar at room temperature. While keeping pressure constant, the temperature was ramped up to 1300 oC in 3 h, held there for a period of 9 h, and then cooled down to the room temperature in 3 h. Afterwards, the pressure was released and the sample removed. On two such synthesized samples the ZF and wTF SR experiments under ambient pressure were conducted.
The second type of polycristalline CrAs samples was synthesized by solid state reaction as described in Saparov_SST_12 . The sample obtained by this method was used in ZF and wTF studies under ambient pressure and in all experimental studies under the pressure.
Pressure Cell. The pressure was generated in a piston-cylinder type of cell made of CuBe alloy, which is especially designed to perform muon-spin rotation experiments under pressure Andreica01 . As a pressure transmitting medium 7373 Daphne oil was used. The pressure was measured in situ by monitoring the pressure shift of the superconducting transition temperature of In. The maximum safely reachable pressures at and 3 K are 14 and 11 kbar, respectively Andreica01 .
Muon-spin rotation (SR). SR measurements at zero field (ZF) and field applied transverse to the initial muon-spin polarization were performed at the M3 and E1 beamlines (Paul Scherrer Institute, Villigen, Switzerland), by using the GPS and GPD spectrometers, respectively. At the GPS spectrometer, equipped with a continuous flow 4He cryostat, ZF and 3 mT weak transverse field (wTF) experiments at ambient pressure and down to temperatures K were carried out. At the GPD spectrometer, equipped with an Oxford sorption pumped 3He cryostat (base temperature K) and continuous flow 4He cryostat (base temperature K), the ZF, 5 mT wTF, and 30 mT transverse field (TF) SR experiments under pressure up to 10.3 kbar were conducted. All ZF and TF experiments were performed by stabilizing the temperature prior to recording the muon-time spectra. In the wTF experiments under pressure the temperature was swept up and down with the rate K/min. The data were collected continuously. Each muon-time spectra was recorded during approximately 5 minutes.
In a SR experiment nearly 100% spin-polarized muons are implanted into the sample one at a time. The positively charged muons thermalize at interstitial lattice sites, where they act as magnetic microprobes. The muon spin precesses about the local magnetic field at the muon site with the Larmor frequency ( MHz/T is the muon gyromagnetic ratio).
In pressure experiments a large fraction of the muons, roughly 50%, stops in the pressure cell walls adding a background contribution, which has to be separated from the sample signal in the data analysis. The detailed description of the data analysis procedure is given in the ”Supplementary material” part.
Acknowledgments
Part of this work was performed at the Swiss Muon Source (SS) Paul Scherrer Insitute, Villigen, Switzerland. The work at
the Oak Ridge National Laboratory was supported by the Department of Energy, Office of Science Basic Energy Sciences,
Materials Science and Engineering Division (AS); also partially by the LDRD program (MS). The authors acknowledge helpful
discussions with L. Keller, J. White, and M. Frontzek.
Author contributions
R.K. have performed the experiment, analyzed the data and wrote the paper. Z.G. and H.L. have taken part in SR experiments. N.D., M.A.S. and A.S.S. prepared the samples. I.E. have provided the theory description. Z.G., I.E, H.L., A.A., P.K.B, Ch.R, A.S.S, and E.M. took part in discussions and preparation of the manuscript.
Additional Information
Correspondence and requests for materials should be addressed to R.K. (rustem.khasanov@psi.ch).
Supplementary materials for ”Pressure-induced electronic phase separation of magnetism and superconductivity in CrAs”
.0.1 Muon-spin rotation data analysis procedure
In pressure experiments a large fraction of the muons, roughly 50%, stops in the pressure cell walls. The fit function consists, therefore, of the ”sample” and the background (pressure cell) contributions and is described as:
| (S1) |
Here and are the initial asymmetries and and are the muon-spin polarizations belonging to the sample and the pressure cell, respectively. The polarization of the pressure cell is generally studied in separated set of experiments.
.0.2 ZF SR experiments.
At ambient pressure CrAs is characterized by long-range helimagnetic order with a propagation vector parallel to the axis and the magnetic moments lie in the plane S (1). The ordered magnetic moment per Cr is S (1). Due to the incommensurability of the magnetic structure, a continuous set of local fields is expected to be seen at each particular muon stopping site. It was shown that such a magnetic structure leads to a field distribution given by S (2, 3, 4):
| (S2) |
and is characterised by two peaks due to the minimum () and maximum() cutoff fields (see the inset in Fig. 1 in the main text). Considering only one muon stopping site, the ZF muon-spin polarization for a powder sample would follow the relation S (4):
| (S3) |
Here and are the transverse and the longitudinal exponential relaxation rates, respectively. The occurrence of 2/3 oscillating and 1/3 non–oscillating SR signal fractions originates from the spatial averaging in powder samples, where 2/3 of the magnetic field components are perpendicular to the muon-spin and cause a precession, while the 1/3 longitudinal field components do not.
Figure Sup 1 shows the dependence of the minimum and the maximum cutoff fields of CrAs on pressure. Points were obtained from the fit of ZF and wTF SR data measured at K. Both and decrease with increasing pressure. Following Ref. S, 5 for a helical magnetic structure the upper and the lower cutoff fields should scale as and , respectively. Linear fits resulting in mT/kbar and mT/kbar thus confirm this statement.
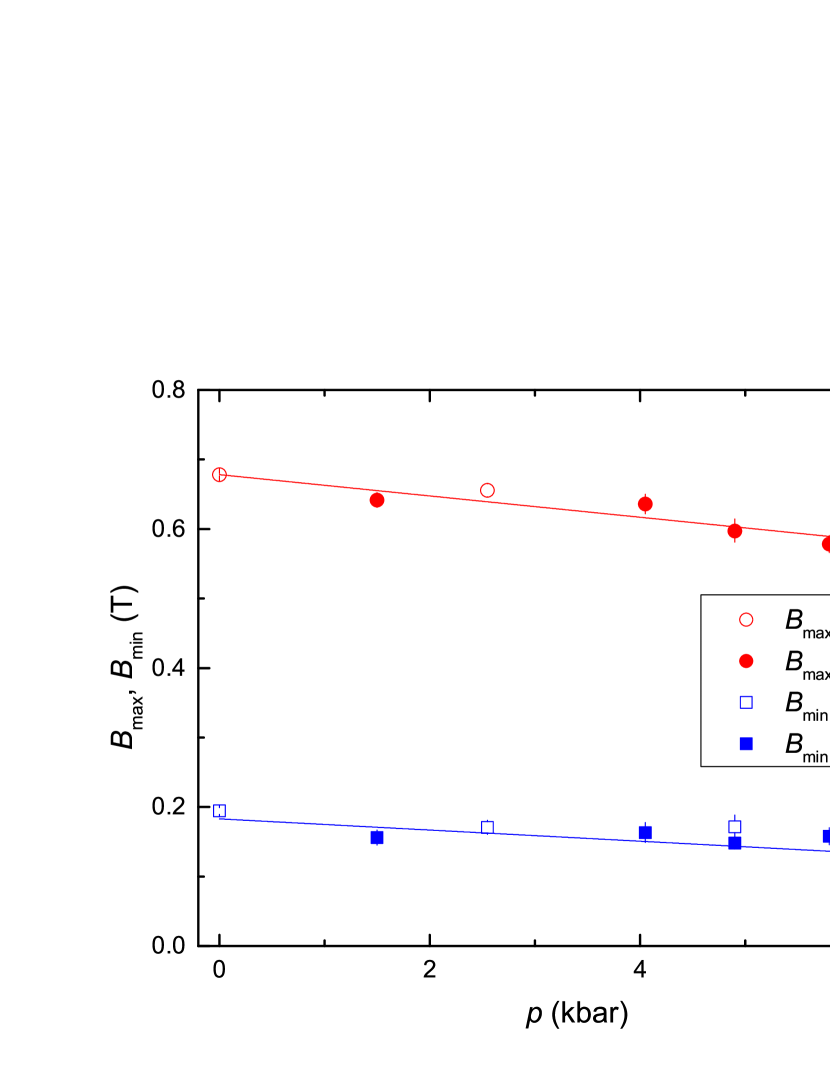
The decrease of and with increasing pressure implies a decrease of the ordered magnetic moment. By taking into account that the ambient pressure value of the ordered moment per Cr was found to be S (1) our results would imply that with increasing pressure up to kbar Cr moments decrease down to .
.0.3 wTF SR experiments.
SR experiments under weak transverse field (wTF) applied perpendicular to the muon-spin polarization are a straightforward method to determine the onset of the magnetic transition and the magnetic volume fraction. In this case the contribution to the asymmetry from muons experiencing a vanishing internal spontaneous magnetisation can be accurately determined. Muons stopping in a non-magnetic environment produce long lived oscillations, which reflect the coherent muon precession around the external field . Muons stopping in magnetically ordered parts of the sample give rise to a more complex, distinguishable signal, reflecting the vector combination of internal and external fields. The random orientation of the grains in a powder sample leads to a broad distribution of precession frequencies.
The situation is substantially simplified for (weak transverse field regime). In this case one can neglect the influence of on and the fitting function becomes:
| (S4) | |||||
Here and are the initial non-magnetic and magnetic asymmetry, respectively, is the initial phase of the muon-spin ensemble, and is the temperature independent Gaussian relaxation rate caused by nuclear moments. represent the ZF magnetic polarization and is described by Eq. (S3).
Figure Sup 2 represents the wTF SR time spectra measured at ambient pressure above ( K) and below ( K) the magnetic transition ( K). The solid lines correspond to the fit of the first term on the right-hand side of Eq. (S4) to the experimental data. The ”magnetic term” [] vanishes within the first s and thus is not observed with the present data binning ( s). The ”pressure cell” contribution is missing since experiments under ambient pressure were performed by using the sample outside of the cell on the low-background GPS spectrometer.
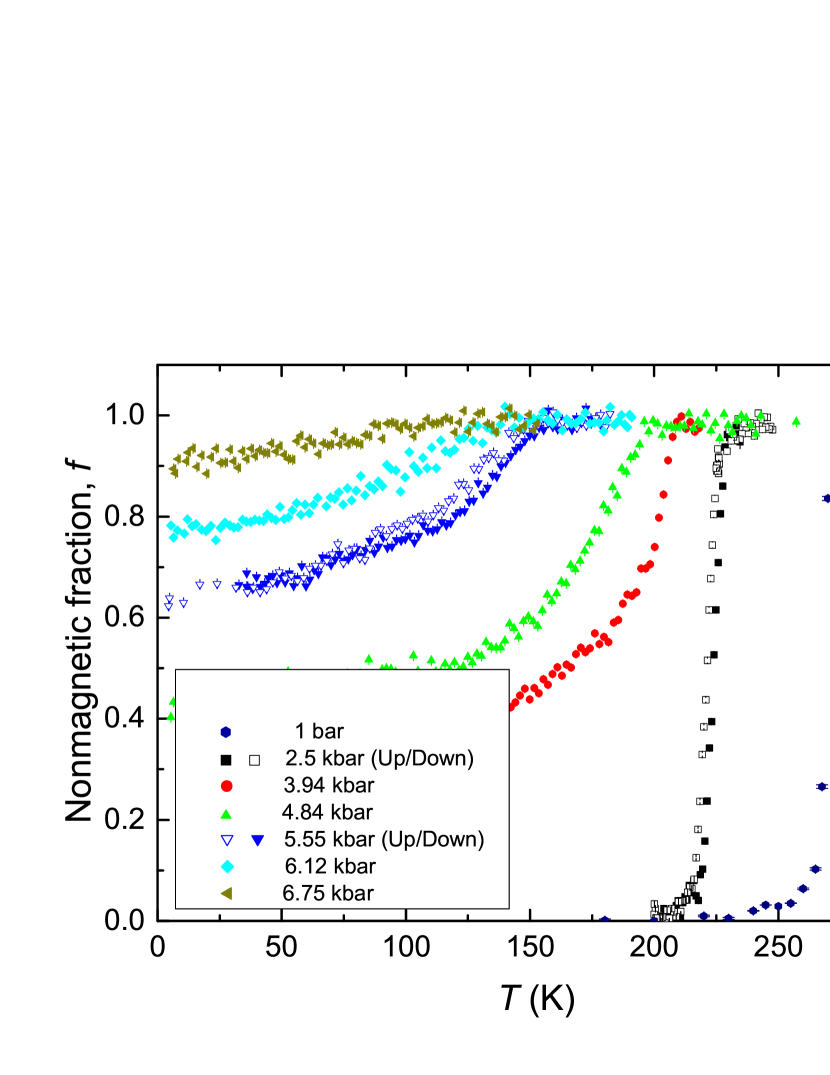
Figure Sup 3 demonstrates the dependence of the non-magnetic volume fraction on temperature at various pressures.
.0.4 TF SR experiments
Figure Sup 4 shows the TF SR time spectra measured at K and 1.5 K at kbar. The stronger damping at K is due to inhomogeneous field distribution caused by formation of the flux line lattice (FLL) in the superconducting CrAs.
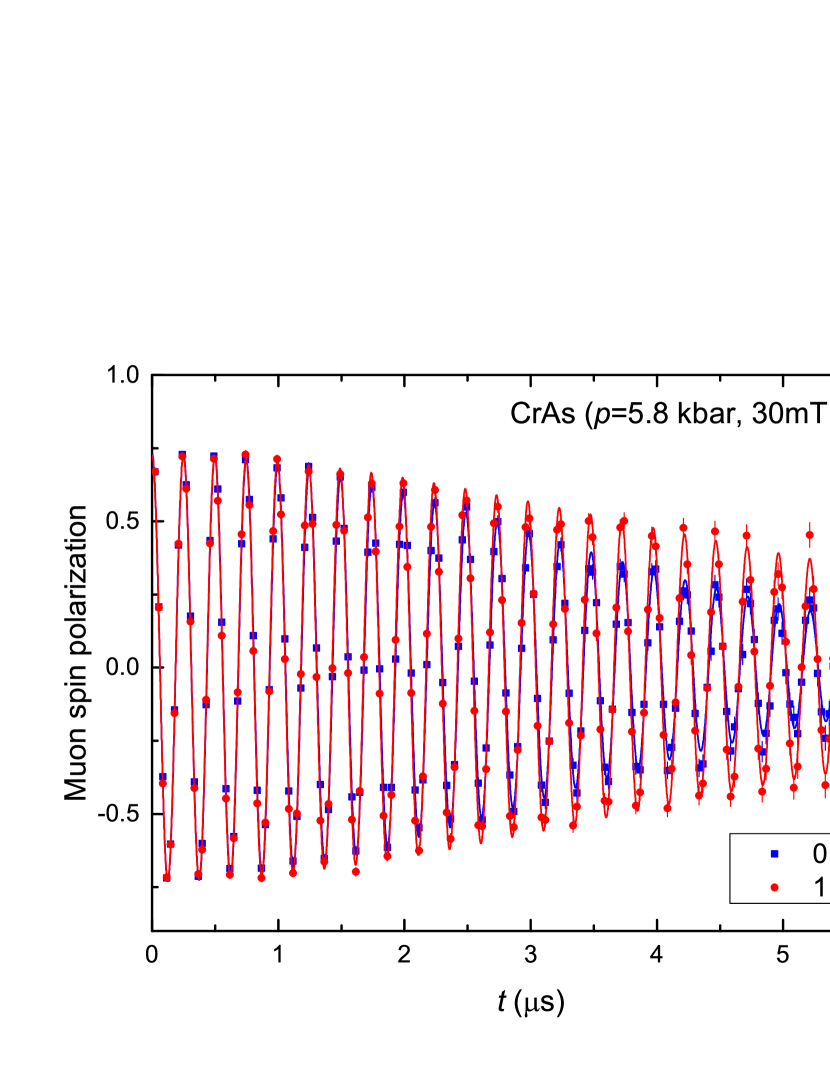
The TF SR data were analyzed by using the following functional form:
| (S5) | |||||
Here , , , and have similar meanings as in Eq. (S4), is the relaxation rate caused by FLL formation, and is the magnetic field inside the sample. Due to the diamagnetism of the superconducting state for and for .
References
- S (1) Keller, L. et al. Pressure dependence of the magnetic order in CrAs: A neutron diffraction investigation. Phys. Rev. B 91, 020409(R) (2015).
- S (2) Andreica, D. Magnetic phase diagram in some Kondo-lattice compounds. Ph.D. thesis, ETH-Zurich (2001).
- S (3) Schenck, A., Andreica, D., Gygax, F.N. & Ott, H.R. Extreme quantum behavior of positive muons in CeAl2 below 1 K. Phys. Rev. B 65, 024444 (2001).
- S (4) Yaouanc, A. & Dalmas de Réotier, P. Muon Spin Rotation, Relaxation and Resonance: Applications to Condensed Matter (Oxford University Press, Oxford, 2011).
- S (5) http://jick.net/ jess/ppt/GardenExport/node9.html.