Cross-Correlations Between European Government Bonds And EuroStoxx Assets
Abstract
We use principle component analysis (PCA) of cross correlations in European government bonds and European stocks to investigate the systemic risk contained in the European economy. We tackle the task to visualize the evolution of risk, introducing the conditional average rolling sum (CARS). Using this tool we see that the risk of government bonds and stocks had an independent movement. But in the course of the European sovereign debt crisis the coupling between bonds and stocks has strongly increased. This results in an in-phase oscillation of risk for both markets since mid 2010. In our data, we observe a steep amplitude increase, suggesting a high vulnerability of the two coupled systems.
1 Introduction
The inability of some European states to refinance their sovereign debts and the outbreak of the financial crisis in 2008 led in 2010 to the still ongoing European sovereign debt crisis. To stabilize the markets and give incentives to invest in Europe, the European Union implemented the European Financial Stability Facility (EFSF) and later the European Stability Mechanism (ESM). Heavily indebted European nations can use these tools to refinance their government debt.[1] The utilization of this bailout support has to be accompanied by fiscal consolidation, reforms and privatization of public goods.[2]
Previous studies have shown, that principle component analysis (PCA) of cross-correlations in financial datasets is a wide field of study with many applications.[3, 4, 5, 6, 7, 8, 9, 10, 11, 12]
More recent studies have shown that PCA is a viable tool to analyze the systemic risk, which measures the probability of events leading to widespread loss of confidence in the financial system [13, 14, 15, 8, 16]. Zheng et al. have used the first eigenvalues of the cross-correlation matrix between different stock-indices and stocks to reveal the rise in systemic risk, which lead to the financial crisis in 2007.
These studies show the importance of cross-correlation analysis for identifying the risk, but they lack a statement about the evolution of the systemic risk. For this purpose we introduce the conditional average rolling sum (CARS) of the eigenvalue time deviation, which allows us to track the systemic risk. We apply this technique to a set of European government bonds and stocks listed in the EuroStoxx to examine the European sovereign debt crisis and show that since the beginning of the European dept crisis in 2010 these two markets are strongly correlated and both show the same oscillating risk progression.
2 Method
Detecting an increase of similar market reactions can be measured by utilizing the correlation matrix , which contains the empirical correlation between two assets and in a given time window .
We study two different sets of time dependent assets: The mean monthly returns of all stocks contained in the EuroStoxx50 and the change of the monthly yield return of the European 10 year bonds. We use logarithmic returns
| (1) |
with the governmet bond data found on [17] only allowed monthly values.
The correlation elements are
| (2) |
where is the standard deviation of the returns of asset . Since the matrix is symmetric it is possible to use principle component analysis(PCA). The eigenvalues are called principal components of the orthogonal space, where the time-series are uncorrelated. We track
| (3) |
where is a chosen time window. In financial correlation matrices the first eigenvalue dominates, which shows that most of the information is contained in the largest eigenvalue and its eigenvector. Smaller eigenvalues are typically in the random regime and carry less information of the system, but are not pure noise.([10, 11])
In the paper by Zheng et. al [13], they observed that a steep increase in is connected to the systemic risk in a set of assets. Peaks in the time derivation correspond to these events. An increasing risk can result in a crash. Thus we consider a build up process which improves the quality of identifying overall market moves. We take the conditional rolling sum of events
| (4) |
which has a memory effect by default where
| (5) |
takes the four largest eigenvalues into account in oder to project most of the information.
3 Results and Discussion
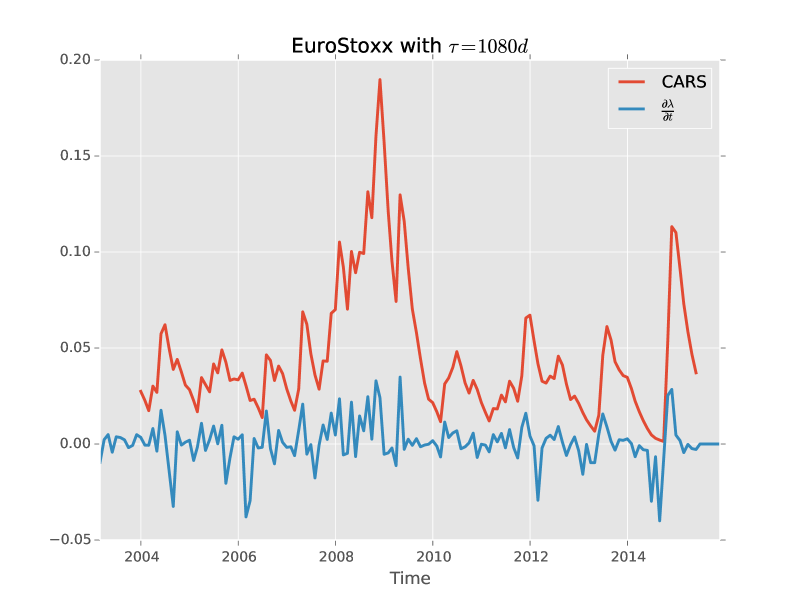
Applying PCA and the conditional average rolling sum (CARS) with a time window of 36 months on the EuroStoxx data (bottom right panel of figure 1), we see a peak in November 2008. One can observe, that this peak is the consequence of many events in the derivation between 2007 and 2009, and thus connected with the financial crisis. Furthermore we see two minor peaks in November 2011 and August 2013, which are associated with the European sovereign debt crisis.
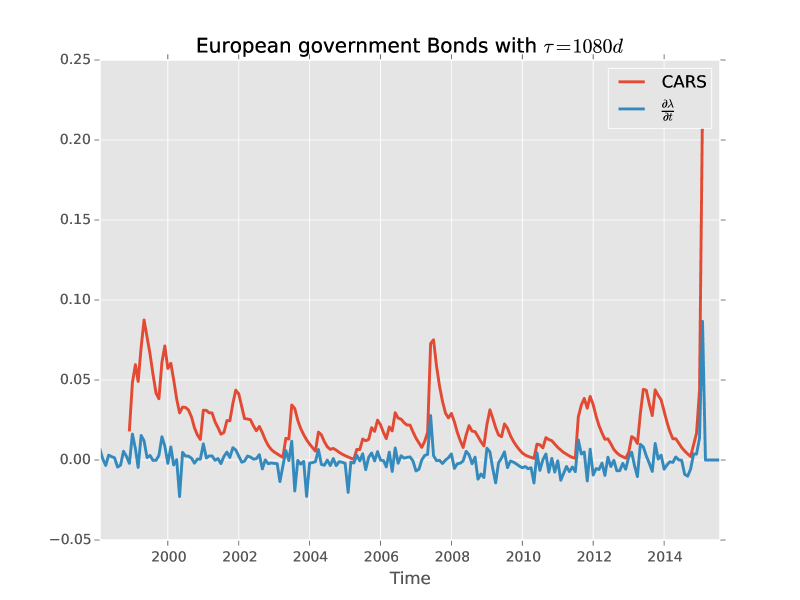
Performing the same analysis for European long term government bonds, we see a very similar pattern in the bottom left panel of figure 1: A high peak in July 2007, which is at the beginning of the build-up process for the broad peak in the EuroStoxx. This peak is followed by smaller ones in December 2011 and August 2013. These dates correspond well with the analysis of the stocks cross-correlations and show a strong connection in the risk of European stocks and European government bonds.
|
|
|
|
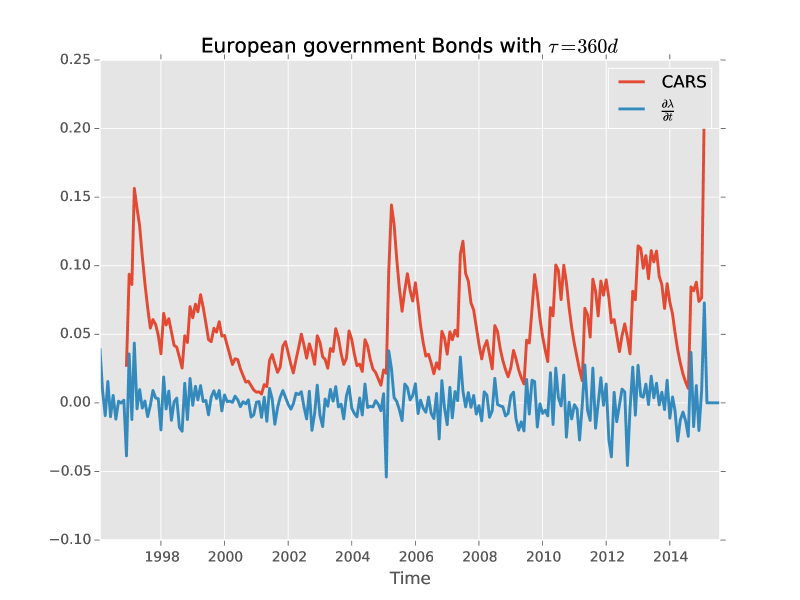
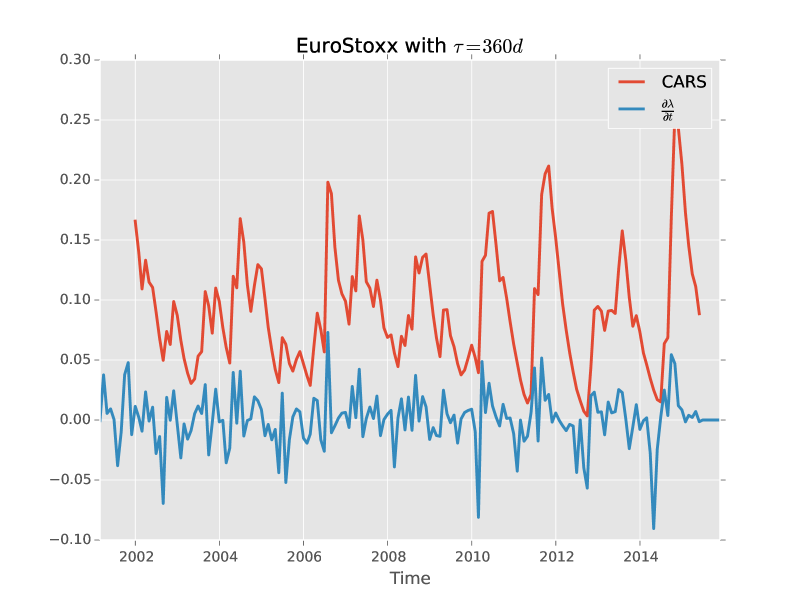
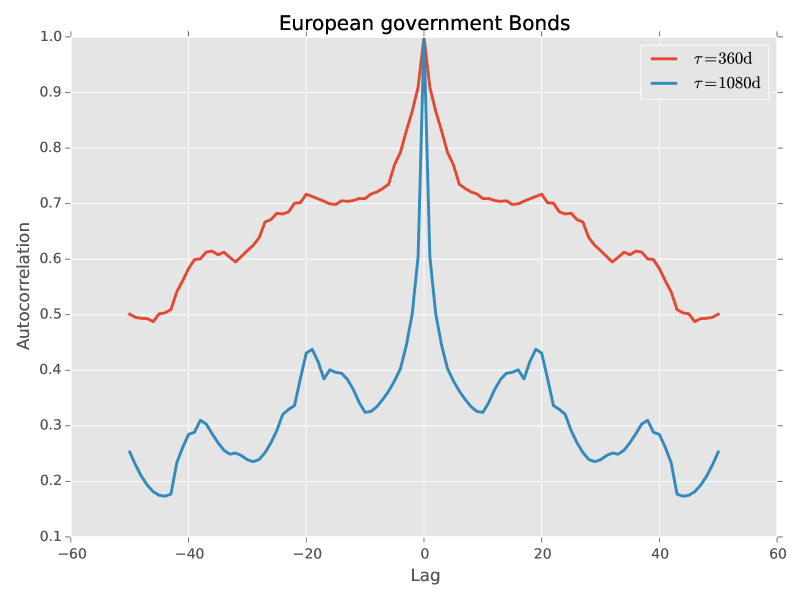
At the end of 2015 we detect for both graphs a distinct increase in the first eigenvalues of the cross-correlation matrix. Especially for the government bonds this increase reaches unobserved high values. The top panels of figure 1 show the CARS of the European government bonds (left) and EuroStoxx assets (right) for time-window . Choosing this time-window results in a fluctuating pattern, which is not as suitable for indicating big market changes as the but it clearly features the capability of discovering oscillation patterns in the CARS. We can find these oscillations in all four cases, indicating that the risk in these markets oscillates on a time frame of several months. While these two oscillations have been out of phase before, they are in phase since 2010. In figure 2 we show the periodic property by plotting the the autocorrelation function for both datasets.
|

|
|
|
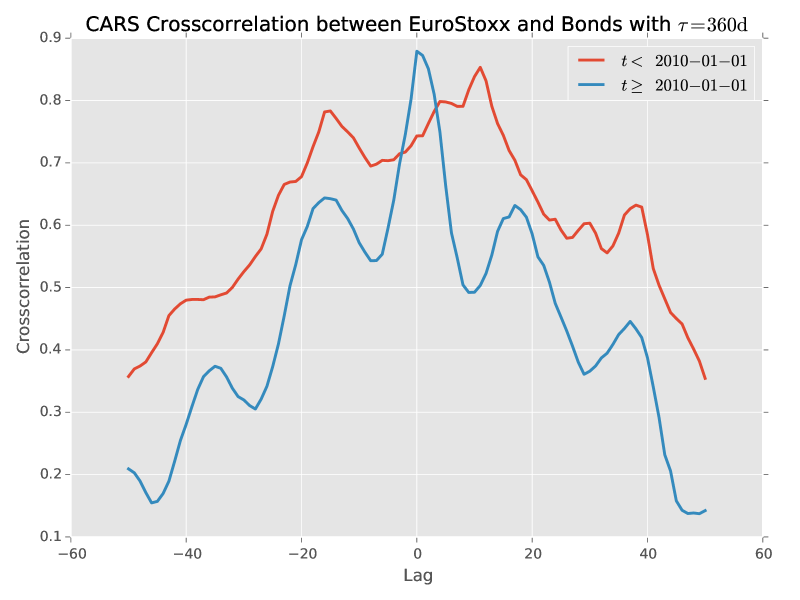
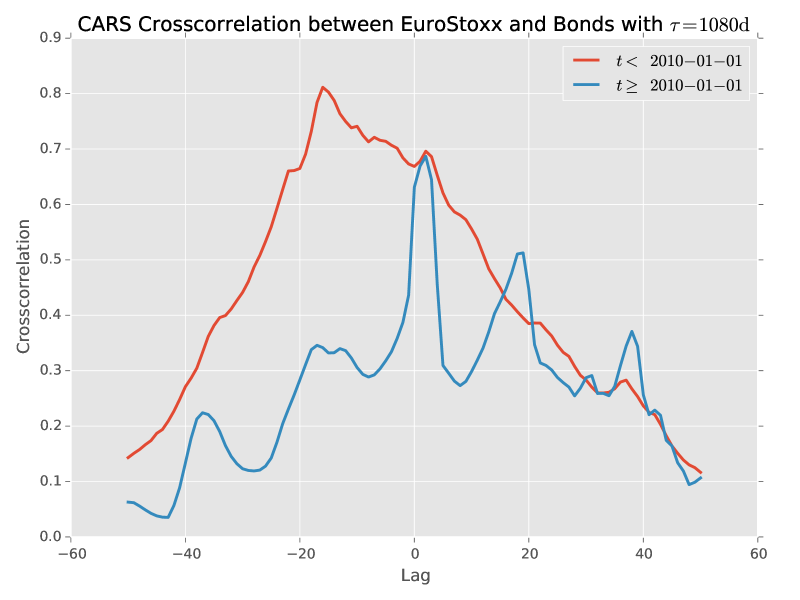
We emphasize this fact in figure 3, which shows the correlations between the two CARS before and after 2010.
Before 2010 we find that the maximum correlation has a non zero lag, indicating only weak interactions between these two markets. Looking at the cross-correlation after 2010, we measure a zero time lag for the maximum correlation in the case of and an oscillation . This fact suggests that these two market are strongly coupled since 2010.
4 Conclusion
In this article we have shown, that conditional average rolling sum of events is a suitable tool for the visualization of risks. The in-build memory ensures that past events are taken into account in order to track time-dependent processes. A clear connection between a high CARS value and an high systemic risk has been established.
Furthermore we observed an oscillation in the stock and government bonds markets. Originally these oscillations in those two markets were not coupled until 2010. From this point on we observe a zero or one month time-lag in the cross-correlations between them.
In November 2014 an unprecedented surge in the conditional average rolling sum occurred. It seems that the sharp risk increase manifested in the so called “Schnitzel-Crisis” in May 2015.
References
- ESM [2012] ESM. ESM Annual Report 2012. Online, 2012.
- News [2011] Bloomberg News. European Crisis Timeline From Maastricht to Papandreou Exit , November 2011. Details on the timeline can be found here: http://www.bloomberg.com/news/articles/2011-11-07/europe-timeline-maastricht-to-papandreou.
- Laloux et al. [1999] Laurent Laloux, Pierre Cizeau, Jean-Philippe Bouchaud, and Marc Potters. Noise dressing of financial correlation matrices. Physical review letters, 83(7):1467, 1999.
- Gopikrishnan et al. [2001] Parameswaran Gopikrishnan, Bernd Rosenow, Vasiliki Plerou, and H Eugene Stanley. Quantifying and interpreting collective behavior in financial markets. Physical Review E, 64(3):035106, 2001.
- Plerou et al. [2002] Vasiliki Plerou, Parameswaran Gopikrishnan, Bernd Rosenow, Luis A Nunes Amaral, Thomas Guhr, and H Eugene Stanley. Random matrix approach to cross correlations in financial data. Physical Review E, 65(6):066126, 2002.
- Utsugi et al. [2004] Akihiko Utsugi, Kazusumi Ino, and Masaki Oshikawa. Random matrix theory analysis of cross correlations in financial markets. Physical Review E, 70(2):026110, 2004.
- Pan and Sinha [2007] Raj Kumar Pan and Sitabhra Sinha. Collective behavior of stock price movements in an emerging market. Physical Review E, 76(4):046116, 2007.
- Podobnik et al. [2010] Boris Podobnik, Duan Wang, Davor Horvatic, Ivo Grosse, and H Eugene Stanley. Time-lag cross-correlations in collective phenomena. EPL (Europhysics Letters), 90(6):68001, 2010.
- Jiang and Zheng [2012] XF Jiang and B Zheng. Anti-correlation and subsector structure in financial systems. EPL (Europhysics Letters), 97(4):48006, 2012.
- Wang et al. [2013] Gang-Jin Wang, Chi Xie, Shou Chen, Jiao-Jiao Yang, and Ming-Yan Yang. Random matrix theory analysis of cross-correlations in the US stock market: Evidence from Pearson’s correlation coefficient and detrended cross-correlation coefficient. Physica A: Statistical Mechanics and its Applications, 392(17):3715–3730, 2013.
- Kwapień et al. [2006] J Kwapień, S Drożdż, P Oświe, et al. The bulk of the stock market correlation matrix is not pure noise. Physica A: Statistical Mechanics and its Applications, 359:589–606, 2006.
- Wilcox and Gebbie [2004] Diane Wilcox and Tim Gebbie. On the analysis of cross-correlations in South African market data. Physica A: Statistical Mechanics and its Applications, 344(1):294–298, 2004.
- Zheng et al. [2012] Zeyu Zheng, Boris Podobnik, Ling Feng, and Baowen Li. Changes in cross-correlations as an indicator for systemic risk. Scientific reports, 2, 2012.
- Billio et al. [2012] Monica Billio, Mila Getmansky, Andrew W Lo, and Loriana Pelizzon. Econometric measures of connectedness and systemic risk in the finance and insurance sectors. Journal of Financial Economics, 104(3):535–559, 2012.
- Kritzman et al. [2010] Mark Kritzman, Yuanzhen Li, Sebastien Page, and Roberto Rigobon. Principal components as a measure of systemic risk. 2010.
- Wang et al. [2011] Duan Wang, Boris Podobnik, Davor Horvatić, and H Eugene Stanley. Quantifying and modeling long-range cross correlations in multiple time series with applications to world stock indices. Physical Review E, 83(4):046121, 2011.
- OECD [2015] OECD. Main Economic Indicators - complete database. February 2015. doi: 10.1787/data-00052-en.