Extending Virial Black Hole Mass Estimates to Low-Luminosity or Obscured AGN: the cases of NGC 4395 and MCG -01-24-012
Abstract
In the last decade, using single epoch (SE) virial based spectroscopic optical observations, it has been possible to measure the black hole (BH) mass on large type 1 Active Galactic Nuclei (AGN) samples. However this kind of measurements can not be applied on those obscured type 2 and/or low luminosity AGN where the nuclear component does not dominate in the optical. We have derived new SE relationships, based on the FWHM and luminosity of the broad line region component of the Pa emission line and/or the hard X-ray luminosity in the 14-195 keV band, which have the prospect of better working with low luminosity or obscured AGN. The SE relationships have been calibrated in the mass range, using a sample of AGN whose BH masses have been previously measured using reverberation mapping techniques. Our tightest relationship between the reverberation-based BH mass and the SE virial product has an intrinsic spread of 0.20 dex.
Thanks to these SE relations, in agreement with previous estimates, we have measured a BH mass of MBH= M⊙ for the low luminosity, type 1, AGN NGC 4395 (one of the smallest active galactic BH known). We also measured, for the first time, a BH mass of MBH= M⊙ for the Seyfert 2 galaxy MCG -01-24-012.
keywords:
galaxies: active – galaxies: nuclei – infrared: galaxies – galaxies: individual (NGC 4395) – galaxies: individual (MCG -01-24-012)1 Introduction
Nowadays there is robust evidence that almost every galaxy host a super massive black hole (BH; MBH=105-109 M⊙) and that many correlations exist between the BH mass and some of the host galaxy properties (e.g. bulge mass, luminosity and stellar dispersion; Ferrarese & Merritt, 2000; Gebhardt et al., 2000; Marconi & Hunt, 2003; Sani et al., 2011). Then, it has been argued that the existence of these scaling relationships implies that the evolution of galaxies and the growth of the super massive BHs (SMBH) are tied together (the AGN/galaxy co-evolution scenario).
In the last decade, using virial based techniques in the optical band, it has been possible to measure the BH mass on large type 1 AGN (AGN1) samples and therefore derive the super massive BH mass function (Greene & Ho, 2007a; Kelly et al., 2009; Kelly et al., 2010; Merloni et al., 2010; Bongiorno et al., 2014). Many of these measures are based on the Single Epoch (SE) BH mass estimates. By combining the velocity of the Broad Line Region (BLR) clouds (assuming Keplerian orbits) along with their distance R it is possible to determine the total mass contained within the BLR (which is dominated by the BH) in a simple way using
| (1) |
where G is the gravitational constant and f is a factor that depends on the geometric and kinematic structure of the BLR (e.g., Kaspi et al. 2000). These techniques derive the AGN BH mass using SE spectra to measure V from the FWHM of some of the BLR lines (typically: H or MgII 2798 or CIV 1459) and R from either the continuum or the line luminosities, L, which have been proved to be proportional to R2 (i.e. ; Bentz et al., 2006). Therefore, the SE estimates are based on relations of the type
| (2) |
where , (e.g. Wandel et al., 1999; Vestergaard, 2002, 2004; Vestergaard & Osmer, 2009; McLure & Jarvis, 2002, but see also Dietrich & Hamann 2004). These relationships have typical spreads of 0.5 dex.
However these measurements can not be applied on those obscured or partially obscured sources where the AGN component does not dominate in the optical: type 2 AGN (AGN2), intermediate class AGN (AGN1.8 and AGN1.9) or even AGN1 having low luminosities and low mass BH (MBH106 M⊙). Indeed, in these cases, in the (rest frame) optical band, either the broad line component is not visible or, in any case, the AGN continuum and line luminosities are affected by severe obscuration and galaxy contamination thus preventing a reliable estimate of the BH mass.
There are, in summary, indications that the SE techniques do not allow to obtain an un-biased estimate of the density of the low-luminosity (and, therefore, low-mass; MBH107 M⊙) class of AGN. Such a bias could have strong implications on our understanding on the AGN/galaxy evolution.
Indeed, the density of low mass BHs in the local universe provide unique tests for studies of BH formation and growth, galaxy formation and evolution. In current models of galaxy evolution in a hierarchical cosmology, SMBHs must have been built up from accretion onto much smaller seeds, in conjuction with merging with other BHs. These models also predict that smaller scale structures form at later times (cosmic downsizing), and one might expect that seeds BHs in these smaller systems may not have had enough time to be fully grown. This means that low-mass BHs likely contain clues about the formation of the first black holes, therefore the mass function of the present day low-mass black holes and their host galaxies properties can be used to discriminate between different models for seeds BHs and help shed light on the coevolution of BHs and galaxies (see Dong & De Robertis, 2006; Greene & Ho, 2007b; Dong et al., 2012; Greene, 2012).
In the last few years Landt et al. (2008, 2011, 2013) have studied quasi-simultaneous near-IR (NIR) and optical spectra of a sample of well-known broad-emission line AGN, whose BH masses were already determined. These studies have allowed the calibration of a NIR relationship for estimating AGN BH masses based on the widths of the Paschen hydrogen broad emission lines and the total 1 m continuum luminosity (Landt et al., 2011, 2013). However the virial relationship developed in Landt et al. (2011, 2013) makes use of the 1 m continuum luminosity, which has to be derived by a Spectral Energy Distribution (SED) fitting method and can suffer from galaxy contamination especially for intrinsic low-luminosity AGNs.
Following previous studies in which either a correlation between the BLR radius and the absorption corrected X-ray luminosity was found (Greene et al., 2010, see also Maiolino et al. (2007)), or the luminosity of the BLR emission lines can be used as a proxy of the BLR radius (Greene & Ho, 2005), we have decided to calibrate new virial relationships based on the broad emission line FWHM combined with either the hard X-ray or the broad emission line luminosities (see also Kim et al., 2010, for similar SE methods based on the Pa and Pa emission-line luminosities). Such relations are potentially able to be applied on both the low-luminosity and the optically more obscured AGN. The method has been successfully tested on one of the lowest BH mass Seyfert 1 known, NGC 4395, and on a Seyfert 2 galaxy, MCG -01-24-012; both spectroscopically observed in the NIR in the framework of a large programme aimed at measuring the BH mass of low-luminosity or type 2 AGN (Onori et al., in preparation), included in the 22 month Swift/Burst Alert Telescope (BAT) catalogue (Tueller et al., 2010).
Unless otherwise stated, all quoted errors are at the 68% (1 ) confidence level. We assume , and .
2 NGC 4395 and MCG -01-24-012 and their previous BH mass measures
2.1 NGC 4395
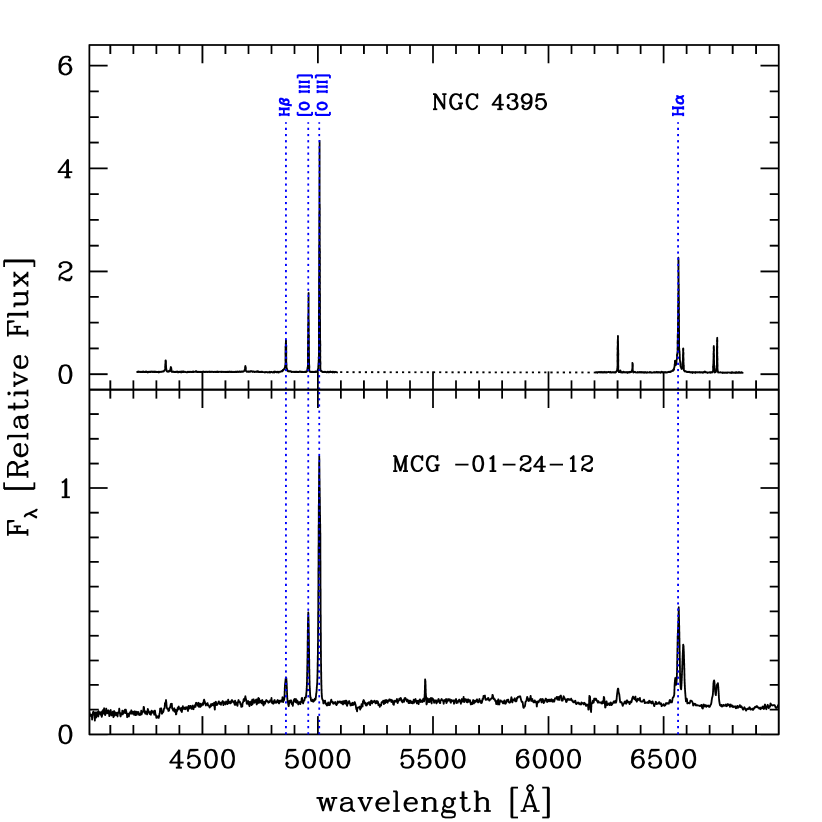
NGC 4395 (= 12h 52m 48.8s, = 33∘ 32m 49s; J2000) is a small bulgeless (Sd) galaxy hosting one of the smallest, low luminosity, active super massive BH ( ) ever found111One other small active BH, of similar size, is that of POX 52: an AGN1 in a dwarf elliptical galaxy, whose BH mass, according to the extrapolation of the MBH- relation (Tremaine et al., 2002) and to the SE, H based, relationship is expected to have (Kunth et al., 1987; Barth et al., 2004; Barth et al., 2005). . Its 14-195 keV X-ray luminosity is (Baumgartner et al., 2013). The optical spectrum (Figure 1) reveals very strong narrow emission lines showing weak broad wings in the H and H emission lines. Based on the relative intensities of the narrow and broad components, Filippenko & Sargent (1989) originally classified the nucleus of NGC 4395 as a type 1.8 or type 1.9 Seyfert. Later, using HST spectroscopy, the nucleus of NGC 4395 has been classified as a type 1 Seyfert (Filippenko et al., 1993). According to Ho et al. (1997), the BLR component of the H line has a FWHM=442 km s-1.
Different methods have been employed in the last years to derive the central BH mass of NGC 4395. From photoionization modeling of the narrow-line region and BLR, Kraemer et al. (1999) found that the broad H line originates from a region with radius pc. Assuming that the line emitting gas is gravitationally bound, and using the measure of the width of the H BLR component, FWHM = 1500 km s-1 (Kraemer et al., 1999), they found M⊙. A result similar to Peterson et al. (2005), who obtained M⊙, through reverberation mapping of the CIV line. This last estimate has been halved to M⊙ due to the updated virial f-factor () in Graham et al. (2011). The last up to date broadband photometric reverberation, made by Edri et al. (2012) using the H line, has found an even lower mass of M⊙; this is essentially only due to the much smaller geometrical -factor used (f = 0.75 instead of f = 5.5 used by Peterson et al. 2005). Indeed, if a common geometrical factor is used (see next section), all the above measures agree to a BH mass of M⊙. The lack in this galaxy of a significant bulge and the stringent upper limit of on its velocity dispersion confirm a value of the order of M⊙ on its BH mass (Filippenko & Ho, 2003).
As the H line shows a FWHM=442 km s-1 and a luminosity of 1038.08 erg s-1 (Ho et al., 1997), in principle, a SE relationship, based on the two above quantities could be used to derive the BH mass. We used eq. A1 in Greene & Ho (2007a), but converted to a geometrical virial factor . In this case it results a mass of M⊙, which is smaller than previously measured. This lower value could be caused by extinction and dilution effects from the hosting galaxy, which are more relevant in small mass and low luminosity AGNs, such as NGC 4395. Nonetheless, the observed extinction is not able to correct the H luminosity in order to obtain a BH mass in agreement with the previous described measures. In fact, from the He II 1640/4686 ratio a reddening of mag is found (Kraemer et al., 1999), while from to the observed Balmer decrement of the narrow line component (see Table 1 in Kraemer et al., 1999), a reddening mag is measured. Assuming a Galactic extinction law (RV=3.1), these values correspond to an extinction of 0.09 and 0.14 mag, respectively, at the H wavelength. In this case, once the H luminosity has been corrected for this small extinction, a BH mass of M⊙ is obtained. This low value could be due to an under-estimate of the extinction, which in the inner regions of the galaxy, could be larger than measured from the narrow line region. These results support our project of deriving new BH mass virial relationships based on NIR and/or hard X-ray luminosity measures which have the prospect of being less affected by extinction and host galaxy contaminations.
2.2 MCG -01-24-012
MCG -01-24-012 (= 9h 20m 46.2s, = -8∘ 3m 22s; J2000) is a nearby spiral galaxy, at redshift z=0.0196, which hosts a Seyfert 2 nucleus (de Grijp et al., 1992). Using BeppoSAX/PDS telescope observations it was identified by Malizia et al. (2002) as the counterpart of the X-ray source H0917-074, detected by HEAO1/A2 (Piccinotti et al., 1982). The 2-10 keV flux, measured by BeppoSAX, is erg s-1 cm-2, while the X-ray spectrum shows the presence of iron K emission lines, together with an absorption feature at keV which cannot be explained by the presence of warm material around the source. It turned out to be Compton-thin, having N cm-2. Its 14-195 keV luminosity is (Baumgartner et al., 2013) and the [O III] image shows an extended (1.15′′2.3′′; 460 pc 910 pc) emission, with the major axis along PA=75 deg, interpreted as an extended NLR (Schmitt et al., 2003). MCG -01-24-12 has also been observed by Spitzer/IRS. The corresponding low resolution staring-mode spectrum exhibits deep silicate absorption at 10 m and weak PAH emission (Mullaney et al., 2011).
Using K-band stellar luminosity of the bulge, Winter et al. (2009) derived a black hole mass log(MBH/M⊙) = 7.16. The optical spectrum (Figure 1), obtained by the 6dF Galaxy Survey (Jones et al., 2009), shows narrow H an H emission lines (but see also discussion in sect. 7 about a possible presence of a faint broad H component).
3 Single Epoch Mass relations in the Near-Infrared
3.1 Calibration sample
As previously discussed, we are interested in deriving new BH mass virial relationships based on the measure of the width of the BLR component in the Pa emission line. In order not to suffer from problems related to the galaxy contamination, we have tried to substitute the 1 m continuum luminosity used by Landt et al. (2013) as the BLR size indicator, with either the hard X-ray 14-195 keV band luminosity, , such as measured by the 70 months Swift/BAT survey by integrating within the years 2005 and 2010 (Baumgartner et al., 2013), or the luminosity of the Pa, LPaβ, itself (see Kim et al. (2010), for a similar study based on the Pa and Pa emission-line luminosities).
The calibration sample contains those 20 AGN1 whose broad Pa line fits have been published by Landt et al. (2008, 2013) and whose BH mass have been measured by the reverberation mapping techniques. When available, we have used the BH mass values listed in Grier et al. (2013) where the new estimate of the geometrical -factor was adopted. All the remaining BH masses, which were originally published using , have then been converted to . All but one the sources are listed in the 70 months Swift/BAT catalogue (Baumgartner et al., 2013) from which the 14-195 keV hard X-ray luminosities have been taken. In Table 1 we present the main characteristics of our calibration sample, such as: redshift, optical spectroscopic classification, BH mass and the relative reference, 14-195 keV hard X-ray luminosity and the FWHM of the broad component of the Pa. The FWHMs have been corrected for instrumental resolution using the values reported in Landt et al. (2008, 2013). In particular the source 3C 120 has been observed with an average spectral resolution of FWHM , while Mrk 279, NGC 3516, NGC 4051 and PG 0844+349 spectra have a resolution of FWHM (Landt et al., 2013). The instrumental resolution for the remainder of the sources is FWHM (Landt et al., 2008).
| Object Name | z | class | ref | ||||
|---|---|---|---|---|---|---|---|
| [] | [] | [] | [] | ||||
| (1) | (2) | (3) | (4) | (5) | (6) | (7) | (8) |
| 3C 120 | 0.0330 | S1.0 | 5.260.52 | G13 | 44.380.01 | 2727 | … |
| 3C 273 | 0.1583 | S1.0 | 6.941.47 | P04 | 46.480.03 | 2895 | 43.64 |
| Ark 120 | 0.0323 | S1.0 | G13 | 44.230.02 | 5102 | 42.12 | |
| Mrk 79 | 0.0222 | S1.2 | G13 | 43.720.02 | 3506 | 41.28 | |
| Mrk 110 | 0.0353 | S1n | G13 | 44.220.02 | 1886 | 41.60 | |
| Mrk 279 | 0.0304 | S1.0 | 3.100.47 | G13 | 43.920.02 | 3546 | … |
| Mrk 290 | 0.0296 | S1.5 | 1.900.29 | D10 | 43.670.04 | 4228 | 41.46 |
| Mrk 335 | 0.0258 | S1n | 1.110.29 | P04 | 43.450.05 | 1825 | 41.37 |
| Mrk 509 | 0.0344 | S1.5 | 9.570.43 | G13 | 44.420.01 | 3057 | 42.12 |
| Mrk 590 | 0.0264 | S1.0 | G13 | 43.420.07 | 3949 | 40.33 | |
| Mrk 817 | 0.0314 | S1.5 | G13 | 43.770.03 | 5519 | 41.47 | |
| Mrk 876 | 0.1290 | S1.0 | 2.191.01 | P04 | 44.730.07 | 6010 | 42.50 |
| NGC 3227 | 0.0039 | S1.5 | G13 | 42.560.01 | 2934 | 40.03 | |
| NGC 3516 | 0.0088 | S1.5 | G13 | 43.310.01 | 4451 | … | |
| NGC 4051 | 0.0023 | S1.0 | G13 | 41.670.02 | 1633 | … | |
| NGC 4151 | 0.0033 | S1.5 | G13 | 43.120.01 | 4654 | 40.43 | |
| NGC 4593 | 0.0090 | S1.0 | G13 | 43.200.01 | 3775 | 40.68 | |
| NGC 5548 | 0.0172 | S1.5 | 5.95 | G13 | 43.720.01 | 6516 | 41.37 |
| NGC 7469 | 0.0163 | S1.5 | 2.700.60 | G13 | 43.600.02 | 1758 | 40.98 |
| PG 0844+349 | 0.0640 | S1.0 | 7.242.99 | P04 | … | 2377 | 41.99 |
Notes: (1) AGN names; (2) redshift from Baumgartner et al. (2013); (3) source classification from Landt et al. (2008) or NED (where S1.0 = Seyfert 1, S1.2-S1.5 = intermediate Seyfert 1, S1n = narrow-line Seyfert 1); (4) BH mass (in solar masses) from reverberation mapping campaigns; (5) reference for the BH mass, where D10: Denney et al. (2010) but adopting , G11: Graham et al. (2011), G13: Grier et al. (2013), P04: Peterson et al. (2004) but adopting ; (6) logarithm of the 14-195 keV intrinsic luminosity (from Baumgartner et al., 2013); (7) FWHM of the broad emission line component of (corrected for instrumental resolution) from Landt et al. (2008, 2013). A 10% uncertainty has been assumed (see text); (8) logarithm of the luminosity of the Pa BLR component from Landt et al. (2008, 2013). A 10% uncertainty has been assumed (see text).
3.2 Fit of the virial relationship using LX
We have performed a linear fit of the form
| (3) |
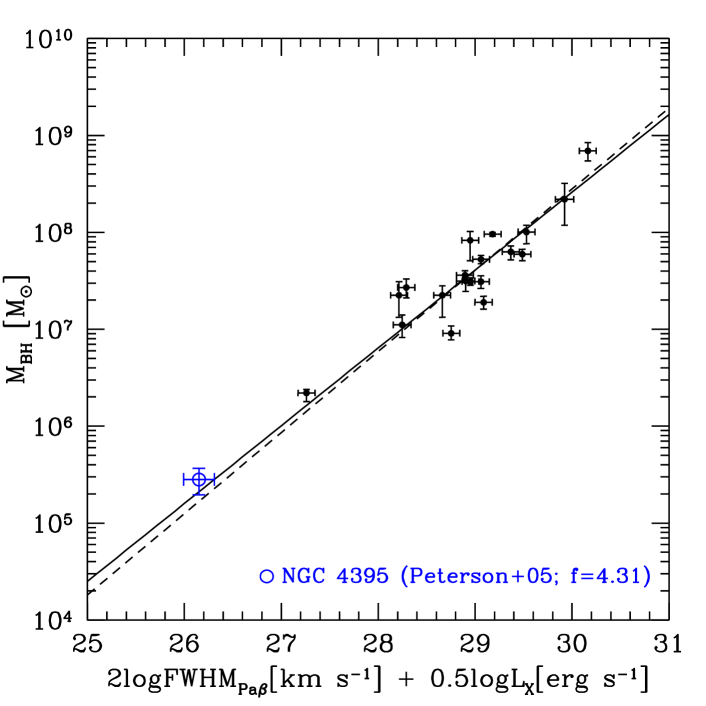
where is the BH mass, is the measure of the width of the broad component of the emission line, corrected for instrumental broadening, and is the 14-195 keV intrinsic luminosity. The fit was carried out on a sample of 19 AGN as one galaxy misses the LX measurement (see Table 1). We have solved the least-squares problem using the fitting routine FITEXY (Press et al., 2007) that can incorporate errors on both variables and allows us to account for intrinsic scatter. The uncertainties on are listed in Table 1, while the errors on the virial product (the x-axis) depend on the uncertainties on the measures of FWHM and . We have calculated the uncertainties on the hard X-ray luminosity rescaling the 90% confidence level of the flux in the 14-195 keV band presented in the 70 month Swift/BAT catalogue (Baumgartner et al., 2013) to the 68% confidence level. As far as the FWHM measures are concerned, although in some cases the uncertainties are reported in literature, following the studies of Grupe et al. (2004); Vestergaard & Peterson (2006); Landt et al. (2008); Denney et al. (2009), we have preferred to assume a common uncertainty of 10%. The best fit provided a slope and a y-intercept (see dashed line in Figure 2). If uncertainties on the FWHM measurements of either 5% or 20% are instead assumed, slopes (where ) and (where ) are obtained, respectively. In the range , these two solutions correspond to differences on MBH of dex, if compared to our best fit relation. The data have a correlation coefficient , which corresponds to a probability as low as that they are randomly extracted from an uncorrelated parent population. The resulting observed spread is 0.24 dex, while the intrinsic spread (i.e. once the contribution from the data uncertainties has been subtracted in quadrature) results to be 0.21 dex. Following Graham & Scott (2013), we have also used the Tremaine et al.’s (2002) modified version of the routine FITEXY which minimizes the quantity
| (4) |
where the intrinsic scatter (in the y-direction) is denoted by the term , and the measurement errors on the N pairs of observables and , (i.e. the virial product and the BH masses, respectively) are denoted by and . It results, indeed, that the intrinsic scatter of 0.21 dex makes the reduced () from equation 4 (where are the degrees of freedom) equal to 1.
We also investigated whether a relationship where MBH depends on LaV2 (e.g. Vestergaard & Peterson, 2006) better fits the data. We obtained , which is similar to the previous fit where the exponent of the dependence on L is 0.42 (0.8370.5), however the observed spread, 0.28 dex, resulted to be larger than in the previous fit (0.24 dex) and therefore we preferred to use the dependence as shown in eq. 3. The explanation of this difference resides on the fact that eq. 3 is able to model with a single parameter () the dependence on both the luminosity and the FWHM of the BLR.
As the AGN are known to vary both in the optical and X-ray bands (e.g. Cristiani et al., 1997; Papadakis, 2004; Kelly et al., 2011), the scatter of the relation should also be affected by the non-simultaneous nature of the X-ray and NIR observations. While the NIR spectra have been taken within the years 2004 and 2011 (Landt et al., 2008, 2013), the 14-195 keV X-ray luminosities are the result of the average flux within the years 2005 and 2010 (Baumgartner et al., 2013). We therefore expect that similar dedicated projects aimed at observing simultaneously the AGN NIR spectra and their hard X-ray luminosity have the prospect to obtain even more accurate relationships to derive the AGN BH mass.
3.3 Fit of the virial relationship using LPaβ

In order to look for a virial relationship able to measure the BH masses using only NIR spectroscopic data, we have substituted LX with LPaβ and then, in analogy with the previous section, have performed a linear fit of the form
| (5) |
In this case the fit was carried out on a sample of 16 AGN as four galaxies miss the LPaβ measurement (see Table 1). As discussed in the previous section, an uncertainty of 10% on LPaβ was used. The best fit provided a slope and a y-intercept (see dashed line in Figure 3). The data have a correlation coefficient , which has a probability as low as that the data are randomly extracted from an uncorrelated parent population. The resulting observed spread is 0.31 dex, while the intrinsic spread results to be 0.28 dex. Although this relationship has an intrinsic scatter larger than measured in the previous relation using LX, as already discussed, it has the big advantage that it just needs NIR spectroscopy of the Pa emission line (without using X-ray observations) to derive the AGN BH mass.
4 Observations and Line Fit Measurements
4.1 NGC 4395
We have observed NGC 4395 on December 5 2012, at the LBT with the LBT NIR Spettroscopy Utility with Camera and Integral-Field Unit for Extragalactic Research (LUCI) in the zJ band using the grating 200_H+K in combination with the zJspec filter. A 1′′ 2.8′ wide slit was used, corresponding to a spectral resolution. All the observations have been carried out by rotating the slit in order to observe also a bright star that was later used to correct for OH absorptions, which are known to vary across the night. We acquired 8 images with exposures of 350 s each, using the nodding technique A B B A. The night was clear, the seeing was 0.54′′ and the airmass was 1.2.
Flats and arcs were taken within one day from the observations. The data reduction steps included preparation of calibration and science frames, processing and extraction of spectra from science frames, wavelength calibration, telluric correction and flux-calibration. The wavelength calibration made use of the arcs and of a constant correction offset measured on the OH emission lines. The flux-calibration took into account the correction on the telluric flux fraction lost for the seeing. The atmospheric extinction correction has been taken into account automatically during the flux-calibration with the telluric standard star by using a not extincted stellar model. The spectrum was eventually corrected for Galactic extinction using an extinction value of 0.012 mag in the J band (NED). The spectrum of NGC 4395 was extracted with an aperture of 1.5′′, while the noise spectrum has been derived taking into account both the flux of the scientific object and of the OH airglow.
4.1.1 The Pa line fit
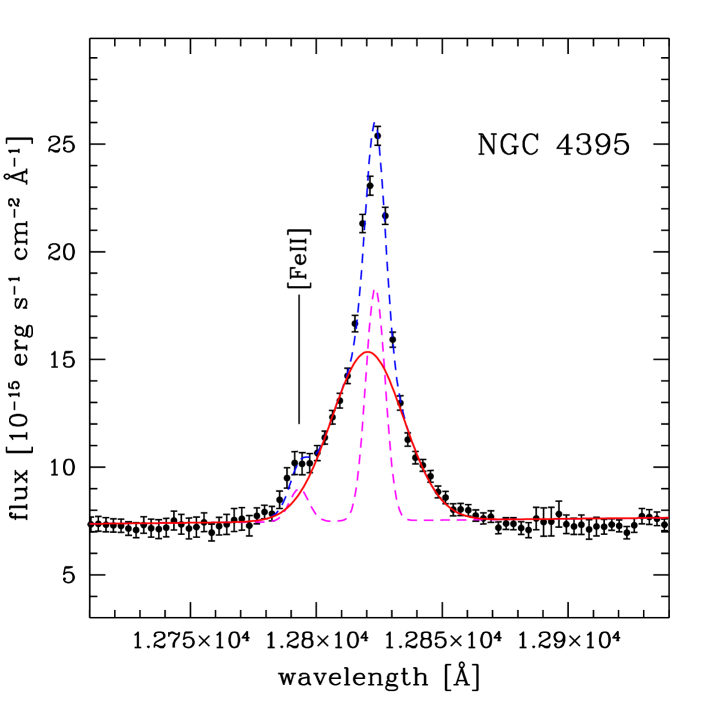
We tried to fit the Pa profile by de-blending a broad emission from the narrow one (see Figure 4). Although the redshift of NGC 4395 is quite low, the spectrum has been converted to the rest frame. The continuum has been estimated with a power law, while the contribution from the Narrow Line Region (NLR) has been fitted with a Gaussian model whose width has been fixed to that measured for the forbidden emission line [FeII] 12570 (FWHM = 211 km s-1). Then, following the NIR transitions listed in Landt et al. (2008) (see their Table 4), we have added a Gaussian to measure the contamination of the [FeII] 12791 which is in blending with the Pa. We have added two Gaussians for the Pa: one narrow (as the NLR), and one broad. The broad Pa components resulted to have a FWHM of 786 km s-1 and a luminosity of 1038.85±0.02 erg s-1. After correction for the instrumental broadening it results a FWHM of 755 km s-1. The fitting uncertainties are quite small (%), however, as discussed in section 3.2, in order to later derive the BH mass, we assumed that the uncertainties on both of these values are 10%.
We note that the broad component of the Pa is blueshifted with respect to the narrow one by Å. Wavelength shifts of this size, between the BLR and the NLR, have already been observed in many other AGNs (Gaskell 1982; Gaskell & Goosmann 2013).
4.2 MCG -01-24-012
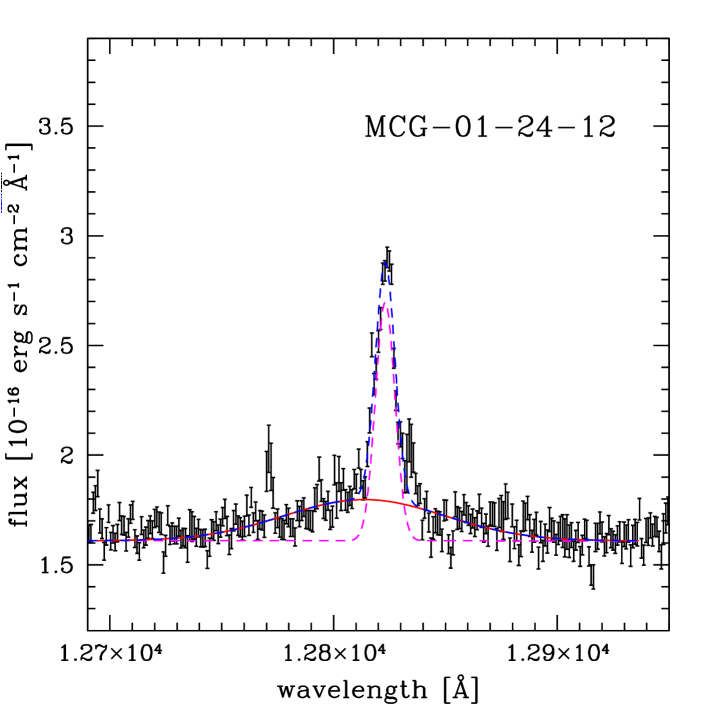
We have taken J band (1.1-1.4 m) medium resolution (MR) spectra of the nucleus of MCG -01-24-012 on January 7 2012 with ISAAC (Infrared Spectrometer And Array Camera) at the VLT/ESO, in the wavelength range of the Pa line. A 0.8′′120′′ wide slit was used, corresponding to a km s-1 spectral resolution. Four, 340 s long, spectra were taken. The nodding A B B A technique to remove the sky contribution to the spectra was used. The night was clear, the seeing was 1.2′′ and the airmass was 1.6. We also observed a bright standard star (spectral type: G2V) within 30 minutes from the target observations and with similar airmass, allowing us to use it for the flux calibration and telluric absorption correction. As usual, flats and arcs were taken within one day from the observations. Standard data reduction was carried out, similarly as described for NGC 4395 (sect. 4.1). The final spectrum was extracted with a spatial aperture of 0.9′′. The flux calibrated spectrum, in the wavelength region around the Pa emission line, is shown in Figure 5.
4.2.1 The Pa line fit
The ISAAC MR spectrum of MCG -01-24-012 shows the [Fe II] 12570 and the Pa lines (in Figure 5 we show only the region near the Pa line). As usual we converted the wavelength calibration to the rest frame before carrying out the emission line profile fitting. The [Fe II]12570 line profile was modeled using two components of different widths: a narrow one having center at =12570.6 Å and FWHM = 244 km s-1, and a broader component with center at = 12572.4 and FWHM = 557 km , which appears to be redshifted of 2 Å with respect to the narrow line. The Pa profile has been modelled with two Gaussian components, a narrow one, with center at =12823.1 Å, having the FWHM tied to the narrow [Fe II] 12570 line (in order to take into account of the NLR contribution), and a broad component which, although weak, it is clearly detectable, and results to have the center at = 12813.0 Å, FWHM = 2167 km s-1 (i.e. a 8% uncertainty) and a flux of 1.74 10-15 erg s-1 cm-2, corresponding to a luminosity of 1039.18±0.09 erg s-1. As discussed in section 3.2, and assumed for NGC 4395 (sect. 4.1.1), in order to later derive the BH mass, we used an uncertainty on the FWHM measure of 10%. After correcting for the very small instrumental broadening it results a FWHM of 2166 km s-1. We have also tried to add a [Fe II] 12791 component in blending with the Pa, but its contribution resulted to be negligible. We identified the 2166 km s-1 wide component of the Pa line as a measure of the motion of the BLR gas under the gravitational potential of the central BH.
5 The BH Mass of NGC 4395
The two above virial relationships can be used to measure the BH mass of NGC 4395. Thanks to our NIR observations, it results MBH= M⊙ and MBH= M⊙ if the equations based on LX (for NGC 4395 , with a 1 uncertainty of 9%; Baumgartner et al., 2013) and LPaβ are used, respectively. Because of the spreads of the previous fits, as expected, the mass derived using the X-ray luminosity dependent equation is more accurate than that measured using the relation dependent from the Pa luminosity. The two estimates are in statistical agreement at less than 1 confidence level, but are not independent from each other, as they both depend from the same FWHMPaβ measurement. It is therefore not possible to use both of them to derive a weighted mean estimate of the NGC 4395 BH mass. We then consider the measure MBH= M⊙ (based on the more accurate relationship which uses as a proxy of the BLR radius) as our best estimate of the BH mass in NGC 4395.
As discussed in section 2, the BH mass of NGC 4395 has already been estimated by other authors (Peterson et al., 2005; Graham et al., 2011; Edri et al., 2012). Our measure is close, and agrees well within the uncertainties, with the above previous measures (once the same geometrical factor is adopted). The BH mass measure by Graham et al. (2011) is based on the same reverberation mapping analysis of the CIV line by Peterson et al. (2005), then, once is used, both agree on the value MBH= M⊙ (see Figures 2 and 3, where our Pa measures and the SWIFT/BAT 14-195 keV luminosity have been used to plot the measure by Peterson et al. (2005)). The BH mass by Edri et al. (2012) is based on the reverberation mapping analysis of the H line and, once is assumed, it corresponds to M M⊙. If, instead, our Pa emission-line measures are used together with the relation by Kim et al. (2010, their eq. 10. See discussion in the next section), a BH mass for NGC 4395 of MBH= M⊙ is obtained. A result very close to our measure.
According to Vasudevan & Fabian (2007) and Shankar et al. (2013) the 14-195 keV luminosity of NGC 4395 corresponds to a bolometric luminosity (assuming ), and then our BH mass measure implies that the Eddington ratio of NGC 4395 is . A value quite common in local AGN (see e.g. Shankar et al., 2013).
6 Near Infrared SE BH mass relations including NGC 4395
As the previous independent BH mass estimate of NGC 4395 by Peterson et al. (2005) is compatible with our measure, we decided to include the measure by Peterson et al. (2005) in the calibration sample and rerun the fits in order to tie and extend the virial SE relationships at masses as low as M. This inclusion would not have been possible without our LUCI@LBT spectroscopic observations of the Pa emission line. The inclusion of NGC 4395 in the calibration sample does not significantly change the results of the fits. If the relationship based on LX is used, the best fit provides (see Figure 2)
| (6) |
The resulting observed spread is 0.23 dex, while the intrinsic spread results to be 0.20 dex. If the relationship based on LPaβ is used, the best fit provides (see Figure 3)
| (7) |
The resulting observed spread is 0.30 dex, while the intrinsic spread results to be 0.27 dex.
The same kind of relationship has been previously measured by Kim et al. (2010) using similar data but covering a narrower BH mass range ( M⊙). In order to compare the two relations it is necessary to a) rescale the masses of Kim et al. (2010) to a geometrical factor instead of the used by them and b) correct the Pa luminosities and FWHM measured by Landt et al. (2008, 2013) for 1.08 and 0.90 factors (respectively), in order to take into account, following Kim et al. (2010), the narrow line component effects in the line profile fits. Once these corrections are applied, the two relations result in fairly good agreement within the errors: they give the same results for M M⊙, while at M M⊙ and M M⊙ our estimates are 0.2 dex smaller and larger, respectively.
7 The BH Mass of MCG -01-24-012
As already discussed in sect. 2.2, MCG -01-24-012 is an X-ray absorbed Compton thin Seyfert 2 galaxy (N cm-2; Malizia et al., 2002) whose intrinsic 14-195 keV X-ray luminosity is (Baumgartner et al., 2013). It should be noted that in the case of Compton thin absorption, in the 14-195 keV X-ray band the absorption correction to derive the intrinsic X-ray luminosity is negligible (see, e.g., Figure 11 in Burlon et al., 2011). Thanks to the detection of a faint BLR component in the Pa emission line (see sect. 4.2.1) we can calculate the BH mass of the Seyfert 2 galaxy MCG -01-24-012. If we use eq. 6, taking into account a FWHMPaβ = 2166 km s-1, it results a BH mass of log(MBH/M⊙)= 7.170.24 . We cannot instead derive the BH mass using eq. 7, as it uses the Pa luminosity which is expected to be severely absorbed in type 2 AGNs. Indeed, if the observed luminosity of 1039.18 erg s-1 is used, a mass of log(MBH/M⊙)= 6.310.24 is obtained; an order of magnitude lower than obtained using the X-ray luminosity in eq. 6.
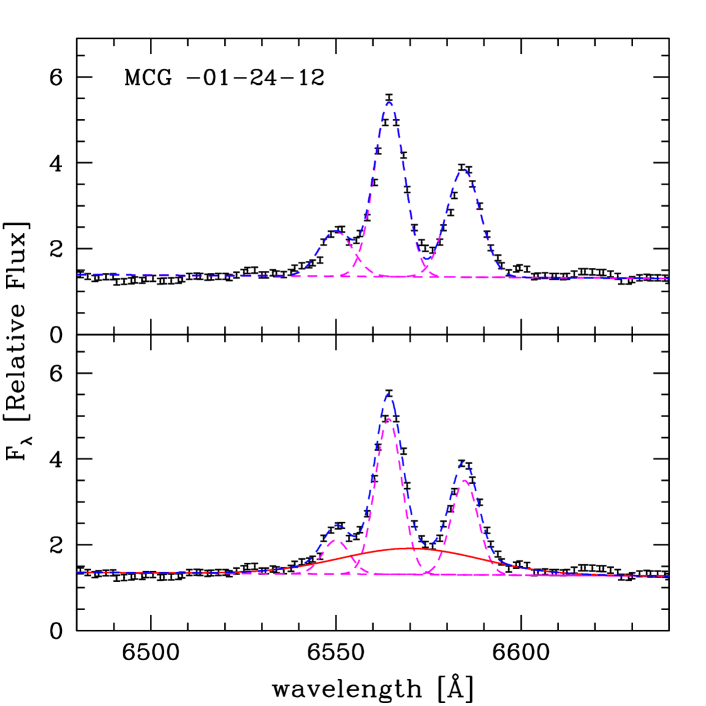
Although MCG -01-24-012 is classified as a Seyfert 2 galaxy we checked whether a faint broad H component was detectable in the 6dF optical spectrum (having resolution 550; Jones et al., 2009, and references therein). The H and [NII] emission lines are roughly well reproduced using narrow components only, all having widths compatible with the instrumental spectral resolution (FWHM 550 km s-1). However, for the sake of completeness, it should be noted that a significantly better fit is obtained if a broad H component, having FWHM = km s-1, is included (see Figure 6). The optical data have not a very good spectral resolution and therefore the FWHM estimate is quite uncertain. A proper subtraction of a starlight component could be very important in testing for the presence of a weak broad H component. However the quality of the data are not sufficient to carry out a starlight subtraction. If we use the measure of the width of the broad component of the H line and convert the 14-195 keV X-ray luminosity into a 2-10 keV luminosity, we can use eq. 5 in Bongiorno et al. (2014) to estimate the BH mass. If a photon index =1.8 is assumed, log(MBH/M⊙)= is obtained (a change of = 0.1 in the assumed photon index corresponds to a variation of /M⊙= 0.08 in the BH mass). The large uncertainty on the BH mass measure based on the H line prevents a significant comparison with the estimate based on the Pa line. Nonetheless, it should be noted that the two best fit values are very similar.
As done for NGC 4395, the 14-195 keV luminosity of MCG -01-24-012 can be converted to a bolometric luminosity LBol= 1044.8 erg s-1. Therefore our BH mass measure implies that the Eddington ratio of MCG -01-24-012 is . A value which is, also in this case, quite typical for local AGN (Shankar et al., 2013).
8 Luminosity of the Pa as a function of the 14-195 keV Luminosity
The two above discussed virial relationships (eqs. 6 and 7) imply that a significant correlation should exist between the Pa emission line luminosity (the BLR component), LPaβ, and the 14-195 keV luminosity, LX. Similar kind of relationships have been already studied and derived by other authors. For example, Panessa et al. (2006) studied the correlation between the H luminosity and the 2-10 keV luminosity on a sample of 87 Seyfert galaxies and low-z QSOs, finding
| (8) |
Using our calibration sample (with NGC 4395 included) we performed a free slope fit of the relation
| (9) |
The data ( and ) have a correlation coefficient which corresponds to a probability of of being drawn from an un-correlated population, while the fit provides a slope and a y-intercept (dashed line in Figure 7), with an intrinsic spread of 0.26 dex. If a unitary slope is assumed, then our fit provides:
| (10) |
(see the black continuous line in Figure 7). If we assume a photon index and a ratio of (case B recombination), our fit is in partial agreement with eq. 8 (from Panessa et al., 2006). Their eq. 8 should read , which predicts, in the range , BLR Pa luminosities 0.4 dex lower than on average observed in our data. This discrepancy could be attributed to the assumption of a case B recombination ratio between the Pa and H lines. There is indeed evidence that, in AGN, the Paschen line ratios rule out case B recombination (Soifer et al., 2004; Glikman et al., 2006).

9 Conclusions
As discussed in the introduction, the measure of local, low mass, BHs, such as those in the Seyfert 1 galaxy NGC 4395 and the Seyfert 2 galaxy MCG -01-24-012, is of great importance as these BHs give important informations on the AGN/galaxy formation and evolution. NGC 4395 hosts one of the local, smallest, BH of AGN origin ever found. Previous measures (if =4.31 is used) obtained MBH= from a reverberation mapping analysis of the CIV emission line (Peterson et al., 2005) and from a reverberation mapping analysis of the H emission line (Edri et al., 2012).
We have derived two new SE BH mass relationships based on the FWHM and luminosity of the BLR component of the Pa emission line and on the hard X-ray luminosity in the 14-195 keV band. These relationships have been initially calibrated in the M⊙ mass range and have then been used to obtain a new independent BH mass measure of NGC 4395. We obtained MBH=1.7 , which resulted in agreement (1 ) with the two previous existing estimates, therefore confirming the very small mass of its BH.
Thanks to our new measure of the Pa line and then mass of NGC 4395 we were able to extend in the M⊙ mass range our SE relationships. These relations are able to reliably measure the BH mass on those obscured or low luminosity AGN where the nuclear component is less visible and/or contaminated by the hosting galaxy. Our method has been indeed also successfully applied to the Seyfert 2 galaxy MCG -01-24-012, whose BH mass has been measured for the first time to be MBH=1.5 .
These results were already implicitly suggested by the study of La Franca et al. (2014) where it is discussed how the observed correlation between the AGN X-ray variability and the BH mass (e.g. Ponti et al., 2012; Kelly et al., 2013) is equivalent to a correlation between the X-ray variability and the virial product () computed using the same Pa and the hard X-ray luminosity measures utilised in this work.
We can conclude that our new derived NIR and hard X-ray based SE relationships could be of great help in measuring the BH mass in low luminosity and absorbed AGN and therefore better measuring the complete (AGN1+AGN2) super massive BH mass function. In this respect, in the future, a similar technique could also be applied at larger redshift. For example, at redshift 2-3 the Pa line could be observed in the 1-5 m wavelength range with NIRSPEC on the James Webb Space Telescope222See http://www.stsci.edu/jwst/instruments/nirspec. While, after a recalibration, the rest frame 14-195 keV X-ray luminosity could substituted by the 10-40 keV hard X-ray band (which is as well not so much affected by obscuration for mildly absorbed, Compton-thin, AGN). At redshift 2-3, in the observed frame, the 10-40 keV hard band roughly corresponds to the 2-10 keV energy range which is typically observed with the Chandra and XMM-Newton telescopes.
Acknowledgments
We thank the referee for her/his very useful comments which improved the manuscript. Based on observations made with ESO telescopes at the Paranal Observatory and the Large Binocular Telescope (LBT) at Mt. Graham, Arizona. The LBT is an international collaboration among institutions in the United States, Italy, and Germany. LBT Corporation partners are: The University of Arizona on behalf of the Arizona university system; Istituto Nazionale di Astrofisica, Italy; LBT Beteiligungsgesellschaft, Germany, representing the Max-Planck Society, the Astrophysical Institute Potsdam, and Heidelberg University; The Ohio State University; and The Research Corporation, on behalf of The University of Notre Dame, University of Minnesota, and University of Virginia.
We thank for the very efficient service observing mode operation management at LBT and the ESO staff at Paranal and Garching for their support during the preparation and execution of the observations. MB acknowledges support from the FP7 Career Integration Grant ”eEASy” (CIG 321913). We acknowledge funding from PRIN-MIUR 2010 award 2010NHBSBE and from PRIN-INAF 2011 “BH growth and AGN feedback through the cosmic time”.
References
- Barth et al. (2005) Barth A. J., Greene J. E., Ho L. C., 2005, ApJ, 619, L151
- Barth et al. (2004) Barth A. J., Ho L. C., Rutledge R. E., Sargent W. L. W., 2004, ApJ, 607, 90
- Baumgartner et al. (2013) Baumgartner W. H., Tueller J., Markwardt C. B., Skinner G. K., Barthelmy S., Mushotzky R. F., Evans P. A., Gehrels N., 2013, ApJS, 207, 19
- Bentz et al. (2006) Bentz M. C., Peterson B. M., Pogge R. W., Vestergaard M., Onken C. A., 2006, ApJ, 644, 133
- Bongiorno et al. (2014) Bongiorno A., Maiolino R., Brusa M., Marconi A., Piconcelli E., Lamastra A., Cano-Díaz M., Schulze A., Magnelli B., Vignali C., Fiore F., Menci N., Cresci G., La Franca F., Merloni A., 2014, MNRAS, 443, 2077
- Burlon et al. (2011) Burlon D., Ajello M., Greiner J., Comastri A., Merloni A., Gehrels N., 2011, ApJ, 728, 58
- Cristiani et al. (1997) Cristiani S., Trentini S., La Franca F., Andreani P., 1997, A&A, 321, 123
- de Grijp et al. (1992) de Grijp M. H. K., Keel W. C., Miley G. K., Goudfrooij P., Lub J., 1992, A&AS, 96, 389
- Denney et al. (2009) Denney K. D., Peterson B. M., Dietrich M., Vestergaard M., Bentz M. C., 2009, ApJ, 692, 246
- Denney et al. (2010) Denney K. D., Peterson B. M., Pogge R. W., Adair A., Atlee D. W., Au-Yong K., Bentz M. C., Bird J. C., Brokofsky D. J., Chisholm E., Comins M. L., Dietrich M., Doroshenko V. T., 2010, ApJ, 721, 715
- Dietrich & Hamann (2004) Dietrich M., Hamann F., 2004, ApJ, 611, 761
- Dong et al. (2012) Dong R., Greene J. E., Ho L. C., 2012, ApJ, 761, 73
- Dong & De Robertis (2006) Dong X. Y., De Robertis M. M., 2006, AJ, 131, 1236
- Edri et al. (2012) Edri H., Rafter S. E., Chelouche D., Kaspi S., Behar E., 2012, ApJ, 756, 73
- Ferrarese & Merritt (2000) Ferrarese L., Merritt D., 2000, ApJ, 539, L9
- Filippenko & Ho (2003) Filippenko A. V., Ho L. C., 2003, ApJ, 588, L13
- Filippenko et al. (1993) Filippenko A. V., Ho L. C., Sargent W. L. W., 1993, ApJ, 410, L75
- Filippenko & Sargent (1989) Filippenko A. V., Sargent W. L. W., 1989, ApJ, 342, L11
- Gebhardt et al. (2000) Gebhardt K., Kormendy J., Ho L. C., Bender R., Bower G., Dressler A., Faber S. M., Filippenko A. V., Green R., Grillmair C., Lauer T. R., Magorrian J., Pinkney J., Richstone D., Tremaine S., 2000, ApJ, 543, L5
- Glikman et al. (2006) Glikman E., Helfand D. J., White R. L., 2006, ApJ, 640, 579
- Graham et al. (2011) Graham A. W., Onken C. A., Athanassoula E., Combes F., 2011, MNRAS, 412, 2211
- Graham & Scott (2013) Graham A. W., Scott N., 2013, ApJ, 764, 151
- Greene (2012) Greene J. E., 2012, Nature Communications, 3
- Greene & Ho (2005) Greene J. E., Ho L. C., 2005, ApJ, 630, 122
- Greene & Ho (2007a) Greene J. E., Ho L. C., 2007a, ApJ, 670, 92
- Greene & Ho (2007b) Greene J. E., Ho L. C., 2007b, ApJ, 667, 131
- Greene et al. (2010) Greene J. E., Hood C. E., Barth A. J., Bennert V. N., Bentz M. C., Filippenko A. V., Gates E., Malkan M. A., Treu T., Walsh J. L., Woo J.-H., 2010, ApJ, 723, 409
- Grier et al. (2013) Grier C. J., Martini P., Watson L. C., Peterson B. M., Bentz M. C., Dasyra K. M., Dietrich M., Ferrarese L., Pogge R. W., Zu Y., 2013, ApJ, 773, 90
- Grupe et al. (2004) Grupe D., Wills B. J., Leighly K. M., Meusinger H., 2004, AJ, 127, 156
- Ho et al. (1995) Ho L. C., Filippenko A. V., Sargent W. L., 1995, ApJS, 98, 477
- Ho et al. (1997) Ho L. C., Filippenko A. V., Sargent W. L. W., Peng C. Y., 1997, ApJS, 112, 391
- Jones et al. (2009) Jones D. H., Read M. A., Saunders W., Colless M., Jarrett T., Parker Q. A., Fairall A. P., Mauch T., Sadler E. M., Watson F. G., Burton D., Campbell L. A., Cass P., Croom S. M., Dawe J., Fiegert K., Frankcombe L., et al. 2009, MNRAS, 399, 683
- Kelly et al. (2011) Kelly B. C., Sobolewska M., Siemiginowska A., 2011, ApJ, 730, 52
- Kelly et al. (2013) Kelly B. C., Treu T., Malkan M., Pancoast A., Woo J.-H., 2013, ApJ, 779, 187
- Kelly et al. (2009) Kelly B. C., Vestergaard M., Fan X., 2009, ApJ, 692, 1388
- Kelly et al. (2010) Kelly B. C., Vestergaard M., Fan X., Hopkins P., Hernquist L., Siemiginowska A., 2010, ApJ, 719, 1315
- Kim et al. (2010) Kim D., Im M., Kim M., 2010, ApJ, 724, 386
- Kraemer et al. (1999) Kraemer S. B., Ho L. C., Crenshaw D. M., Shields J. C., Filippenko A. V., 1999, ApJ, 520, 564
- Kunth et al. (1987) Kunth D., Sargent W. L. W., Bothun G. D., 1987, AJ, 93, 29
- La Franca et al. (2014) La Franca F., Bianchi S., Ponti G., Branchini E., Matt G., 2014, ApJ, 787, L12
- Landt et al. (2008) Landt H., Bentz M. C., Ward M. J., Elvis M., Peterson B. M., Korista K. T., Karovska M., 2008, ApJS, 174, 282
- Landt et al. (2011) Landt H., Elvis M., Ward M. J., Bentz M. C., Korista K. T., Karovska M., 2011, MNRAS, 414, 218
- Landt et al. (2013) Landt H., Ward M. J., Peterson B. M., Bentz M. C., Elvis M., Korista K. T., Karovska M., 2013, MNRAS, 432, 113
- Maiolino et al. (2007) Maiolino R., Shemmer O., Imanishi M., Netzer H., Oliva E., Lutz D., Sturm E., 2007, A&A, 468, 979
- Malizia et al. (2002) Malizia A., Malaguti G., Bassani L., Cappi M., Comastri A., Di Cocco G., Palazzi E., Vignali C., 2002, A&A, 394, 801
- Marconi & Hunt (2003) Marconi A., Hunt L. K., 2003, ApJ, 589, L21
- McLure & Jarvis (2002) McLure R. J., Jarvis M. J., 2002, MNRAS, 337, 109
- Merloni et al. (2010) Merloni A., Bongiorno A., Bolzonella M., Brusa M., Civano F., Comastri A., Elvis M., Fiore F., et al. ., 2010, ApJ, 708, 137
- Mullaney et al. (2011) Mullaney J. R., Alexander D. M., Goulding A. D., Hickox R. C., 2011, MNRAS, 414, 1082
- Panessa et al. (2006) Panessa F., Bassani L., Cappi M., Dadina M., Barcons X., Carrera F. J., Ho L. C., Iwasawa K., 2006, A&A, 455, 173
- Papadakis (2004) Papadakis I. E., 2004, MNRAS, 348, 207
- Peterson et al. (2005) Peterson B. M., Bentz M. C., Desroches L.-B., Filippenko A. V., Ho L. C., Kaspi S., Laor A., Maoz D., Moran E. C., Pogge R. W., Quillen A. C., 2005, ApJ, 632, 799
- Peterson et al. (2004) Peterson B. M., Ferrarese L., Gilbert K. M., Kaspi S., Malkan M. A., Maoz D., Merritt D., Netzer H., Onken C. A., Pogge R. W., Vestergaard M., Wandel A., 2004, ApJ, 613, 682
- Piccinotti et al. (1982) Piccinotti G., Mushotzky R. F., Boldt E. A., Holt S. S., Marshall F. E., Serlemitsos P. J., Shafer R. A., 1982, ApJ, 253, 485
- Ponti et al. (2012) Ponti G., Papadakis I., Bianchi S., Guainazzi M., Matt G., Uttley P., Bonilla N. F., 2012, A&A, 542, A83
- Press et al. (2007) Press W. H., Teukolsky S. A., Vetterling W. T., Flannery B. P., 2007, Numerical recipes: the art of scientific computing, 3rd edn.. Cambridge Univ. Press, Cambridge
- Sani et al. (2011) Sani E., Marconi A., Hunt L. K., Risaliti G., 2011, MNRAS, 413, 1479
- Schmitt et al. (2003) Schmitt H. R., Donley J. L., Antonucci R. R. J., Hutchings J. B., Kinney A. L., 2003, ApJS, 148, 327
- Shankar et al. (2013) Shankar F., Weinberg D. H., Miralda-Escudé J., 2013, MNRAS, 428, 421
- Soifer et al. (2004) Soifer B. T., Charmandaris V., Brandl B. R., Armus L., Appleton P. N., Burgdorf M. J., Devost D., Herter T., Higdon S. J. U., Higdon J. L., Houck J. R., Lawrence C. R., Morris P. W., Teplitz H. I., Uchida K. I., van Cleve J., Weedman D., 2004, ApJS, 154, 151
- Tremaine et al. (2002) Tremaine S., Gebhardt K., Bender R., Bower G., Dressler A., Faber S. M., Filippenko A. V., Green R., Grillmair C., Ho L. C., Kormendy J., Lauer T. R., Magorrian J., Pinkney J., Richstone D., 2002, ApJ, 574, 740
- Tueller et al. (2010) Tueller J., Baumgartner W. H., Markwardt C. B., Skinner G. K., Mushotzky R. F., Ajello M., Barthelmy S., Beardmore A., Brandt W. N., Burrows D., Chincarini G., Campana S., Cummings J., Cusumano G., Evans P., Fenimore E., et al. ., 2010, ApJS, 186, 378
- Vasudevan & Fabian (2007) Vasudevan R. V., Fabian A. C., 2007, MNRAS, 381, 1235
- Vestergaard (2002) Vestergaard M., 2002, ApJ, 571, 733
- Vestergaard (2004) Vestergaard M., 2004, ApJ, 601, 676
- Vestergaard & Osmer (2009) Vestergaard M., Osmer P. S., 2009, ApJ, 699, 800
- Vestergaard & Peterson (2006) Vestergaard M., Peterson B. M., 2006, ApJ, 641, 689
- Wandel et al. (1999) Wandel A., Peterson B. M., Malkan M. A., 1999, ApJ, 526, 579