Unbinding and unfolding of adhesion protein complexes through stretching:
interplay between shear and tensile mechanical clamps
Protein complexes in mechanical clamps
Abstract
Using coarse-grained molecular dynamics simulations, we analyze mechanically induced dissociation and unfolding of the protein complex CD48-2B4. This heterodimer is an indispensable component of the immunological system: 2B4 is a receptor on natural killer cells whereas CD48 is expressed on surfaces of various immune cells. So far, its mechanostability has not been assessed either experimentally or theoretically. We find that the dissociation processes strongly depend on the direction of pulling and may take place in several pathways. Interestingly, the CD48-2B4 interface can be divided into three distinct patches that act as units when resisting the pulling forces. At experimentally accessible pulling speeds, the characteristic mechanostability forces are in the range between 100 and 200 pN, depending on the pulling direction. These characteristic forces need not be associated with tensile forces involved in the act of separation of the complex because prior shear-involving unraveling within individual proteins may give rise to a higher force peak.
Keywords: single-molecule force spectroscopy; heterodimers; immunoglobulin-like domains; molecular dynamics simulations; coarse-grained models
Proteins: Structure, Function, and Bioinformatics
Accepted Article
DOI: 10.1002/prot.24674
1 Introduction
A variety of processes in biological cells are performed and controlled by large protein complexes rather than single proteins. Examples include replication, transcription, translation, signaling, protein transport and degradation, and cell adhesion [1]. Contemporary structural biology and molecular biophysics are thus concerned with understanding of ever larger and more dynamically complex molecular assemblies.
Force spectroscopy is a powerful method to study mechanical properties of single biopolymers and biomolecular assemblies. A typical force spectroscopy experiment uses atomic force microscope (AFM), or optical tweezers, to measure the response of a biomolecular system to stretching, squeezing, or torsional manipulation [2, 3, 4, 5, 6, 7]. These experiments have provided a variety of information on transport and force generation in cells, DNA replication and transcription [10], DNA unknotting and unwinding [8], ATP synthesis in mitochondria [9], mechanical behavior of virus capsids under squeezing [11, 12], and other biologically relevant problems.
There is a growing recent interest in theoretical and experimental assessments of mechanical stability of protein complexes. If there are no covalent bonds between individual proteins then stretching by the AFM tip may result in dissociation of the complex, unraveling of the constituent proteins, or both. The outcome reflects the strength of the binding forces and the structural organization of the complex. Examples of the systems considered so far include the titin Z1Z2-telethonin [13, 14], dimeric tubulin [15], the 3 domain-swapped cystatin [16, 17], oligomeric fibrinogen [18], covalently and non-covalently linked homo-dimeric systems with the cystine knot motif [20, 21], and the homo-trimeric capsomers of the CCMV virus capsid [22]. In particular, Dima and Joshi [15] have identified a viscoelastic behavior in unraveling of the intermeric couplings of tubulin chains. In distinction to the fibrous systems [18], there is no physiologically motivated direction of pulling in the cystine knot, capsomer, and cystatine complexes [20, 21, 22, 16, 17]. In these systems, the response to stretching has been found to be strongly anisotropic: It depends on which site the tip is attached to and which site serves as an anchor. This is a significant extension of the anisotropy phenomena that have been observed in monomeric proteins [19].
In this paper, we direct our attention to the anisotropic effects arising in mechanical manipulation of heterodimers. As an illustration we consider a cell adhesion complex in which mechanical manipulation may lead either to unfolding, or to dissociation, or to both effects combined, depending on the geometry of pulling. Specifically, we focus on the murine CD48-2B4 complex [23] with the Protein Data Bank structure code of 2PTT. Protein 2B4 is a heterophilic receptor present at the surface of natural killer cells. The antigenic CD48 proteins are expressed on surfaces of various immune cells. Interactions of CD48 with 2B4 regulate the activity of the natural killer cells, which are components of the innate immunity against tumors and virally infected cells. Even though the CD48-2B4 complex appears not to have been studied through the single molecule manipulation techniques yet, it serves as a convenient system for theoretical epxlorations.
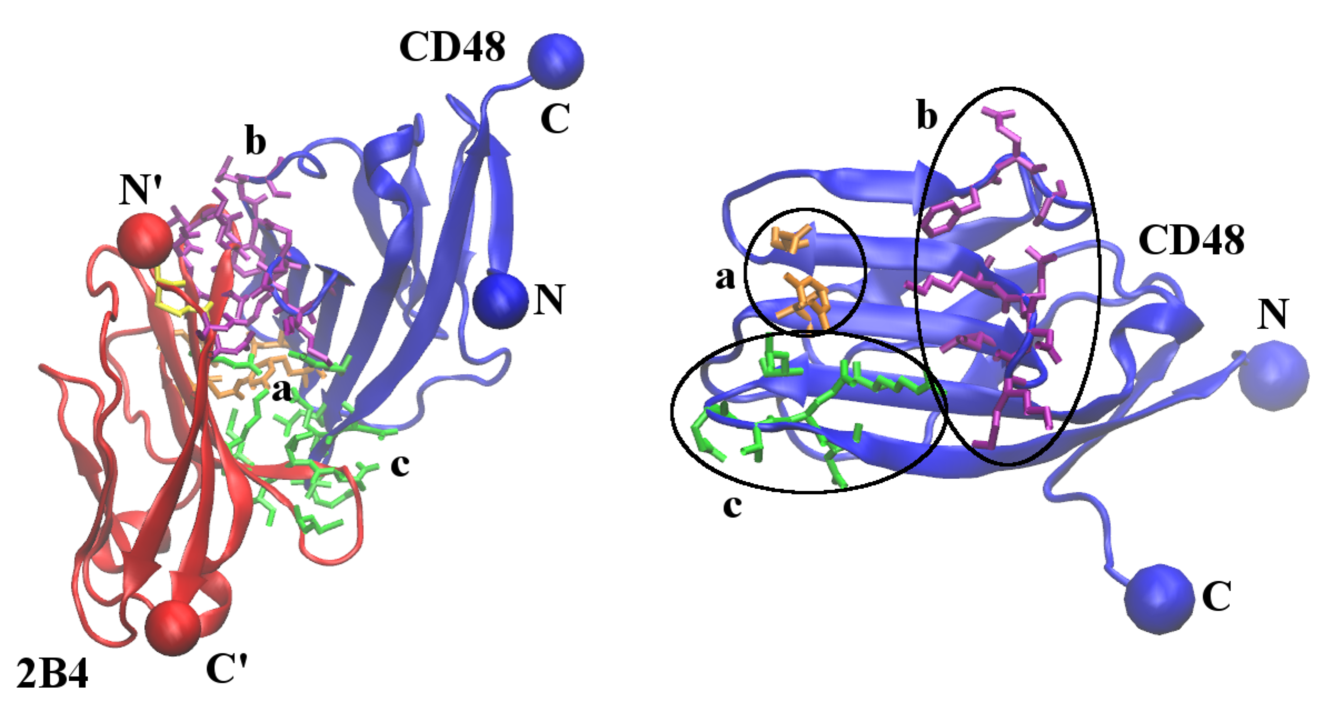
The crystal structure of the CD48-2B4 complex that we use in this study comprises two extracellular immunoglobulin-like domains: the C2-type domain of CD48 (shown in blue in Fig. 1), and the CD48-binding domain of 2B4 (shown in red in Fig. 1). These domains comprise 110 and 112 amino acid residues, respectively, which means that the CD48-2B4 system is too large for a thorough all-atom molecular dynamics study on relevant time scales. Here, we use a coarse-grained structure-based model to study the response of the CD48-2B4 complex to stretching at constant speed. For simplicity, we consider stretching only by the terminal sites. Some ways of choosing them may result in partial or complete unfolding of the constituent proteins, and other may lead to splitting of the complex into separate parts. We explore the roles of the inter- and intra-protein interactions in the competing processes of unfolding and dissociation of the CD48-2B4 complex.
The 2B4 receptor binds to CD48 with a modest strength, with the equilibrium dissociation constant in the low micromolar range and very fast on and off rates [23]. In the native state, 19 residues of 2B4 are in contact with 16 residues of CD48, and most of the contacting residues belong to loops and turns in CD48 and in 2B4. The CD48-2B4 interface involves only 36 contacts, as determined by atomic overlaps (see the Methods section), and one of our focal points is quantitative analysis of how and when these contacts break during the dissociation process.
We find that the dissociation scenarios as well as the force-displacement patterns depend sensitively on the choice of the termini that are used to implement stretching. In some cases, the proteins separate without any noticeable deformations or structural changes; in other cases, CD48 unfolds partially before the proteins dissociate. However, the inter-protein contacts always break in groups rather than sequentially. The 36 contacts between CD48 and 2B4 can be divided into three distinct patches, which are denoted here as a, b, and c, as shown in Fig. 1. We find that the three interface patches cooperate as units in resisting the stretching forces.
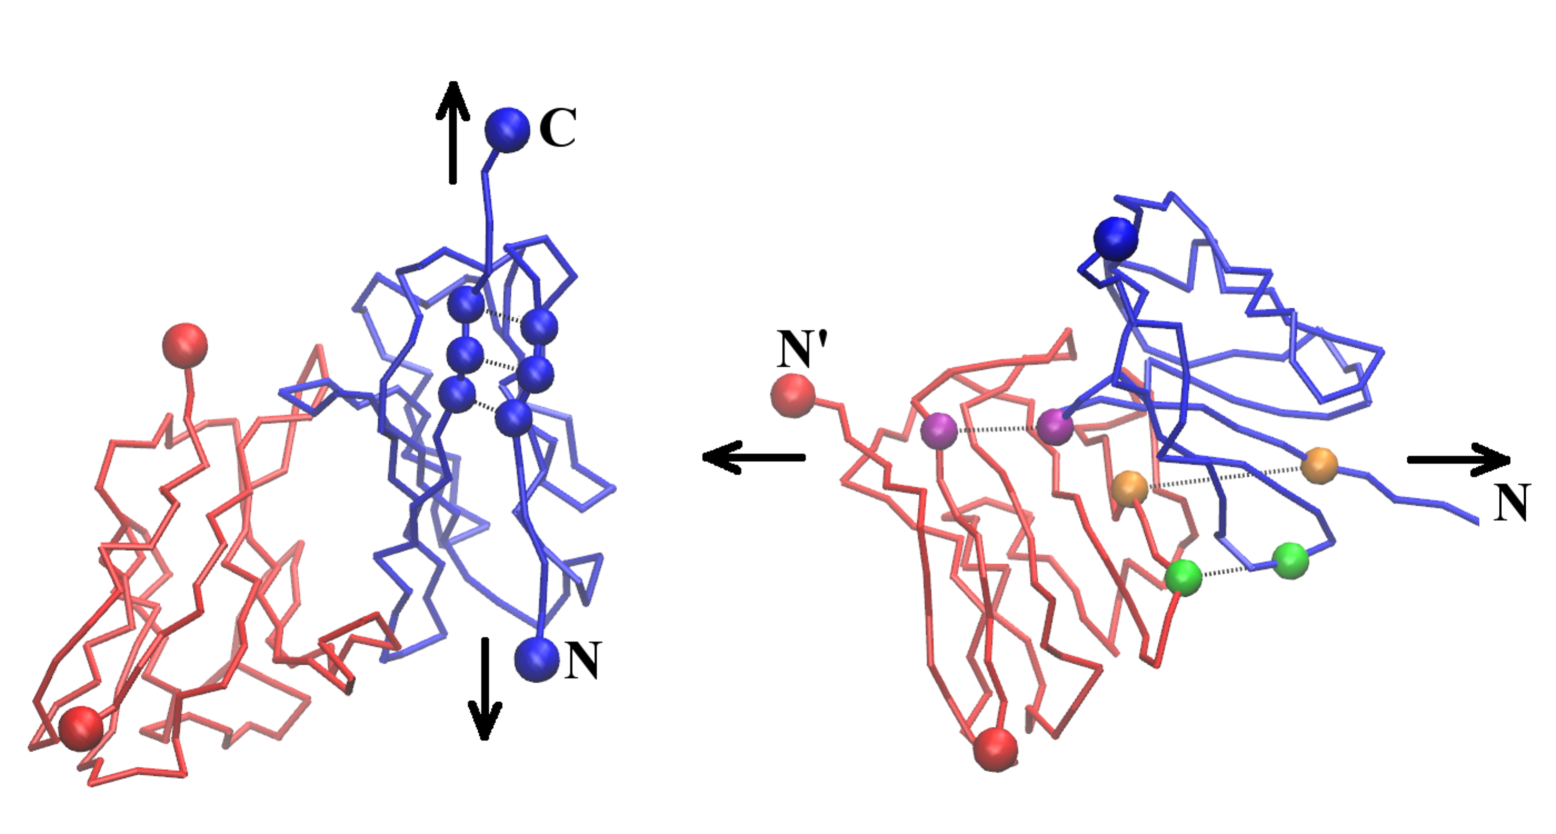
We also find that a significant resistance to stretching arises due to two types of mechanical clamps, which involve shear and tensile forces, respectively. In shearing, two -strands slide by, see the left-hand panel of Fig. 2. In tensile strain, the separation between two residues in contact increases along the line connecting them, as illustrated in the right-hand panel of Fig. 2. Some choices of the pulling termini generate merely tensile effects, followed by separation of the protein complex. Other choices involve both types of mechanical clamps, in which case several force peaks arise on the path to separation. The largest of the force peaks needs not be tensile in origin, and its height is not necessarily related to the binding strength of the complex. This observation is relevant for the interpretation of force spectroscopy experiments on protein complexes.
Since there is no force spectroscopy data on the CD48-2B4 complex that we could compare with our simulation results, we also simulate stretching of synaptotagmin 1, which is a membrane-trafficking multidomain protein that has been studied thoroughly in single-molecule pulling experiments [2, 24, 25]. Synaptotagmin 1 facilitates fusion of synaptic vesicles. Its cytoplasmic part is composed of two domains, C2A and C2B, which together form the C2AB complex. Our simulation results agree with experimental findings. In particular, we find that C2AB is significantly less stable than the I27 domain of titin, and that the C2A domain in the complex is less stable mechanically than its C2B partner.
2 Methods
2.1 Coarse-grained model
We use our coarse-grained structure-based model [26, 27, 28, 29], in which each amino acid residue is represented by a single bead centered on its Cα position. The beads are tethered together into chains by strong harmonic potentials with the spring constant Å2, where is the depth of the potential well associated with the native contacts, which serves as the basic energy scale in our model. The native contacts are identified using an overlap criterion [30] applied to the coordinates of all heavy atoms in the native structure. However, the amino acid pairs that are very close sequentially, and , are excluded from the contact map [28]. It should be noted than our scheme to identify native contacts is different than in, for example, self-organized polymer model [15, 18] where a uniform length cutoff is used.
The interactions within the native contacts are described by the Lennard-Jones potential
| (1) |
Here, is the distance between residues and in the contact, and the parameters are chosen so that each contact in the native structure is stabilized at the minimum of the Lennard-Jones potential. The value of is approximately given by pN Å, as has been determined by comparing simulational results to the experimental ones on a set of 38 proteins [29]. The contacts between the proteins are treated in the same manner as the contacts within the proteins as both sets are dominated by hydrogen bonds. The interactions in the non-native contacts are purely repulsive and given by the truncated and shifted Lennard-Jones potential corresponding to with Å. The energy function comprises also harmonic terms that favor the native values of local chiralities in each amino acid chain [31]. A harmonic potential with the same force constant as the Cα-Cα pseudo-bonds is used to model the disulfide bond between Cys 3 and Cys 100 in the 2B4 receptor (chain B in the PDB structure 2PPT).
The solvent is implicit and the system evolves in time according to the Langevin dynamics. The overall force acting on a particular bead is a sum of three terms: (i) the direct force that derives from all the potential terms, (ii) the damping force that is proportional to the velocity of the bead, and (iii) the random force, , that represents thermal noise. The corresponding equations of motion
| (2) |
are solved by the fifth order predictor-corrector algorithm with the time step of . Here, is the damping coefficient and all beads are assumed to have the same mass . The dispersion of the noise is given by , where is the Boltzmann constant and denotes the temperature. All simulations were performed at which is near-optimal in folding kinetics and is of order of the room temperature. The damping coefficient is set to . This value corresponds to the overdamped case – practically Brownian dynamics – and the characteristic time scale, , is of order 1 ns, as argued in Refs. [32, 33].
The native contacts can break during the time evolution. Our criterion for this to happen is that the distance between residues and in a contact exceeds .
2.2 Pulling simulations
Stretching of the CD48-2B4 complex is implemented by attaching harmonic springs to two terminal amino acids. One of the springs is fixed in space and the other one is moved with a constant speed, , so that the distance it travels in time is . The force constant of the pulling springs is taken as Å2, which corresponds to about 1 pN/nm and is close to the elasticity of typical AFM cantilevers [29].
In our simulations, the response force, , acting on the pulling spring is measured and averaged over time periods that correspond to the spring displacements of 0.5 Å [29]. The - curves (see the top panels in Fig. 3 and and several later figures) may come with several peaks, and the height of the largest of them will be denoted by . We perform simulations for a range of speeds with the trajectories evolving for up to 4 ms. Specific examples of the - patterns will be shown for Å/.
All of the pulling simulations start from the native state. In the course of the simulations, the breaking and re-formation of native contacts is followed in time. The native contact between residues and is considered broken if the inter-residue distance exceeds a cutoff length, as defined in section 2.1. Due to thermal fluctuations, the broken contacts may get re-established. To characterize the unfolding and dissociation pattern of the events, we record the spring displacements at which the native contacts break for the last time. In the corresponding scenario diagrams (see the bottom panels in Fig. 3 and several later figures), native contacts are labeled by the sequential distance between the residues involved. Here, we use the convention in which the index runs from 1 to 216 so that the values between 1 and 106 correspond to CD48 and between 107 and 216 – to 2B4. Positions of five amino acids are not available in the structure file (residues 1, 2 and 3 in chain A, and residues 1 and 110 in chain B) and hence the effective sequential size of the system is smaller than the nominal 106 plus 110. The inter-protein contacts in patches a, b, and c (shown in Fig. 1 in orange, purple and green, respectively) correspond to around 30 and around 145, around 40 and around 195, and finally to around 90 and around 150, respectively.
Our model is based on the knowledge of the native structure of the protein complex. Both CD48 and 2B4 are -proteins, see Fig. 1. Protein 2B4 comprises two apposing -sheets. One of them is formed by five -strands (, , , and ) and the other one by three -strands (, and ). Here, the -strands are labeled from the N-terminus to the C-terminus. 2B4 also contains two short helices: located between and , and between and . There are also two -sheets in CD48: the first one is formed by , , , , and , whereas the second one is composed of , and . Protein CD48 contains also a short -helix, denoted here by , which is located between and in the apposing -sheets.
3 Results and Discussion
For any heterodimer, there are six distinct ways to choose a pair of termini, and each choice may lead to more than one response pathway in stretching. Here and below, the termini in CD48 will be denoted by N and C whereas those in 2B4 by N′ and C′, see Fig. 1.
Stretching is applied along the line connecting the two chosen termini. To describe the shift in the orientation of stretching in the protocols discussed below, we introduce an angle between the C-C′ direction and other directions of stretching. We obtain (N-N′)=68∘, (N-C′)=16∘, (C-N′)=23∘, (N-C)=28∘, and (N′-C′)=38∘.
3.1 Dissociation
We first discuss situations in which the two termini defining the pulling direction belong to different protein chains. This way of pulling results in mechanically induced dissociation of the two proteins.
3.1.1 N-N′ protocol
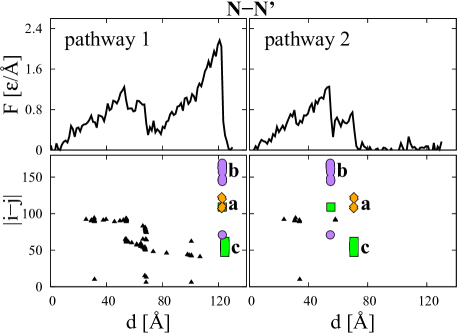
It is useful to first consider the N-N′ protocol, in which the pulling springs are attached to the N-termini of CD48 and 2B4. We observe existence of two kinds of dissociation pathways, as illustrated in Fig.3. In both of them, there is no breaking of contacts within 2B4 because the disulfide bond between Cys 3 and Cys 100 holds the chain in a sturdy manner.
On the first pathway, protein CD48 unfolds partially through unzipping giving rise to a minor force peak at the spring displacement of about 55 Å. This force peak is associated with breaking of contacts between the - and the - loops, and between the - loop and the C-terminal tail of CD48. The unzipping process stops at of about 100 Å, when strands and in CD48 get fully unraveled. At between about 100 Å and 120 Å, the protein complex re-orients itself so that a tensile clamp between the two proteins is formed, see the right-hand panel of Fig. 2. Then, at of about 125 Å, all of the interface contacts break almost simultaneously, which yields large response forces with of /Å, which is comparable to that of the I27 domain of titin [29].
On the second pathway, there is no appreciable unfolding within neither of the two units. Instead, the two force peaks that are observed are due to rupturing of the interface contacts. The contacts in patch b rupture at of about 55 Å, which is reflected in moderate response forces with of about /Å. Then the contacts in patches a and c rupture almost simultaneously at of about 70 Å with a smaller force. In both rupturing events, we observe tensile mechanical clamps. What prevents unraveling of CD48 on the second pathway are the contacts between and ; these contacts break early on the first pathway but they never do on the second pathway. The first pathway occures more often but the level of dominance varies with the speed of pulling, as shown in the top panel of Fig. S1 in Supporting Information (SI).
3.1.2 N-C′ protocol
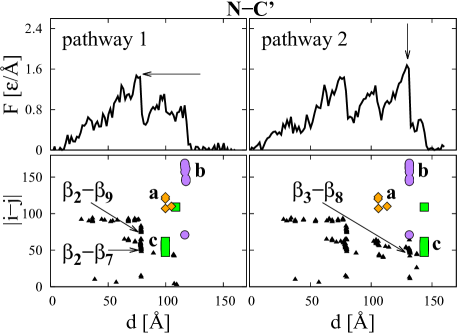
Pulling in the N-C′ protocol also results in two pathways that lead to separation of the protein complex, see Fig. 4. The two pathways are very similar initially, at Å, when and unravel. However, in the first pathway, of about 1.6 /Å arising at Å is due to shear between and , and between and in CD48, as indicated by arrows in Fig. 4. The inter-protein patches break later: first patches a and c at Å and then patch b at of about 120 Å. The associated force peaks are smaller.
In the second pathway, unraveling of and gives rise only to a minor force peak at Å. The next peak at of about 110 Å is due to rupturing of contacts in patch a. However, of about 1.8 /Å arises when the contacts in patch b and those between and in CD48 break simultaneously. These events occur at of about 130 Å and are immediately followed by the breakage of contacts in patch c at Å. The first pathway dominates and its statistical weight increases with decreasing speed , see the middle panel of Fig. S1 in SI. In fact, the second pathway is never observed at small pulling speeds ( Å/).
3.1.3 C-N′ and C-C′ protocols
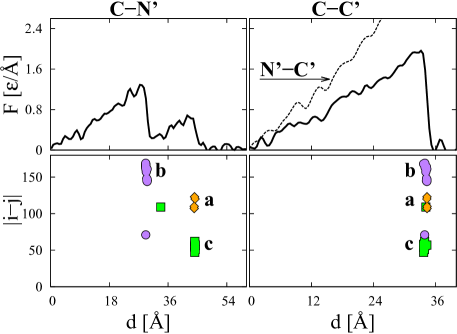
In protocols C-N′ and C-C′ we observe only tensile effects and no multiple dissociation pathways. The corresponding - patterns and dissociation scenarios are shown in Fig. 5. For both protocols, no intra-protein contacts are ruptured before the two units break loose. In the C-N′ protocol, the contacts in patch b get broken at of about 30 Å, which yields of about 1.3 /Å, and then the contacts in patches a and c break simultaneously at of about 45 Å with smaller forces. In the C-C′ protocol, the three patches break simultaneously at of about 35 Å, and increases to about 1.9 /Å.
3.2 Unfolding: N-C and N′-C′ protocols
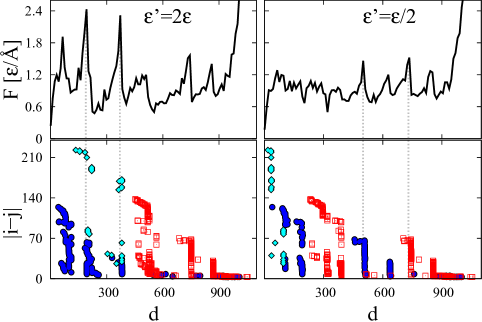
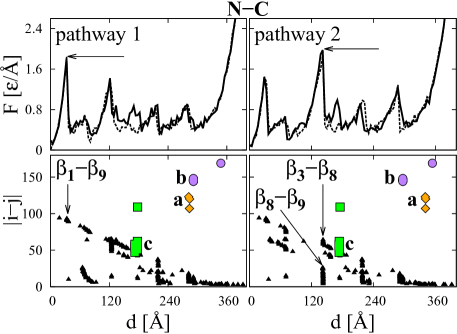
We now consider situations in which the two termini defining the pulling direction belong to the same protein chain. Pulling in the N′-C′ protocol results in a monotonic growth of with because of the tethering effect exerted by the disulfide bond between Cys 3 and Cys 100 in 2B4, see the dashed line in Fig. 5. On the other hand, pulling in the N-C protocol results in full unraveling of CD48 that can proceed along two pathways. The maximum force arises either as the first (pathway 1) or the third (pathway 2) peak in the - curves, as indicated by arrows in the top panels in Fig. 6. The values of are 1.7 /Å and 1.9 /Å, respectively. In the first pathway, the mechanical clamp is due to shearing between and in CD48, as illustrated in the left-hand panel of Fig. 2. The shearing between and occures at of about 30 Å. In the second pathway, the mechanical clamp is due to shearing between and , and between and , which takes place at Å.
Interestingly, the larger the sequential distance of a contact, the earlier its rupture takes place. The contacts in the inter-protein patches get broken only after the tertiary structure in CD48 is destroyed. Each of the patches acts coherently, but unlike what happens in the dissociative protocols, individual patches get affected at different times.
We observe the same two pathways of CD48 unraveling in the presence and absence of the partner protein 2B4, as indicated by the solid and dashed lines in Fig. 6, respectively. Interestingly, as shown in the bottom panel of Fig. S1, the first pathway is statistically more relevant at intermediate pulling speeds ( Å Å), and the second pathway dominates at low and high pulling speeds.
3.3 Shear and tensile mechanical clamps
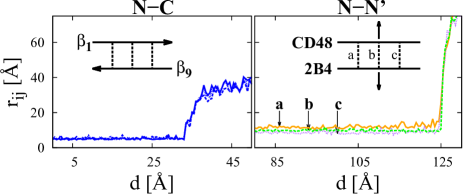
As discussed before, arises either as a result of shear between -strands in CD48 or due to the tensile clamps between CD48 and 2B4, depending on the pulling protocol and pathway. The distinction between the two kinds of mechanical clamps sits in the directionality of the movements of the residues involved, as illustrated by the simulation snapshots in Fig. 2. However, it also shows in the time dependence of the distances between the residues in contacts that form the clamp. The left-hand panel of Fig. 7 shows three such distances as a function of in pathway 1 in the N-C protocol. These distances correspond to three native contacts between and in CD48. For Å, the inter-residue distances fluctuate around their native values. At a critical distance of about 32 Å, shearing between the two -strands leads to the simultaneous breaking of the three contacts, which is reflected in the fast increase in the inter-residue distances from about 5 Å to about 35 Å. In the right-hand panel of Fig. 7, the three distances correspond to contacts between CD48 and 2B4 in patches a, b and c, respectively. The situation considered here relates to pathway 1 in the N-N′ protocol. For Å, the inter-residue distances fluctuate around their native values. At a critical distance Å, the contacts in patches a, b and c break simultaneously, which leads to a sudden increase in the distances from about 10 Å to about 70 Å. The difference between the two clamps is in the steepness and magnitude of the increase of the inter-residue distances – from 5 to 35 Å, and from 10 to 70 Å in the case of shear and tensile clamps, respectively. The simulation snapshots in Fig. 2 correspond, left-to-right, to the panels of Fig. 7.
3.4 The velocity dependence
Our discussion so far has been focused mainly on trajectories obtained at one particular speed of pulling, Å/. We now discuss how varies with , see Fig. 8. We performed simulations at seven different speeds of pulling ranging from Å/ to Å/, which corresponds to the experimental speeds between 10 nm/ms and 1 nm/s. At each of the pulling speeds we ran at least 60 trajectories. We separated the simulation data into pathways, if any, and averaged over the trajectories. We find an efective logarithmic dependence [34, 35]
| (3) |
in the range of the speeds studied. Here, the unit of speed is =1 Å/. The fitting parameters and are summarized in Table I. The parameter describes how fast changes with . The range of variations in is seen to be within a factor of 1.5, which reflects anisotropy effects. Interestingly, the two pathways of the N-C protocol exhibit almost identical values of the parameter . The slowest dependence is observed for the C-N′ protocol whereas the most rapid one is seen for the second pathway of the N-N′ protocol.
Assuming the Bell-Evans model [34, 35] in which
| (4) |
one can extract the intrinsic off-rates of the interacting proteins, , and the location of the free-energy barriers confining the proteins in their bound state, , from the fitting parameters and . Comparison of Eqs. (3) and (4) gives and . The resulting values of and are summarized in Table I. In case of deviations from the logarithmic dependence (4), one can use more sophisticated theories [36] that permit to extract also the height of the free-energy barriers .
It is interesting to observe that the smallest off-rates in Table I correspond to either complete (protocol N-C) or partial (N-N′ pathway 1) unfolding of CD48. The off-rates that correspond merely to dissociation (protocols C-C′, C-N′, and N-N′ pathway 2) are orders of magnitude larger. Nevertheless, some values of as given in Table I seem unreasonably small. They have been obtained at . Higher temperatures should lead to their substantial increase. Note that the room temperature is more likely to correspond to about (notice that the value of itself comes with about 25 % uncertainty [29]) and the physiological temperatures are still higher.
We note that when the pulling sites are the N- and C′-termini, the second pathway occurs only at the pulling speeds Å/, which is indicated by the absence of data points at small speeds Å/. To further investigate this observation, we calculated the frequency of occurrence of the first pathway in protocols N-N′, N-C′ and N-C. At a particular speed of pulling, the frequency is defined as the ratio of the number of trajectories at which the first pathway has occured to the total number of trajectories. The occurrence frequency as a function of the pulling speed is shown in Fig. S1. In the N-N′ protocol, the frequency varies between 0.6 and 0.95, and attains the maximum value at Å/. In the N-C′ protocol, increases from 0.65 at Å/ to 1 at Å/, and remains constant, , in the interval between Å/ and Å/. In the N-C protocol, the frequency increases with the speed in the interval between Å/ and Å/, and decreases with in the interval from Å/ to Å/, with the maximal value of 0.7 at Å/. The error bars in Fig. S1 indicate the standard deviation of the Bernoulli process.
We now turn our attention to the process of CD48-2B4 separation. The separation event takes place at the moment when no contacts are present between CD48 and 2B4 for the first time on the trajectory. The corresponding spring displacement at which separation takes place will be denoted by . Fig. S2 in SI shows that decreases with in a way that depends on the protocol and the pathway. Its most significant dependence is observed for pathway 2 in protocal N-C′, which is the pathway that finds no continuation at small speeds. The decrease in reflects the greater role of thermal fluctuations at lower speeds since fluctuations foster separation.
The spring displacement does not directly relate to the end-to-end distance, , between the pulling termini. In fact, reflects transformations in the structure in a more direct manner. Fig. S3 in SI shows that – i.e. the value of corresponding to separation – also depends on , although usually less sensitively. For instance, there is much less variation in compared to in the C-C′ protocol. On the other hand, they are about the same for both pathways in the N-C′ protocol.
3.5 Stretching of the multidomain synaptotagmin 1
To our knowledge, there have been no single-molecule pulling experiments performed on the CD48-2B4 complex. Thus the assumptions underlying the construction of our model, especially about the relative strength of the inter-protein contacts remain untested. To establish connections to force spectroscopy experiments on membrane-associated multidomain proteins, we performed pulling simulations of synaptotagmin 1. The latter protein is involved in remodeling the plasma membrane during neurotransmitter release at the synapse. The cytoplasmic region of synaptotagmin 1 contains two domains, C2A and C2B, which together form the C2AB module. These two domains are quite similar structurally but have been found to exhibit different mechanical stabilities within the C2AB module [24, 37].
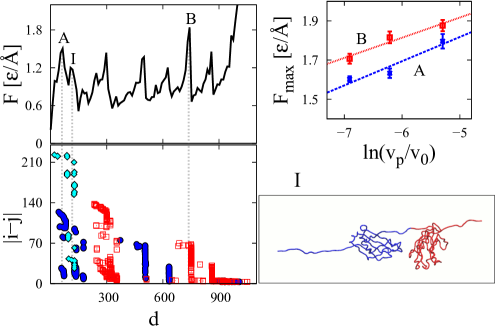
The issue which is analogous to that pertaining to the CD48-2B4 complex is whether it is indeed sensible to assume that the inter-domain contact energy, which we denote here by , is about the same as the contact energy within each domain. Fig. 9 shows a typical - curve and the corresponding scenario diagram for and Å/. The highest force peak (labelled as B in Fig. 9) is associated with rupturing the core of the C2B domain. The second highest peak (labeled as A in Fig. 9) arises when and of the C2A domain unravel. This event is followed by breaking the C2AB interface, which results in a minor force peak (labeled by I in Fig. 9). A typical simulation configuration at this stage is depicted in the lower right corner of Fig. 9. It is similar to the relevant configuration obtained in steered molecular dynamics simulations performed at a pulling speed that is three orders of magnitude larger than used here [24].
After extrapolation to the experimental pulling speed, see Fig. 9, we obtain the values of to be equal to pN and pN for the force peaks B and A, respectively. These values are consistent with the experimental results of about 100 pN and 50 pN (with the statistical error of about 20 pN) for the C2B and C2A domains [24].
We now consider the situation in which is distinct from . We find that if then the C2A domain becomes much more stable than the C2B domain, which disagrees with experimental findings. On the other hand, if then the second highest force peak becomes associated with rupturing the core of the C2A domain rather than with unraveling of and , see Fig. S4 in SI. However, the characteristic forces (/Å and /Å for C2A and C2B, respectively, at Å/) are very close to those presented in Fig. 9 (/Å and /Å) at the same speed of pulling. Nevertheless, the appearance of the whole - pattern is much closer to the experimental one when than when is reduced. We therefore conclude that assuming the equality of and is consistent with the experimental results and with the similarity of the physical nature of the interdomain contacts.
4 Conclusions
The mechanical stability of adhesion proteins and their complexes is necessary to sustain interactions and signaling between cells. To investigate the mechanical stability of the adhesion protein complex CD48-2B4, we have performed pulling simulations using our coarse-grained structure-based model. We find that the force peaks arise either as a result of shear between -strands in CD48 or due to tensile mechanical clamps between CD48 and 2B4, depending on the mode of pulling and dissociation pathway. If there are several force peaks in a given curve then, in general, the maximal one may be associated with shear or with the tensile separation. In the former case, the measurement of would not provide an estimate of the adhesion forces.
Table 10 provides a summary of our findings regarding the values of for various protocols of stretching. For a given , the table is symmetric. We present it in a way which gives values of for two pulling speeds: above the diagonal the data correspond to of Å/ – the standard used in our surveys of mechanostability [29] – and below the diagonal they correspond to Å/, which is in the lower range of speeds used in protein-related AFM experiments [29]. The highlighted diagonal blocks in the table correspond to same-chain pulling which results either in structure unfolding (N-C) or just deformation (N′-C′). The off-diagonal blocks correspond to pulling of different chains which results in dissociation. The dependencies are seen to be comparable in these two classes of pullings, and dissociation may come either with a smaller or larger than unraveling.
We observe existence of strong anisotropies. For dissociation, varies between 0.9 and 1.7 /Å at the extrapolated experimental speed. For unraveling – between 1.35 and 1.55 /Å. In the N-C protocol, and also on the first pathway of the N-C′ protocol, is caused by shear between -strands in CD48. In other pulling protocols, is due to tensile mechanical clamps between CD48 and 2B4. It is important to note that the largest force signal during dissociation may actually come from shearing and not tensile separation.
Both CD48 and 2B4 are anchored in membranes through the C-terminal ends [23]. The forces acting on the CD48-2B4 complex during cell adhesion are thus applied in the C-C′ direction (although membrane fluctuations on nanometer scales may alter this direction to some extent [38]). Interestingly, we find that in the C-C′ pulling simulations neither CD48 nor 2B4 unravels (both proteins maintain their structure) and the entire CD48-2B4 interface acts as a whole to resist external forces with /Å at the experimental speed of pulling. The latter value corresponds to about 150 pN. These results suggest that the CD48-2B4 complex is adapted to resist significant forces while maintaining the structure of individual proteins. In particular, the disulfide bond between Cys 3 and Cys 100 prevents the rupturing of contacts within 2B4.
Acknowledgments
This work has been supported by the Polish National Science Centre Grants No. 2012/05/B/NZ1/00631 (BR) and 2011/01/B/ST3/02190 (MC) as well as by the ERA-NET Grant FiberFuel (MC). ŁM acknowledges access to the KRUK computer cluster at the Faculty of Physics, University of Warsaw.
References
- [1] Alberts B, Johnson A, Lewis J, Raff M, Roberts K, Walter P. Molecular Biology of the Cell. New York: Garland Science; 2002.
- [2] Carrion-Vazquez M, Oberhauser AF, Fisher TE, Marszalek PE, Li H, Fernandez JM. Mechanical design of proteins studied by single-molecule force spectroscopy and protein engineering. Prog Biophys Mol Biol 2000;74:63-91.
- [3] Rittort F. Single molecules experiments in biological physics: methods and applications. J Phys Cond Mat 2006;18:531-583.
- [4] Vogel V. Mechanotransduction involving multimodular proteins: converting force into biochemical signals. Annu Rev Biophys Biomol Struct 2006;35:459-488.
- [5] Nauman KC, Nagy A. Single-molecule force spectroscopy: optical tweezers, magnetic tweezers and atomic force microscopy. Nat Meth 2008;5:491-505.
- [6] Crampton N, Brockwell DJ. Unravelling the design principles for single protein mechanical strength. Curr Opin Struct Biol 2010;20:508-517.
- [7] Galera-Prat A, Gomez-Sicilia A, Oberhauser AF, Cieplak M, Carrion-Vazquez M. Understanding biology by stretching proteins: recent progress. Curr Opin Struct Biol 2010;20:63-69.
- [8] Witz G, Stasiak A. DNA supercoiling and its role in DNA decatenation and unknotting. Nucl Acids Res 2010;38:2119-2133.
- [9] Buzhynskyy N, Sens P, Prima V, Sturgis JN, Scheuring S. Rows of ATP Synthase Dimers in Native Mitochondrial Inner Membranes. Biophys J 2007;93:2870-2876.
- [10] Mastrangelo IA, Bezanilla M, Hansma PK, Hough PV, Hansma HG. Structures of large T antigen at the origin of SV40 DNA replication by atomic force microscopy. Biophys J 1994;66:293-298.
- [11] Roos WH, Bruisma R, Wuite GJL. Physical virology. Nat Phys 2010;6:733-743.
- [12] Cieplak M, Robbins MO. Nanoindentation of 35 virus capsids in a molecular model: Relating Mechanical Properties to Structure. PLOS ONE 2013;8:e63640.
- [13] Lee EH, Gao M, Pinotsis N, Wilmanns M, Schulten K. Mechanical strength of the titin Z1Z2-telethonin complex. Structure 2006;14:497–509.
- [14] Bertz M, Wilmanns M, Rief M. The titin-telethonin complex is a directed, superstable molecular bond in the muscle Z-disk. Proc Natl Acad Sci USA 2009;106:13307-13310.
- [15] Dima RI, Joshi H. Probing the origin of tubulin rigidity with molecular simulations. Proc Natl Acad Sci USA 2008;105:15743-15748.
- [16] Sikora M, Cieplak M. Mechanical stability of multidomain proteins and novel mechanical clamps. Proteins: Struct Funct Bioinf 2010;79:1786-1799.
- [17] Janowski R, Kozak M, Janowska E, Grzonka Z, Grubb A, Abrahamson M, Jaskólski M. Human cystatin C, an amyloidogenic protein, dimerizes through three-dimensional domain swapping. Nat Struct Biol 2001;8:316–320.
- [18] Zhmurov A, Brown AEX, Litvinov RI, Dima RI, Weisel JW, Barsegov V. Mechanism of Fibrin(ogen) forced unfolding. Structure 2011;19:1615-1624.
- [19] Dietz H, Berkemeier F, Bertz M, Rief M. Anisotropic deformation response of single protein molecules. Proc Natl Acad Sci USA 2006; 103:12724-12728.
- [20] Sikora M, Cieplak M. Formation of cystine slipknots in dimeric proteins. PLOS ONE 2013;8:e57443.
- [21] Sikora M, Cieplak M. Cystine plug and other novel mechanisms of large mechanical stability in dimeric proteins. Phys Rev Lett 2012;109:208101.
- [22] Cieplak M. Mechanostability of virus capsids and their proteins in structure-based models. In: Liwo A, editor. Computational methods to study the structure and dynamics of biomolecules and biomolecular processes - from bioinformatics to molecular quantum mechanics. Heidelberg: Springer; 2014. p 295-315.
- [23] Velikovsky CA, Deng L, Chlewicki LK, Fernandez MM, Kumar V, Mariuzza RA. Structure of Natural Killer Receptor 2B4 Bound to CD48 Reveals Basis for Heterophilic Recognition in Signaling Lymphocyte Activation Molecule Family. Immunity 2007;27:572–584.
- [24] Fuson KL, Ma L, Sutton RB, Oberhauser AF. The C2 Domains of Human Synaptotagmin 1 Have Distinct Mechanical Properties. Biophys J 2009;96:1083-1090.
- [25] Takahashi H, Shahin V, Henderson RM, Takeyasu K, Edwardson JM. Interaction of Synaptotagmin with Lipid Bilayers, Analyzed by Single-Molecule Force Spectroscopy. Biophys J 2010;99:2550-2558.
- [26] Cieplak M, Hoang TX. Universality classes in folding times of proteins. Biophys J 2003;84:475-488.
- [27] Sułkowska JI, Cieplak M. Mechanical stretching of proteins – a theoretical survey of the Protein Data Bank. J Phys Cond Mat 2007;19:283201.
- [28] Sułkowska JI, Cieplak M. Selection of optimal variants of Go-like models of proteins through studies of stretching. Biophys J 2008;95:3174-3191.
- [29] Sikora M, Sułkowska JI, Cieplak M. Mechanical strength of 17 134 model proteins and cysteine slipknots. PLOS Comp Biol 2009;5:e1000547.
- [30] Tsai J, Taylor R, Chothia C, Gerstein M. The packing density in proteins: Standard radii and volumes. J Mol Biol 1999;290:253-266.
- [31] Kwiecinska JI, Cieplak M. Chirality and protein folding. J Phys Cond Mat 2005;17:S1565-S1580.
- [32] Veitshans T, Klimov D, Thirumalai D. Protein folding kinetics:Timescales, pathways and energy landscapes in terms of sequence dependent properties. Folding and Design 1997;2:1-22.
- [33] Szymczak P, Cieplak M. Stretching of proteins in a uniform flow. J Chem Phys 2006;125:164903.
- [34] Bell G. Models for the specific adhesion of cells to cells. Science 1978;200:618-627.
- [35] Evans E, Ritchie K. Dynamic Strength of Molecular Adhesion Bonds. Biophys J 1997;72:1541-1555.
- [36] Dudko OK, Hummer G, Szabo A. Intrinsic Rates and Activation Free Energies from Single-Molecule Pulling Experiments. Phys Rev Lett 2006;96:108101.
- [37] Duan L, Zhmurov A, Barsegov V, Dima RI. Exploring the Mechanical Stability of the C2 Domains in Human Synaptotagmin 1. J Phys Chem B 2011;115:10133-10146.
- [38] Hu J, Lipowsky R, Weikl TR. Binding constants of membrane-anchored receptors and ligands depend strongly on the nanoscale roughness of membranes. Proc Natl Acad Sci USA 2013;110:15283-15288.
Tables and figures
| protocol and pathway | [/Å] | [/Å] | [Å] | [1/ ] | # trajectories |
|---|---|---|---|---|---|
| N-N′ pathway 1 | 0.083 | 2.66 | 3.6 | 373 | |
| N-N′ pathway 2 | 0.089 | 1.96 | 3.4 | 92 | |
| N-C′ pathway 1 | 0.089 | 2.23 | 3.4 | 398 | |
| N-C′ pathway 2 | N/A | N/A | N/A | N/A | 67 |
| C-N′ | 0.061 | 1.74 | 4.9 | 420 | |
| C-C′ | 0.093 | 2.52 | 3.2 | 420 | |
| N-C pathway 1 | 0.071 | 2.20 | 4.2 | 231 | |
| N-C pathway 2 | 0.075 | 2.43 | 4.0 | 239 |


Supporting Information
This section contains four figures that support results reported in ”Unbinding and unfolding of adhesion protein complexes through stretching: interplay between shear and tensile mechanical clamps” by Bartosz Różycki, Łukasz Mioduszewski and Marek Cieplak