P-MaNGA: Gradients in Recent Star Formation Histories as Diagnostics for Galaxy Growth and Death
Abstract
We present an analysis of the data produced by the MaNGA prototype run (P-MaNGA), aiming to test how the radial gradients in recent star formation histories, as indicated by the 4000Å-break (Dn(4000)), H absorption (EW(HA)) and H emission (EW(H)) indices, can be useful for understanding disk growth and star formation cessation in local galaxies. We classify 12 galaxies observed on two P-MaNGA plates as either centrally quiescent (CQ) or centrally star-forming (CSF), according to whether Dn(4000) measured in the central spaxel of each datacube exceeds 1.6. For each spaxel we generate both 2D maps and radial profiles of Dn(4000), EW(HA) and EW(H). We find that CSF galaxies generally show very weak or no radial variation in these diagnostics. In contrast, CQ galaxies present significant radial gradients, in the sense that Dn(4000) decreases, while both EW(HA) and EW(H) increase from the galactic center outward. The outer regions of the galaxies show greater scatter on diagrams relating the three parameters than their central parts. In particular, the clear separation between centrally-measured quiescent and star-forming galaxies in these diagnostic planes is largely filled in by the outer parts of galaxies whose global colors place them in the green valley, supporting the idea that the green valley represents a transition between blue-cloud and red-sequence phases, at least in our small sample. These results are consistent with a picture in which the cessation of star formation propagates from the center of a galaxy outwards as it moves to the red sequence.
Subject headings:
galaxies:general – galaxies:stellar content – galaxies:formation – galaxies:evolution – surveys:galaxies – methods:observational1. Introduction
Our understanding of galaxies in the local universe has improved dramatically over the past decade, in significant part due to large optical spectroscopic surveys such as the Two-degree Field Galaxy Redshift Survey (2dFGRS; Colless et al., 2001) and the Sloan Digital Sky Survey (SDSS; York et al., 2000). One of the major findings of the SDSS is the discovery of ‘galaxy bimodality’, through which local galaxies are divided into two distinct populations, termed ‘red sequence’ and ‘blue cloud’, according to their rest-frame colors or specific star formation rate (e.g. Strateva et al., 2001; Blanton et al., 2003; Kauffmann et al., 2003a; Baldry et al., 2004). Red-sequence galaxies typically present bulge-dominated morphology, red optical/UV color, and little gas and star formation, while blue-cloud galaxies are usually gas-rich with blue colors, ongoing star formation and disky morphology. The smaller number of galaxies found lying in the ‘green valley’ between these two main populations in color space are widely believed to be caught in a transition phase from the blue cloud to the red sequence (e.g. Bell et al., 2004; Faber et al., 2007; Martin et al., 2007; Schawinski et al., 2007; Schiminovich et al., 2007; Wyder et al., 2007; Mendez et al., 2011; Gonçalves et al., 2012), although this picture has recently been disputed by some authors (e.g. Schawinski et al., 2014). Narrow-field deep surveys reveal that this color bimodality persists out to redshift of at least (e.g. Bell et al., 2004; Bundy et al., 2006; Cirasuolo et al., 2007; Cooper et al., 2008; Faber et al., 2007; Martin et al., 2007; Cowie & Barger, 2008; Brammer et al., 2009; Williams et al., 2009; Muzzin et al., 2012; Huang et al., 2013a), though the prevalence of the red population has significantly increased since a redshift of unity (Bell et al., 2004; Bundy et al., 2006; Faber et al., 2007). The cessation of star formation is thus an important process which has been contributing to galaxy evolution over the past .
A complete picture of the way in which the star formation in galaxies gets shut down remains elusive. However, recent studies of the scaling relations of galaxy properties and their dependence on local environment have clearly established that, in addition to stellar mass, both internal structural properties and external environment are key indicators, or may even be drivers, of the star formation cessation processes in galaxies (e.g. Kauffmann et al., 2006; Bell, 2008; Franx et al., 2008; Peng et al., 2010; Thomas et al., 2010; Bell et al., 2012; Cheung et al., 2012; Fabello et al., 2012; Li et al., 2012b; Fang et al., 2013; Mendel et al., 2013; Zhang et al., 2013). For instance, when studying the central galaxies in groups or clusters, the presence of a prominent bulge-like structure is found to be a necessary (but not sufficient) condition for stopping star formation (Bell, 2008; Bell et al., 2012; Cheung et al., 2012; Fang et al., 2013). In addition, studies of the relationship between galaxy morphology and color have revealed a significant population of red-sequence galaxies with disc-dominated spirals at both low-z (e.g. Wolf et al., 2005, 2009; Bamford et al., 2009; Masters et al., 2010) and (e.g. Bundy et al., 2010), which are preferentially found in galaxies with large bulges (Bundy et al., 2010; Masters et al., 2010). These findings support the ‘morphological quenching’ mechanism proposed by Martig et al. (2009), although studies of cold gas in massive galaxies indicate that a reduction in gas content is also required (e.g. Fabello et al., 2011). For central galaxies in massive dark matter halos above a critical mass of , “radio-mode” AGN feedback and shock-heating may effectively reduce the gas cooling efficiency, thus also playing an important role in preventing further star formation (Silk, 1977; Rees & Ostriker, 1977; Blumenthal et al., 1984; Birnboim & Dekel, 2003; Kereš et al., 2005; Dekel & Birnboim, 2006; Cattaneo et al., 2006). Powerful AGN feedback can also happen in the so-called “quasar mode”, which is predicted to be triggered by major mergers of gas-rich galaxies with comparable mass (e.g. Di Matteo et al., 2005; Hopkins et al., 2006), and is commonly adopted as one of the quenching processes in semi-analytic models.
For satellite galaxies, star formation quenching seems to be driven primarily by external processes occurring within their host group/cluster, such as gas stripping by ram-pressure (Gunn & Gott, 1972; Abadi et al., 1999) and tidal interactions (Toomre & Toomre, 1972; Moore et al., 1996). The ‘smoking gun’ of observations showing Hi gas being removed by ram-pressure stripping have been obtained for spirals in nearby clusters of galaxies (e.g. Vogt et al., 2004; Chung et al., 2009; Merluzzi et al., 2013). Studies of color profiles and surface brightness profiles for satellite galaxies in SDSS group systems prefer more gentle processes such as “starvation” or “strangulation” (e.g. Weinmann et al., 2009). On the other hand, a recent study of the specific star formation rate–stellar mass relation for galaxy groups/clusters at higher redshift (, Lin et al. 2014) suggests that galaxy mergers play a primary role in quenching satellites in galaxy groups, while strangulation is a process more important in cluster-scale environment. There have also been statistical studies of the cold gas content and star formation in galaxies residing in different environments, using either direct atomic gas mass measurements from large blind surveys of Hi emission such as the Hi Parkes All Sky Survey (HIPASS; Zwaan et al., 2005) and the Arecibo Legacy Fast ALFA (ALFALFA; Giovanelli et al., 2005) survey, or indirect estimates of gas content from the optical photometry in surveys like SDSS (e.g. Li et al., 2012b; Zhang et al., 2013). These studies have revealed that gas-related quenching depends not only on the stellar mass of the satellite galaxies, but also on their surface mass density.
A full understanding of star formation cessation in galaxies thus requires spatially-resolved measurements of stellar and gaseous components to be obtained for a large sample of galaxies covering wide ranges in mass and color, probing a range of environmental conditions. Previous studies for this purpose have been mainly based on multi-wavelength broadband photometry, for both nearby galaxies (e.g. de Jong, 1996; Bell & de Jong, 2000; Taylor, 2005; Muñoz-Mateos et al., 2007; Zibetti et al., 2009; Roche et al., 2010; Suh et al., 2010; Tortora et al., 2010; Gonzalez-Perez et al., 2011; Tortora et al., 2011; Kauffmann, 2015) and those at high redshifts (e.g. Abraham et al., 1999; Azzollini et al., 2009; Szomoru et al., 2012; Wuyts et al., 2012; Szomoru et al., 2013; Wuyts et al., 2013), while some authors also made use of long-slit spectroscopy (e.g. Moran et al., 2012; Huang et al., 2013b). Significant improvements have been made in the past decade, thanks to many integral field unit (IFU) surveys which have obtained spatially resolved spectroscopy for samples of galaxies. However, to-date, the samples have been relatively small ( galaxies): SAURON (Bacon et al., 2001), DiskMass (Bershady et al., 2010), ATLAS (Cappellari et al., 2011).
The ongoing CALIFA survey (Calar Alto Large Integral Field Area Sánchez et al., 2012a) is observing a sample of 600 galaxies, making a big step forward in 2D spectroscopic studies of nearby galaxies. For example, this survey has, for the first time, quantified the spatially-resolved history of stellar mass assembly for galaxies beyond the Local Group, demonstrating how massive galaxies grow their stellar mass inside-out (Pérez et al., 2013). Such an inside-out picture of galaxy formation is supported by further measurements of gradients in oxygen abundance of Hii regions (Sánchez et al., 2014), in stellar metallicity of face-on spirals (Sánchez-Blázquez et al., 2014), and in stellar age and local surface mass density of galaxies of different morphologies and masses (González Delgado et al., 2014), all from the CALIFA survey. However, the sample is still relatively modest, limiting the range of environments and galaxy properties that can be explored. The more recently launched SAMI survey (Croom et al., 2012) takes a further step with a goal of obtaining IFU observations for 3400 galaxies by 2016. In the meantime, the KMOS3D Survey is pushing forward the IFU observations for high redshift galaxies, observing a sample of 600 galaxies at using KMOS at the Very Large Telescope (Wisnioski et al., 2015).
As a next step at low-z, the study of these phenomena is a key goal of the upcoming MaNGA (Mapping Nearby Galaxies at Apache Point Observatory, Bundy et al., 2015) survey. As one of the major programs of the fourth-generation of SDSS, MaNGA will obtain two-dimensional, integral-field spectroscopy (IFS) for 10,000 galaxies in the nearby redshift range , optimally selected for uniform coverage and resolution using the single (central) spectra from SDSS. Each galaxy will be spectroscopically observed with an IFU to obtain multiple high signal-to-noise ratio (S/N) spectra across the full optical wavelength range from 3600 to 10300Å. MaNGA will thus provide 2D maps of stellar populations and recent star formation histories for a large number of quiescent and star-forming galaxies, thus enabling extensive exploration of the various processes by which star formation ceases in the local universe.
In this paper, to assess the potential use of the MaNGA survey in studying the cessation of star formation, and to derive some initial results in this area, we present an analysis of the MaNGA prototype (P-MaNGA) data for a set of 12 galaxies, which were observed in the pilot run in 2012 December and 2013 January. These observations were made through time granted by the Sloan Digital Sky Survey-III (SDSS-III, Eisenstein et al., 2011). The prototype data are described in more detail in Bundy et al. (2015), which also provides a general overview of the MaNGA project.
For each of the P-MaNGA galaxies and for each spectrum in the associated data cube, we have performed full spectral fitting using the methodology developed in Li et al. (2005), in order to separate out emission line components from the underlying absorption-line stellar spectrum. From these decomposed spectra, we have obtained full 2D maps of three key parameters—Dn(4000) (the depth of the 4000Å break), EW(HA) (the equivalent width of the H absorption line) and H (the equivalent width of the H emission line)—which are known to be sensitive indicators of stellar populations of different ages (Kauffmann et al., 2003b; Kauffmann, 2014). We then investigate any radial variations in the recent star formation histories of the galaxies by plotting the values of these parameters for different subregions of each galaxy, to see how they change with position. As we will show, the P-MaNGA sample, though small in size, reveals intriguing systematic trends in the three diagnostic parameters across these galaxies, demonstrating the potential for using MaNGA (and similar IFU surveys) to understand disk growth and star formation cessation in local galaxies.
Throughout this paper we assume a cold dark matter cosmology model with , and . A Chabrier (2003) stellar initial mass function (IMF) is adopted.
2. Data
2.1. P-MaNGA Observations
| Bundle_Field | P-MaNGA | mangaID | IAU Name | type | ||||||
|---|---|---|---|---|---|---|---|---|---|---|
| Name | mag | mag | ” | () | ||||||
| Field 9: PlateID = 6650, 3.0 hr, seeing 17 | ||||||||||
| ma003_9 | p9-127A | 8-188794 | J093457.30+214220.9 | 0.013 | 10.7 | -21.3 | 0.70 | 23.7 | 0.7 | |
| ma008_9 | p9-127B | 8-131835 | J093506.31+213739.5 | 0.013 | 9.1 | -18.5 | 0.51 | 6.8 | 1 | 2.4 |
| ma002_9 | p9-61A | 8-188807 | J093712.30+214005.0 | 0.019 | 10.1 | -20.5 | 1.30 | 9.3 | 1.2 | |
| ma005_9 | p9-19B | 8-131893 | J093109.60+224447.4 | 0.051 | 10.6 | -22.2 | 0.86 | 4.0 | 1 | 1.6 |
| ma007_9 | p9-19D | 8-131577 | J093109.07+205500.5 | 0.034 | 10.3 | -21.2 | 0.79 | 3.2 | 1 | 2.0 |
| ma001_9 | p9-19E | 8-131821 | J094030.22+211513.7 | 0.024 | 9.7 | -20.0 | 0.73 | 2.9 | 1 | 2.2 |
| Field 4: PlateID = 6652, 2.0 hr, seeing 13 | ||||||||||
| ma003_4 | p4-127A | 8-109661 | J105555.26+365141.4 | 0.022 | 10.7 | -22.1 | 0.84 | 10.3 | 1.6 | |
| ma008_4 | p4-127B | 8-109682 | J105259.05+373648.2 | 0.042 | 11.0 | -22.7 | 0.77 | 13.9 | 1.2 | |
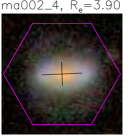
| ma002_4 | p4-61A | 8-113576 | J105746.61+361657.8 | 0.030 | 9.7 | -20.0 | 0.71 | 3.4 | 3.4 | |
| ma004_4 | p4-19A | 8-113557 | J110012.10+362313.8 | 0.027 | 9.4 | -19.5 | 0.49 | 2.5 | 1 | 2.5 |
| ma005_4 | p4-19B | 8-113506 | J104958.69+362454.0 | 0.023 | 9.5 | -19.5 | 0.53 | 4.6 | 1 | 1.4 |
| ma006_4 | p4-19C | 8-109657 | J105605.68+365736.1 | 0.022 | 9.5 | -19.4 | 0.72 | 4.8 | 1 | 1.3 |
Note. — The P-MaNGA Name is composed of a “p” for “prototype” followed by the field ID, a hyphen, and then the shorthand ID for the bundle used. This shorthand includes a number corresponding to NIFU for that bundle. The () magnitude is extinction-corrected.
† Target type 1 indicates the galaxy would be selected in the MaNGA Survey’s Primary Sample. These galaxies often have spatial coverage to larger than 1.5 due to the different bundle size distribution used in P-MaNGA. A “” indicates a galaxy that was chosen by hand for the prototype run and does not pass the nominal selection criteria.
In the present work, we use data obtained using the MaNGA engineering prototype instrument (hereafter P-MaNGA) in 2013 January. P-MaNGA was designed to explore a variety of instrument design options, observing strategies, and data processing algorithms. These P-MaNGA data offer valuable insights into MaNGA’s potential, but differ substantially from the MaNGA survey data in several ways. First, P-MaNGA used just one of the two BOSS spectrographs, with only 560 total fibers and 8 IFUs with three sizes: 19 fibers (N19), 61 fibers (N61), and 127 fibers (N127). The P-MaNGA IFU complement was dramatically different from the MaNGA survey instrument, with N19 (instead of just two), N61 (instead of 4), N127 (instead of five), and no 37-fiber or 91-fiber IFUs (see Drory et al., 2015, for detailed description of MaNGA instrumentation). Finally, we also note that the masses and sizes of the P-MaNGA target galaxies were not selected to be representative of the full MaNGA sample.
P-MaNGA observations were obtained of three galaxy fields (Field 9, 11, 4) using SDSS plates 6650, 6651, and 6652, each containing 6 galaxies. Some of the P-MaNGA targets were drawn from early versions of the full MaNGA sample (Wake et al., in prep), but in many cases P-MaNGA targets were chosen for specific reasons. In each of the three plates, one N127 IFU was allocated for comparison purposes to a galaxy observed by the CALIFA survey (Sánchez et al., 2012b), even if the galaxy would not otherwise satisfy the MaNGA selection cuts. Additionally, the non-optimal IFU complement of the P-MaNGA instrument required some targets to be selected manually. For each plate, observations were obtained in sets of three 20-minute exposures, which were dithered by approximately a fiber radius along the vertices of an equilateral triangle to provide uniform coverage across each IFU. These three plates were observed to varying depths and in varying conditions, as required by the P-MaNGA engineering tasks. Although plate 6650 (Field 9) was observed to a depth comparable to what will be regularly achieved during MaNGA operations, plates 6651 (Field 11) and 6652 (Field 4) are both significantly shallower than MaNGA survey data, and plate 6651 was intentionally observed at high airmass () resulting in particularly poor image quality. In this paper we use data obtained with plates 6650 and 6652 (see Table 1), while excluding plate 6651.
The raw data were reduced using a prototype of the MaNGA Data Reduction Pipeline (DRP), which is described in detail by Law et al. (2015). In brief, individual fiber flux and inverse variance spectra were extracted using a row-by-row algorithm, wavelength calibration was obtained from a series of Neon-Mercury-Cadmium arc lines, and the spectra were flatfielded using internal quartz calibration lamps. Sky-subtraction of the IFU fiber spectra was performed by constructing a cubic basis spline model of the sky background flux as seen by the 41 individual fibers placed on blank regions of sky, and subtracting the resulting composite spectrum shifted to the wavelength solution of each IFU fiber.
Flux calibration of the P-MaNGA data is performed by fitting Kurucz model stellar spectra to the spectra of calibration standard stars covered with single fibers at each of the three dither positions. The flux calibration vectors derived from these single-fiber spectra were found to vary by 10% from exposure to exposure, depending on the amount of light lost from the fiber due to atmospheric seeing and astrometric misalignments. While this uncertainty is acceptable for the present science purposes, the flux calibration uncertainty of the single fibers ultimately drove the design decision of the MaNGA survey to instead use 7-fiber IFU “mini-bundles” for each calibration standard star, which results in a few percent photometric uncertainty (see Yan et al., 2015).
Flux-calibrated spectra from the blue and red cameras were combined across the dichroic break using an inverse-variance weighted basis spline function. Astrometric solutions were derived for each individual fiber spectrum that incorporate information about the IFU bundle metrology (i.e., fiber location within an IFU), dithering, and atmospheric chromatic differential refraction, among other effects. Fiber spectra from all exposures for a given galaxy were then combined into a single datacube (and corresponding inverse variance array) using these astrometric solutions and a nearest-neighbor sampling algorithm similar to that used by the CALIFA survey. For the P-MaNGA datacubes, a spaxel size of 05 was chosen. The typical effective spatial resolution in the reconstructed datacubes can be described by a Gaussian with a full width at half maximum 5. When binning the datacubes, we scale the resulting error vectors to account, at least approximately, for wavelength and spatial covariance in the P-MaNGA error cubes.
2.2. SDSS-I perspective of the P-MaNGA galaxies
All our galaxies have photometry in the SDSS-I five bands, as well as archival spectroscopy from the SDSS-I 30-diameter fiber. Figures 1 and 2 show the properties of this sample based on the SDSS data. With these two figures we aim to show how our galaxies compare to the larger SDSS-I sample from which they are drawn.
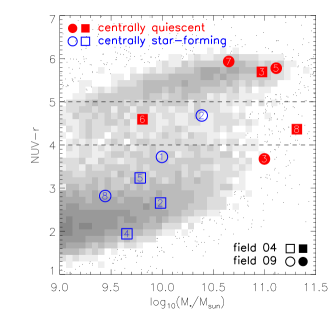
Figure 1 presents the galaxies on the plane of stellar mass versus NUV color and the BPT diagram (Baldwin et al., 1981). We use estimates of stellar mass and NUV from the New York University Value-Added Galaxy Catalog (NYU-VAGC111http://sdss.physics.nyu.edu/vagc/; Blanton et al., 2005a) and NASA Sloan Atlas (NSA)222http://www.nsatlas.org. NSA is a catalog of images and parameters of local galaxies based on data from SDSS (York et al., 2000), GALEX (Martin et al., 2005) and 2MASS (Skrutskie et al., 2006); for details see Blanton et al. (2005b, a, 2011). The stellar mass for each galaxy is estimated based on its spectroscopically-measured redshift and the five-band Petrosian magnitudes from SDSS photometric data, as described in detail in Blanton & Roweis (2007). The NUV color is defined by the integrated light in the NUV-band from GALEX and the Petrosian magnitude in the -band from SDSS, both corrected for Galactic extinction. Measurements of the emission line ratios for the BPT diagram are taken from the MPA/JHU SDSS database 333http://www.mpa-garching.mpg.de/SDSS/DR7/ (Brinchmann et al., 2004).
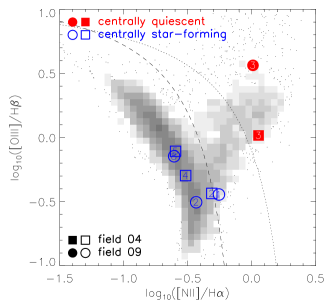
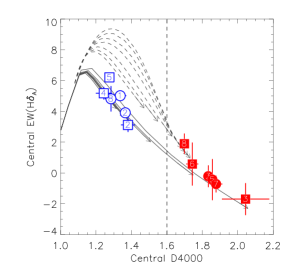
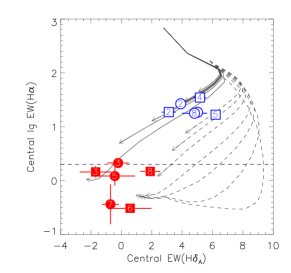
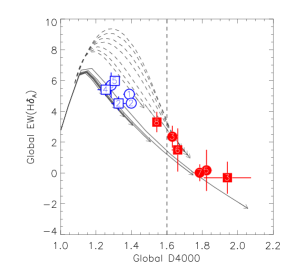
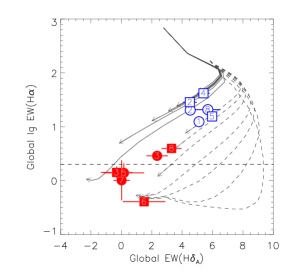
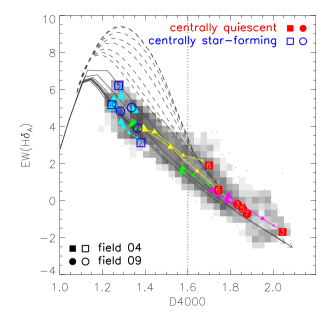
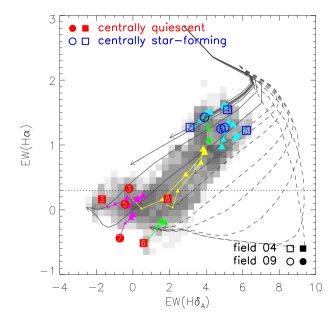
Figure 2 displays the galaxies in the Dn(4000) versus EW(HA) and EW(HA) versus EW(H) planes, where Dn(4000) is the 4000Å break in the optical spectrum as defined by Balogh et al. (1999), EW(HA) the Lick/IDS index of the H absorption line defined by Worthey & Ottaviani (1997), and EW(H) the logarithm of H emission line equivalent width. We use measurements of these parameters from the MPA/JHU database, which were obtained from the SDSS 30-diameter spectra, thus probing the central – for the P-MaNGA galaxies.
In both these figures, we use squares and circles for galaxies in Fields 4 and 9 respectively, and label each galaxy by the BundleID used in those fields. We divide these galaxies into two subsets according to the 4000Å break in the central spaxel of their datacube (see § 2.3): centrally quiescent (CQ) with Dn(4000) and centrally star-forming (CSF) with Dn(4000). The two subsets are highlighted in the figures with red solid and blue open symbols respectively. We will use the same symbols and colors for subsequent figures unless otherwise stated. For comparison, we have selected a volume-limited sample of 21,328 galaxies with stellar mass above M⊙ and redshift in the range from the NSA. Distributions of this sample are plotted in gray-scale maps in Figures 1 and 2.
As can be seen from Figure 1, the P-MaNGA sample (though small in size) spans a wide range in both the color–mass and BPT diagrams, similar to that of the general population. In the literature, galaxies are usually classified into three types according to their NUV color: red-sequence (NUV ), green-valley ( NUV ) and blue-cloud (NUV ). Accordingly, half of the sample galaxies fall in the blue-cloud region, indicative of ongoing star formation and relatively rich cold gas content. For all the galaxies except ma002_9 and ma003_9, the color-based classification and the Dn(4000)-based classification are consistent with each other, in the sense that the blue-cloud galaxies are centrally star forming, while the objects in the green valley and red sequence combine to form the centrally-quiescent galaxy class. This result indicates that green-valley and red-sequence galaxies share similar properties in their central regions, and that their different global color can be mainly attributed to the different stellar population and gas content in their outer parts.
One of the two exceptions, ma003_9, is a strong Seyfert-type AGN according to its location in the BPT diagram, and is an outlier in the color–mass diagram due to its relatively blue color at its stellar mass. As shown below, this galaxy presents a red core and a blue outer disk in the optical image, such that its classification would be more reasonable if the measurement of NUV color were confined to its central region. The strong contradiction between the central and global classification in this case highlights the importance of spatially-resolved measurements. The other exception, ma002_9, is a dusty, inclined spiral. It is a centrally star-forming galaxy according to its small value of Dn(4000), but is classified as a green-valley galaxy based on the relatively red NUV color, which in this case is likely caused by dust.
The Dn(4000) and HA indices are known to be indicators of the recent star formation history of galaxies, with Dn(4000) being a good proxy for the luminosity-weighted stellar age, and HA a sensitive tracer of the star formation that occurred 0.1 – ago (Bruzual & Charlot, 2003, hereafter BC03). As shown in Kauffmann et al. (2003b), the location of a galaxy in the plane of Dn(4000) and HA provides a powerful diagnostic of whether the galaxy has experienced a continuous star formation history or bursts over the past 1 – . This property is illustrated in the left-hand panel of Figure 2, where we present the Dn(4000) and HA indices for the BC03 models of solar metallicity that follow exponentially declining star formation histories (), either continuous star formation decline with long e-folding times (yr, solid lines), or bursts of star formation with fairly short e-folding times (yr, dashed lines). Different colors indicate the adopted values of the characteristic timescale . The right-hand panel presents the same sets of models on the HA index versus EW(H) plane. The H luminosity is computed from the output of the BC03 models. We convert Lyman continuum photons to H photons following Hunter & Elmegreen (2004, see equations B2-B4 in their appendix). We take the recombination coefficients and H/H ratios from Hummer & Storey (1987). For the LMC, solar, and super-solar metallicity models we assume nebular temperatures of 15,000 K, 10,000 K, 5000 K respectively. The P-MaNGA galaxies occupy roughly the same region as the general population in both panels, with the CSF galaxies located in the low-Dn(4000) and high-HA region and the CQ galaxies in the opposite corner. It is, however, notable that the P-MaNGA sample lacks galaxies of intermediate values in these indices, and consequently the current sample is somewhat biased to a more bimodal distribution on both planes compared to the full population of SDSS galaxies.
In the rest of this paper we will use the Dn(4000)–EW(HA) and EW(HA)–EW(H) planes to investigate the maps and radial profiles of recent star formation histories of the P-MaNGA galaxies. In this case we use relative measurements of the three indices as indicators of recent star formation history, but we do not present quantitative measurements of mean stellar age, which depends on the sensitivity of these indices to stellar metallicity, element abundance and dust attenuation (e.g. Worthey & Ottaviani, 1997; Bruzual & Charlot, 2003; Thomas et al., 2004; Thomas & Davies, 2006; Sánchez et al., 2012a). In a parallel paper (Wilkinson et al., 2015) we attempt to simultaneously obtain the stellar age, metallicity and dust content for the P-MaNGA galaxies, by fitting stellar population models to the full spectrum. In addition, in the present paper we assume that H emission is just a signature of recent star formation. However, EW(H) lower than 6Å was found to be more compatible with light from post-AGB stars (Papaderos et al., 2013; Sarzi et al., 2013). One should keep these caveats in mind when interpreting the observational results presented in this paper.
2.3. Spectral fitting
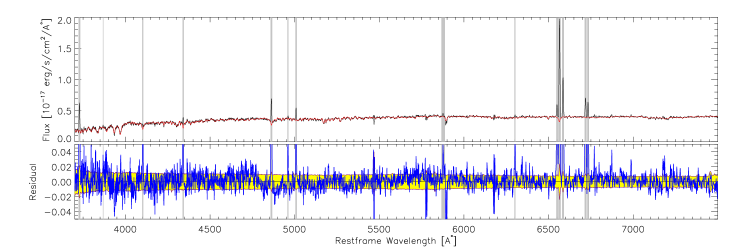
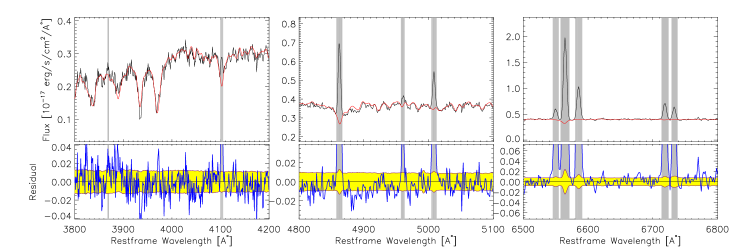
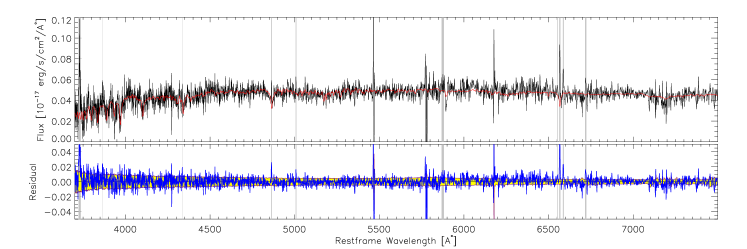
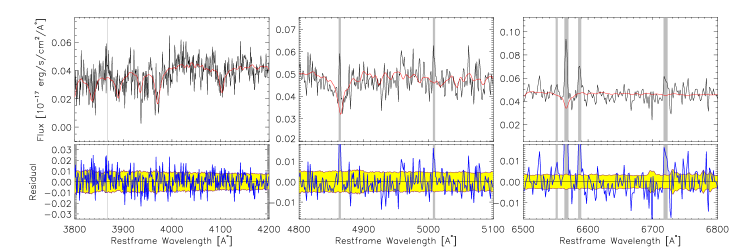
For each spectrum in the datacubes generated as described in §2.1, we have performed a decomposition of the emission-line component and the continuum plus absorption-line component (hereafter called the ‘stellar component’), using both the public spectral fitting code STARLIGHT (Cid Fernandes et al., 2004) and our own code described in Li et al. (2005). We have carefully masked out the emission-line regions when doing the spectral fitting. Figure 3 displays the results of this procedure when applied to two representative spectra from the MaNGA datacubes, one with a high signal-to-noise ratio () at 5500Å in the continuum and one with a more modest .
We measure the Dn(4000) and HA indices from each best-fit spectrum, defining the indices in the same way as in the previous subsection. We have also measured the flux and equivalent width of the emission lines (both Balmer and forbidden) by fitting a Gaussian profile to these lines in the stellar component-subtracted spectrum. The emission-line parameters from STARLIGHT were compared to those obtained from our code. We have also performed the same procedure of spectral fitting and parameter measuring on Voronoi-binned versions of the datacubes to assess the effects of spatial averaging before fitting. All these analyses were found to return indistinguishable results, and so in what follows we will only present the values we obtain when applying our code to the unbinned datacubes.
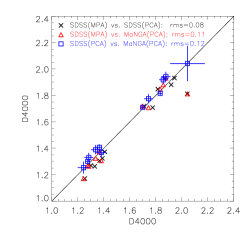
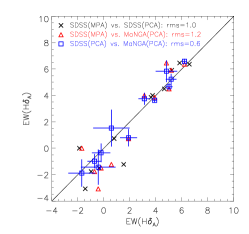
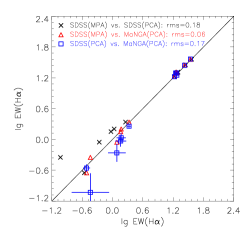
We have also applied our code to the archival SDSS spectra of the centers of the P-MaNGA galaxies, and in Figure 4 we compare the resulting measurements of Dn(4000), EW(HA) and EW(H) to those obtained from the central spaxel of the P-MaNGA datacubes (plotted as blue squares in the figure). In the same figure, we also compare our measurements, from both SDSS (black crosses) and the central spaxel of P-MaNGA datacubes (red triangles) with the measurements taken from the MPA/JHU database. Overall, the values from different observations and pipelines agree well with each other. We have visually examined the best-fit spectrum for the few outliers, and find that our code provides a reasonably good fit to both SDSS and P-MaNGA spectra even in these cases. The relatively large discrepancy in one of the outliers (the blue square and black cross located in the left-bottom corner in the right-hand panel) is caused by the bad data pixels over the H band in the SDSS spectrum.
We note that, when fitting the spectra and measuring the diagnostic parameters, we do not take into account the covariance between wavelengths, nor the covariance between pixels. Methods for tracking such covariances have been studied in depth (e.g. Sharp et al., 2015, for the SAMI survey). As pointed out in Wilkinson et al. (2015), when compared to P-MaNGA, MaNGA will provide more accurately estimated spectral errors (thus accurate error propagation through to the final datacubes), allowing construction of covariances between pixels. We will apply a detailed treatment of covariance in MaNGA data in future work.
3. Results
3.1. Global versus central parameters
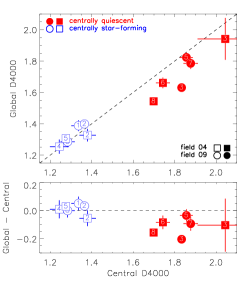
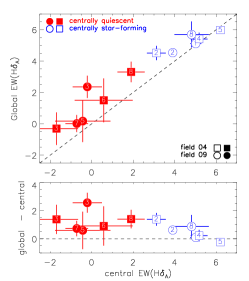
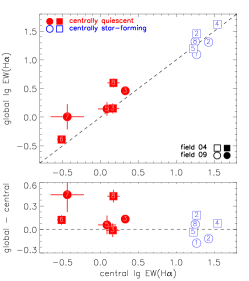
Before investigating the spatially-resolved properties of these galaxies’ star-formation histories, we take a first look at any spatial variations by comparing the central values of the diagnostic parameters to their integrated values across the field of view. To this end, we generated a global spectrum for each galaxy by stacking the entire datacube, with each spaxel at given wavelength being weighted by following Cappellari & Copin (2003), where is the signal-to-noise ratio at 5500Å in the continuum. Spaxels with were excluded from the stacking. We then measure the diagnostic parameters Dn(4000), EW(HA) and EW(H) in the same manner as above. Figure 5 compares the global measurements to the same parameters obtained from the central spaxel of the galaxies. For CSF galaxies, the global parameters differ little from the central ones. In contrast, however, most of the CQ galaxies show significant difference between central and global parameters, with smaller Dn(4000) and larger EW(HA) and EW(H) in the latter. This result implies that the outer regions of CQ galaxies contain younger stellar populations and have therefore experienced more recent star formation than their inner parts. The difference in EW(H) is relatively weak compared to the other two parameters, suggesting that the central-to-global variation may be mainly driven by the radial variation in recent star formation history, but not the current star formation rate. It may also be the case that H is not a reliable tracer of star formation in galaxies dominated by older stellar populations (see § 4).
A comparison of the global parameters with the central parameters on the diagnostic diagrams of recent star formation history is shown in Figure 6, where we plot the galaxies on the Dn(4000)-EW(HA) and EW(HA)-EW(H) planes, using the central and global parameters for the upper and lower panels, respectively. Comparing the upper and lower panels, we identify two noticeable effects. First, the gap between the CSF and CQ galaxies as seen in the upper panels is largely filled in the lower panels, and this in-fill is made up exclusively of CQ galaxies due to the broad scatter in their global values of Dn(4000) and EW(HA). Second, when globally measured, both the CSF galaxies and the CQ galaxies appear to deviate from the continuous star-formation models, moving by varying degrees toward the regime of recent bursts.
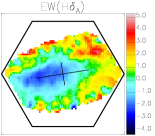
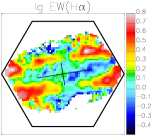
3.2. 2D Maps and radial profiles
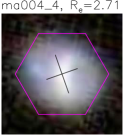
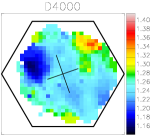
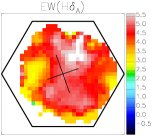
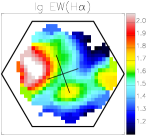
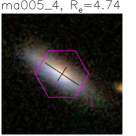
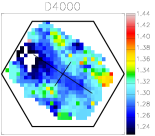
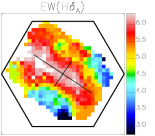
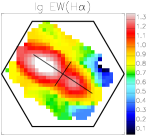
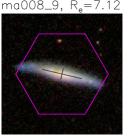
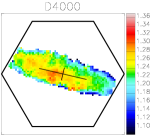
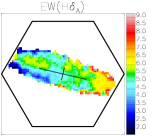
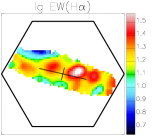
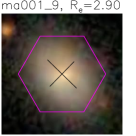
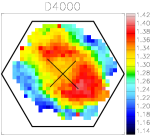
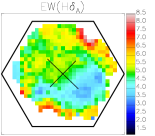
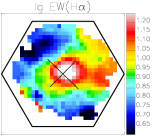
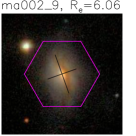
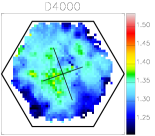
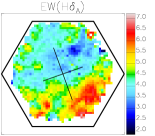
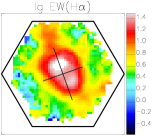
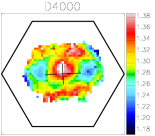
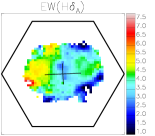
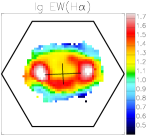
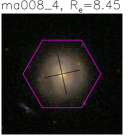
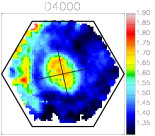
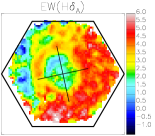
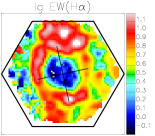
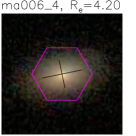
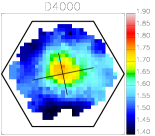
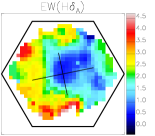
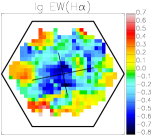
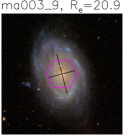
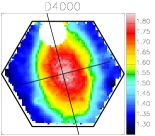
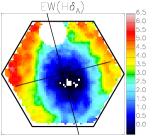
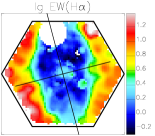
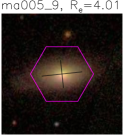
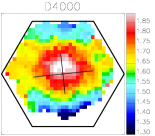
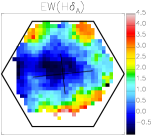
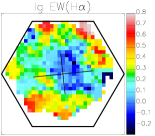
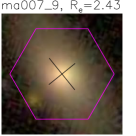
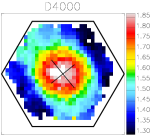
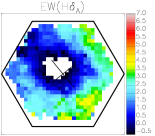
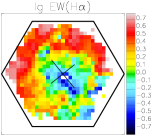
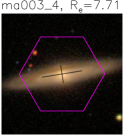
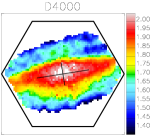
In Figures 7 and 8 we present the 2D maps of the three diagnostic parameters, Dn(4000), EW(HA) and EW(H), for all the 12 galaxies in the sample, with the CSF galaxies in one figure and the CQ galaxies in the other. In each case, the galaxies have been ordered such that the central values of Dn(4000), as measured from the central spaxel of the datacubes, increases from left to right. The SDSS image is also shown for each galaxy. The effective radius, length and direction of major and minor axes are indicated in the images and maps. When generating the maps, we only employ spaxels where the S/N in the continuum at 5500Å is greater than three.
Consistent with what was found from the global measurements in the previous subsection, the overall impression from the 2D maps is that all the galaxies show variation within the probed radius in all three parameters, but to varying degrees and differing radial extents, with the variations more pronounced in the CQ galaxies. As noted above in §2.2, galaxy ma003_9 shows a blue outer disk in the optical image, which causes it to be classified as a blue-cloud galaxy in the color–mass diagram, although its red core suggests that this is intrinsically a CQ galaxy. In agreement with this interpretation, the galaxy shows strong contrast between the central and outer parts in the maps of all the three diagnostic parameters. Similar behavior is seen in galaxy ma008_4, the most massive galaxy in the P-MaNGA sample with , which is also a face-on spiral with a relatively blue outer disk (although less prominent than in ma003_9) and strong radial variation in the diagnostic parameters. The galaxy is classified as a green-valley galaxy on the color–mass diagram (see Figure 1) due to its intermediate color, NUV, which is unusually blue for its large stellar mass.
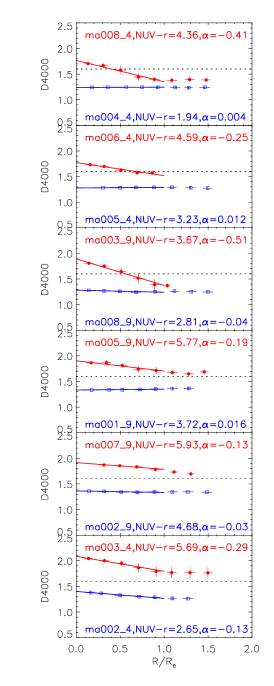
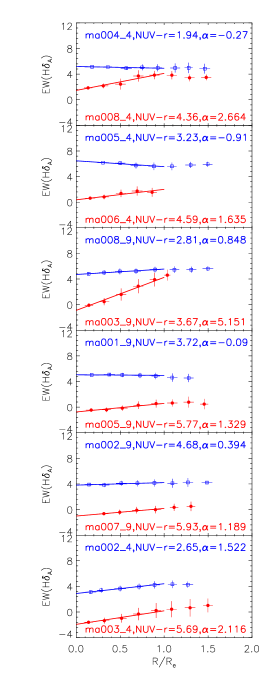
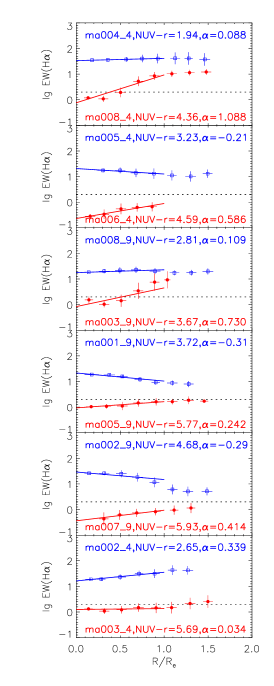
The radial variations of the galaxies are shown more clearly in Figure 9, where we plot the radial profiles of the three parameters for all 12 galaxies. To save space we display two galaxies in every panel, with one CSF galaxy (blue symbols) and one CQ galaxy (red symbols). This paired format also highlights the highly different behavior of the two broad classes. In constructing these profiles, we have corrected for the effects of inclination on the radius for each spaxel in the datacubes, using the minor-to-major axis ratio from NSA, as determined from the SDSS -band photometry. When estimating the radial profile, we bin all the spaxels with the continuum at 5500Å into a set of radial intervals with a constant width of , according to the deprojected radius of the spaxel () and the effective radius of the galaxy (). The value of the profile at given radius is then estimated by the median of the spaxels falling in the radial interval, and the error is given by the scatter between the spaxels.
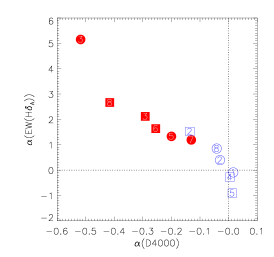
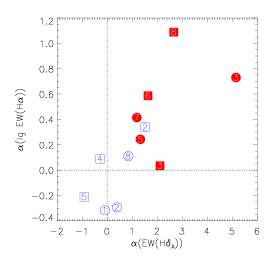
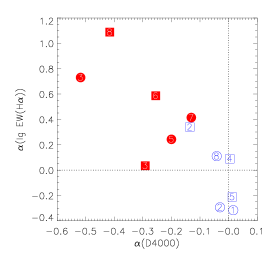
Figure 9 clearly shows that CQ galaxies generally present significant radial gradients in all the parameters, in the sense that the outer part of the galaxies show weaker Dn(4000) (thus a larger fraction of stellar populations with ages of ), stronger H absorption (thus more recent star formation in the past a few Myr), and stronger H emission (thus likely stronger ongoing star formation). In contrast, CSF galaxies possess quite flat profiles in all cases, revealing little by way of gradient in star-formation properties. At least out to , the radial profiles are close to linear for all the galaxies. For each galaxy we apply a linear fit to the radial profile within and show the best fit as a solid line in the figure. The slope of the best-fit line is indicated in each panel. Figure 10 compares the slope index for the three parameters, Dn(4000), EW(HA) and EW(H). These plots confirm that the radial gradients in the CSF galaxies are small, but also shows that the different parameters are well correlated across galaxies of both types. This correlation is particularly strong for Dn(4000) and EW(HA), which are beautifully (albeit non-linearly) correlated. However, given the small sample size, these apparent correlations should probably not be over-interpreted.
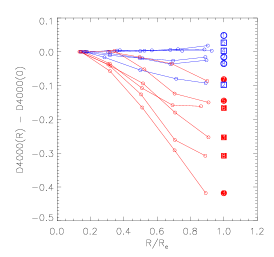
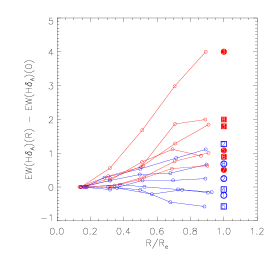
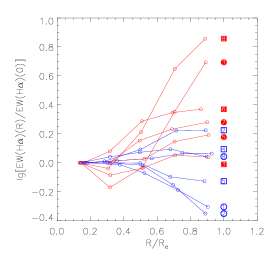
Figure 11 compares the slopes of the radial profiles in a different way, where we plot all the profiles in the same panel for a given parameter, normalizing each profile by the inner-most radial bin and scaling the radii by the effective radius. The differing behavior of the two classes of galaxies is striking. The CSF galaxies show only weak or no radial variation, while the CQ galaxies display steeper profiles, spanning a wide range in slope. It is, however, interesting to note that although the average properties of the two types differ dramatically, there is a degree of overlap between the classes in all panels, suggesting that a continuum of the same underlying physical processes has driven star formation in all these galaxies.
As indicated from the 2D maps, the galaxies with a blue outer disk (ma003_9 and ma008_4) indeed show the strongest radial variation in all parameters. These two galaxies manifest their peculiarity in the profile of EW(H), which is flat (for ma008_4) or even negative (for ma003_9) at , before rapidly increasing at larger radii. When compared to these two galaxies, the other CQ galaxies present much shallower profiles (though still steeper than that of CSF galaxies), with EW(H) increasing smoothly at and becoming flat at larger radii. The large values of EW(H) at large radii indicates that these two galaxies are strongly forming stars in their outer disks. This measurement is consistent with blue NUV color in these outer disks, which is known to be a sensitive indicator of the cold gas mass fraction in galaxies (e.g. Catinella et al., 2010; Li et al., 2012a).
The negative EW(H) profile at seen in ma003_9 is also found in ma003_4, and may be caused by the presence of a bulge or AGN in the galactic center. Indeed, according to the BPT diagram (Figure 1), the two galaxies are the only AGN candidates in the sample. It is likely that an AGN contributes to the H emission in the central region, thus enhancing the central EW(H) and leading to a dip in the profile as seen at . Interestingly, apart from this feature, the radial profiles of the two probably AGN hosts are similar to those of the other CQ galaxies, suggesting that current, low levels of AGN activity may not have a strong effect on recent star formation activity, at least for these two examples.
It is interesting to note that the three galaxies discussed above, ma003_9, ma008_4 and ma003_4, share a number of common properties: they are all spiral galaxies with a quiescent center, at the massive end of our sample with M∗M⊙, and showing the largest gradients in Dn(4000) indicative of young stellar populations formed within the past a few Gyr. They all share some properties with the population of “passive red spirals”, identified recently as an interesting set of possible transition objects with disk-like morphologies but red colors, at both low-z (e.g. Wolf et al., 2005, 2009; Bamford et al., 2009; Masters et al., 2010) and high-z (e.g. Bundy et al., 2010). Statistical analyses on a larger sample from MaNGA (or other IFU surveys) is needed in order to better understand the physical link between our galaxies and the passive/quiescent spiral population.
The 2D maps in Figures 7 and 8, as well as the radial profiles in Figures 9 and 11, are in broad agreement with maps/profiles of stellar population age estimated from both CALIFA (González Delgado et al., 2014) and P-MaNGA (Wilkinson et al., 2015), in the sense that most galaxies in the nearby universe show flat to negative gradients in stellar age, although in those studies the detailed behaviors of the age gradients depend on galaxy mass or morphology. In this work we only consider the dependence of our measurements on the Dn(4000)of the galactic center, which is an indicator of the prominence of stellar populations younger than 1-2 Gyr, rather than the mean stellar age as investigated in those studies. Despite these differences, the IFU-based results obtained so far are all consistent with the “inside-out” growth of galactic disks (White & Frenk, 1991; Mo et al., 1998), a picture that was supported previously by both numerical simulations (e.g. Brook et al., 2006) and abundant studies of broadband color gradients pioneered more than 50 years ago by Tifft (1963).
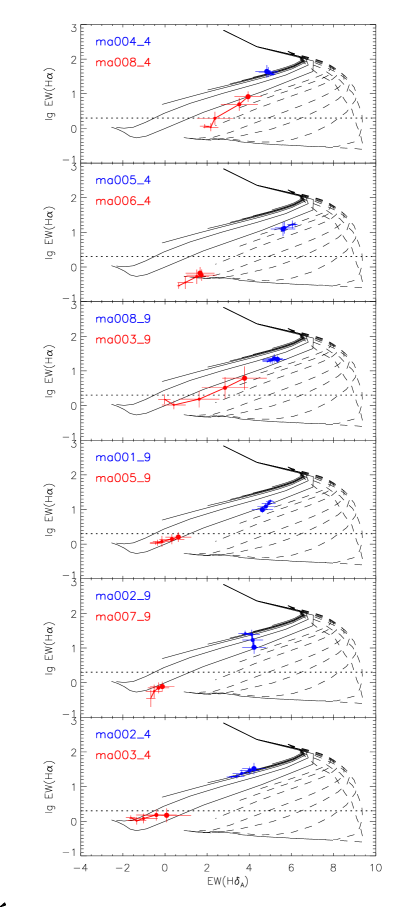
3.3. Diagnostic diagrams of recent star formation history
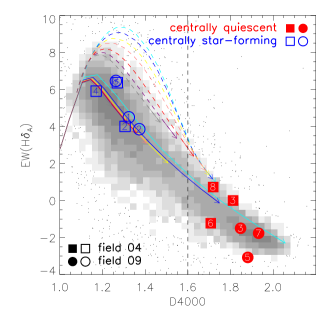
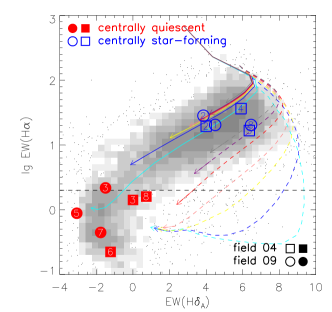
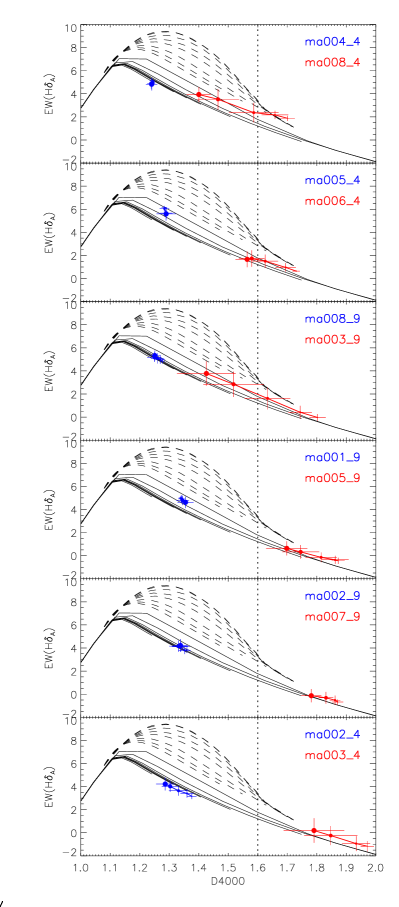
We now return to the comparison of diagnostic diagrams of recent star formation history, based on the radial profiles obtained in the previous subsection. Figure 12 presents the Dn(4000) vs. EW(HA) (left panels) and EW(HA) vs. EW(H) (right panels) planes, with each panel once again contrasting two galaxies, one CSF system (blue symbols) and one CQ system (red symbols). Panels are ordered such that Dn(4000) increases from top to bottom. For each galaxy, the radial profiles within the effective radius as shown in the previous figure are plotted here, with larger data points corresponding to larger radii. The set of BC03 models in Figure 6 are also repeated here as the solid and dashed lines, but for clarity these lines are not colored; they provide a reference grid to register the relative position of the different radial bins on the diagnostic diagrams.
Both the weak radial variations for CSF galaxies and the strong variations for CQ galaxies are readily apparent in this figure. Comparing the location of the radial bins on the two diagrams, as well as their relative location with respect to the model curves, presents a comprehensive picture of how and where star formation cessation is occurring within the galaxies. The diagrams demonstrate that all the CQ galaxies behave in the same manner: Dn(4000) decreases, while EW(HA) and EW(H) increase, as one moves outward in the galaxies. This consistency is even clearer in Figure 13 where we overplot the radial profiles of all 12 galaxies in a single set of diagnostic diagrams. The profiles are plotted with cyan triangles for CSF galaxies, and magenta triangles for CQ galaxies. We highlight the two peculiar galaxies discussed above, (ma003_9 and ma008_4), which show the strongest radial gradients and unusual shape in the profile of EW(H), by identifying them with yellow triangles. We also pick out the green-valley galaxies (NUV) as green triangles. For comparison, the central spaxels are plotted with blue open symbols and red solid symbols for the two classes of galaxies. The CQ galaxies indeed follow a tight track on the Dn(4000) versus EW(HA) plane.
These spatially-resolved data, reaching out to for all 12 galaxies, also show how the clear distinction between the two classes of galaxies becomes blurred when one also considers their outer parts. Figure 13 shows that the gaps in the parameter space between the regions occupied by the centers of the galaxies are populated by these same galaxies’ outer parts. This continuous sequence forms a tight relation in the Dn(4000)-EW(HA) plane, closely following the continuous star formation models. In detail, though, the intermediate region on the diagrams is mainly occupied by the two galaxies (ma003_9 and ma008_4) that have strong radial variations and unusual profiles in EW(H). In order to see this dominance more clearly, we have repeated the same panels of Figure 13, but excluding these two systems, and we find the gap between the galaxy types once again starts to emerge. It is clear, however, that the CQ galaxies do still extend substantially into the intermediate region, and that the effect appears to be stronger for green-valley galaxies than for the other objects in the CQ galaxy class.
3.4. Notes on individual galaxies
- ma008_4
-
This system, CGCG 184-033, is the central galaxy of a group in the catalog of Yang et al. (2007). The system comprises 8 member galaxies with spectroscopically-measured redshift from SDSS, including the central galaxy itself. This is the most massive galaxy in the sample with a stellar mass of . The SDSS spectroscopy and the central spaxel of the P-MaNGA datacube reveal that the central region of this galaxy shows relatively strong absorption in H for its EW(H), implying that a starburst event has happened within the galaxy in the past 1 – . Considering the fact that the galaxy has a very close companion, a strongly star-forming spiral at the same redshift (z=0.042), the post-starburst feature may be the product of a tidal interaction with the companion, which caused the central part of the galaxy to have ceased star formation recently. The P-MaNGA data also reveal strong radial variation in all the diagnostic parameters in this galaxy: Dn(4000), EW(HA) and EW(H). In particular the profile of EW(H) shows a very strange shape when compared to the other CQ galaxies.
- ma003_9
-
This galaxy is a spiral with a red core but very blue outer disk in the optical image (see Figure 8). It is classified as a blue-cloud galaxy because of its blue NUV color, but it is classified as a centrally quiescent galaxy due to its large central Dn(4000). The red core with old stellar populations and a blue global color seems to suggest that the galaxy might be a ‘Bluedisk’ galaxy, a class of system with an unusually high fraction of Hi gas mass, as recently studied in detail by Wang et al. (2013). However, the Hi gas mass is according to the Hi global profile from Huchtmeier & Richter (1989), homogenized in Paturel et al. (2003). This is comparable to the value expected from the NUV and stellar surface mass density for a normal spiral (Catinella et al., 2010; Li et al., 2012b). The BPT diagram shown in Figure 1 reveals strong nuclear activity in the galactic center. A mJy source coincident with this galaxy is detected by the NVSS survey (Condon et al., 1998), but no source is detected by the FIRST survey (Becker et al., 1995), suggesting that the radio emission from this galaxy is variable. This is consistent with an AGN origin, albeit at a low luminosity ( W/Hz). See the related paper by Belfiore et al. (2015) for a spatially-resolved BPT diagram of this galaxy, also based on the P-MaNGA data.
- ma003_4
-
This system is one of the two AGNs in the sample (the other one is ma003_9 above). The AGN component is likely responsible for the strange profiles of the EW(H) diagnostic in these systems, as discussed above.
- ma006_4
-
With a stellar mass of , this galaxy is the only low-mass CQ galaxy in the P-MaNGA sample. It has unusually low EW(H) for its EW(HA)(see Figure 12). This might be a metallicity effect, as the galaxy is much closer to the continuous models for a lower metallicity of Z=0.008.
4. Summary and discussion
Using datacubes for 12 galaxies produced during the MaNGA prototype (P-MaNGA) observations, we have obtained maps and radial profiles of the Dn(4000), EW(HA) and EW(H) spectral diagnostics. These parameters were derived for each spaxel by decomposing the spectrum into an emission-line component and a continuum plus absorption-line component, and measuring the relevant indices from these separate components. We study the spatially-resolved recent star formation histories of these galaxies by displaying their radial profiles on the Dn(4000) versus EW(HA) and EW(HA) versus EW(H) planes. We have classified the galaxies as either ‘centrally quiescent’ (CQ) or ‘centrally star-forming’ (CSF) according to the value of Dn(4000) in the central spaxel, and we compare the 2D maps and radial profiles for the two classes. CQ galaxies present significant radial gradients in all the three parameters, in the sense that Dn(4000) decreases, while both EW(HA) and EW(H) increase as one goes from the galactic center toward the outer region. In contrast, CSF galaxies show very weak or no radial variations. The outer parts of the galaxies show greater scatter on the diagnostic diagrams than their central regions. In particular, the separation between CQ and CSF galaxies in these diagnostic planes is largely filled in by the outer parts of galaxies whose global colors place them in the green valley.
The three spectral diagnostics are known to be sensitive indicators of stellar populations of different ages. Spatially resolving a galaxy on the Dn(4000)–EW(HA)–EW(H) diagrams probes the radial variations in recent star formation histories, thus revealing the way in which the galaxy grows and its star formation ceases. When spatially resolved, the P-MaNGA galaxies are found to form a tight sequence on the Dn(4000) versus EW(HA) plane, although the distribution of their central regions is strongly bimodal (Figure 13). This sequence closely follows the continuous star formation locus predicted by current stellar population models, and covers a very similar area to the distribution of the large sample of galactic centers from SDSS (Figure 2). This relation suggests that, at least for the systems being studied here, galaxy growth has been a smooth process, and is likely regulated by a common set of physical drivers. This result is consistent with the ‘inside-out’ picture of galaxy growth, where the stellar mass assembly starts in the galactic center and gradually extends to the outer regions (White & Frenk, 1991; Mo et al., 1998; Brook et al., 2006). In this picture, the shutdown of star formation also first occurs in the central region and slowly propagates out to ever larger radii. However, this result should not be overemphasized given the small size of our sample. The tight sequence on the Dn(4000)–EW(HA) diagram might be just a result of small number statistic. It could also be the case that there are a variety of physical processes behind this sequence, which can be discriminated only when a larger sample becomes available.
Radially resolved stellar populations have been studied previously to some extent, based on multi-wavelength broadband photometry at both low-z (e.g. de Jong, 1996; Bell & de Jong, 2000; Taylor, 2005; Muñoz-Mateos et al., 2007; Zibetti et al., 2009; Roche et al., 2010; Suh et al., 2010; Tortora et al., 2010; Gonzalez-Perez et al., 2011; Tortora et al., 2011; Kauffmann, 2015) and high-z (e.g. Abraham et al., 1999; Azzollini et al., 2009; Szomoru et al., 2012; Wuyts et al., 2012; Szomoru et al., 2013; Wuyts et al., 2013), as well as long-slit spectroscopy for nearby galaxies (e.g. Moran et al., 2012; Huang et al., 2013b). Most spirals are found to have stellar population gradients, with the inner regions being older and more metal-rich than their outer regions, supporting the inside-out scenario of disk galaxy formation. The majority of the early-type galaxies show flat color profiles, with only a small fraction being “blue-core” systems with negative color gradients (i.e. bluer outer parts). The star formation history of galactic disks is found to be primarily driven by its structural properties, as usually quantified by the surface stellar mass density (, Bell & de Jong, 2000) and stellar light concentration (Gonzalez-Perez et al., 2011), while the total stellar mass is a secondary parameter, correlated more closely with metallicity than with age. For massive galaxies, recent short-lived episodes or bursts of star formation occurring in their outer regions are required to interpret the radially resolved spectral indices as measured from long-slit spectroscopy (Huang et al., 2013b), a result that is consistent with the existence of many early-type galaxies in the nearby universe which display extended star-forming discs, as originally discovered by ultraviolet imaging (e.g. Yi et al., 2005; Kauffmann et al., 2007; Fang et al., 2012). The overall radial dependence of the diagnostic parameters presented in our work is apparently consistent with these previous findings, although the small sample size doesn’t allow the correlation of the radial profiles with galaxy morphology, stellar mass and structural properties to be examined in a statistical manner.
More recent studies using data from CALIFA have provided the most comprehensive results so far regarding the radial variations of the stellar population and star formation history of nearby galaxies (Pérez et al., 2013; González Delgado et al., 2014; Sánchez et al., 2014; Sánchez-Blázquez et al., 2014). Pérez et al. (2013) analyzed the first 105 galaxies of the CALIFA survey, quantifying their spatially resolved history of stellar mass assembly and demonstrating how massive galaxies grow their stellar mass inside-out. Oxygen abundances estimated from Hii regions in 306 CALIFA galaxies present a common negative gradient in the oxygen abundance between 0.3 and 2 times , independent of morphology, the presence of bars, absolute magnitude or mass, provided that the analysis is limited to those galaxies without clear evidence of an interaction (Sánchez et al., 2014). This result also supports the inside-out picture for the growth of galactic disks, and is consistent with the stellar age and metallicity gradients obtained by Sánchez-Blázquez et al. (2014) based on CALIFA data for a smaller sample of 62 nearly face-on spirals.
Using a sample of 107 galaxies from CALIFA, González Delgado et al. (2014) performed a detailed study of the radial structure of the stellar mass surface density () and stellar population age, as well as their dependence on the total stellar mass and morphology. In support of the inside-out formation picture, negative gradients of the stellar age are present in most of their galaxies. The behaviors of the Dn(4000) profiles in the P-MaNGA galaxies (see Fig. 11) are in good agreement with this result, although the Dn(4000) is not a direct measure of stellar age, but rather an indicator of the prominence of young stellar populations. Confirming the previous broadband photometry-based findings, the CALIFA data reveals that is more important than M∗ in driving the star formation history in disks, while M∗ plays a more fundamental role in spheroidal systems. The CALIFA results, together with the results from broadband photometry and long-slit spectroscopy, strongly suggest that galaxy growth and death are driven by multiple parameters (at least the local surface density, total stellar mass and morphology), and that further studies of much larger samples are needed in order to isolate the role of each parameter, and the physical process behind it. The increasing MaNGA sample is expected to provide much better results in the near future.
Another interesting result from our work is that, when spatially resolved, the distribution of galaxies on the diagnostic diagrams is no longer bimodal, and the separation between the CQ and CSF populations is filled in by those galaxies that are classified as ‘green-valley’ according to their optical/UV color. In a recent complementary study, Mendel et al. (2013) selected from SDSS a large sample of ‘recently quenched’ galaxies that have a significant fraction of young stars within the central region, and found them to populate the region of green-valley galaxies in Dn(4000) and optical colors, so their central parts seem to be at the same evolutionary stage as the outer parts of the P-MaNGA galaxies. The two studies combine to suggest that the green valley does, indeed, pick out a transition phase between star-forming and passive populations, but that different parts of different galaxies enter the green valley at different times.
There are a few caveats to this analysis that we will address in future work. We have used relative measurements of Dn(4000), EW(HA) and EW(H) as indicators of recent star formation history. We have not presented quantitative measurements of mean stellar ages due to the sensitivity of these indices to stellar metallicity, element abundance and dust attenuation (Worthey & Ottaviani, 1997; Bruzual & Charlot, 2003; Thomas et al., 2004; Thomas & Davies, 2006; Sánchez et al., 2012a). Throughout this paper we use solar metallicity models for comparison. We have compared the data to models with three different metallicities (Z=0.4, 1, 2.5Z⊙), finding that the dependence on metallicity is very small for younger stellar populations, but become more important at older ages. In Wilkinson et al. (2015) we explore the possibility of simultaneously deriving the age and metallicity of P-MaNGA galaxies using stellar population model fits to the full spectrum. In the present paper, we use the H emission line to characterize the instantaneous star formation rate. However, for galaxies with dominant old stellar populations, OB stars may not be the only source of ionizing photons (e.g. Cid Fernandes et al., 2010; Sánchez et al., 2014). Indeed, EW(H) lower than 6Å was found to be more compatible with light from post-AGB stars (Papaderos et al., 2013; Sarzi et al., 2013), and it would be interesting to evaluate the contribution of such stars to the emission-line properties of the spectra once a larger sample is available.
In a recent SDSS-based study Kauffmann (2014) has nicely demonstrated that a combination of Dn(4000), EW(HA) and the specific star formation rate (SFR/M∗) provides stringent constraints on the recent star formation histories of the central region of galaxies in the stellar mass range M⊙. In particular, this methodology is powerful in separating out the galaxies with ongoing or past starbursts from those with a continuous star formation history. By applying this new methodology to the spatially resolved spectroscopy for a large sample from MaNGA, we may well expect to better quantify the fractions of the mass produced by ongoing and recent bursts, as well as their radial variation across the whole galaxy, thus leading to more reliable constraints on the maps and radial profiles of the recent star formation history.
Previous studies have proposed a variety of galaxy properties as indicators of the termination of star formation, including both color indices (e.g. NUV) and structural parameters like the central surface mass density and stellar velocity dispersion (e.g. Fang et al., 2013), the effective radius and the ratio of stellar mass relative to , 2, or 1.5 (e.g. Omand et al., 2014), and Sersic profile index (e.g. Bell, 2008). Since different indicators may trace different physical processes, it is important to ask which galaxy property is most closely linked to the end of star formation. Again, once larger samples of galaxies become available, it will be very interesting to correlate the kind of spectral diagnostic gradient study presented here with these other parameters, to see which is the trigger, and even how the trigger varies between galaxies of different types or in different environments.
Despite these limitations, it is heartening to see how much can be learned about the cessation of star formation from even a sample of 12 galaxies, thanks to the resolved spectroscopic observations that P-MaNGA IFUs have provided. The full MaNGA survey began on 2014 July 1, offering new opportunities to extend these kinds of studies, as observations of its 10,000 galaxies continue.
References
- Abadi et al. (1999) Abadi, M. G., Moore, B., & Bower, R. G. 1999, MNRAS, 308, 947
- Abraham et al. (1999) Abraham, R. G., Ellis, R. S., Fabian, A. C., Tanvir, N. R., & Glazebrook, K. 1999, MNRAS, 303, 641
- Azzollini et al. (2009) Azzollini, R., Beckman, J. E., & Trujillo, I. 2009, A&A, 501, 119
- Bacon et al. (2001) Bacon, R., Copin, Y., Monnet, G., et al. 2001, MNRAS, 326, 23
- Baldry et al. (2004) Baldry, I. K., Glazebrook, K., Brinkmann, J., et al. 2004, ApJ, 600, 681
- Baldwin et al. (1981) Baldwin, J. A., Phillips, M. M., & Terlevich, R. 1981, PASP, 93, 5
- Balogh et al. (1999) Balogh, M. L., Morris, S. L., Yee, H. K. C., Carlberg, R. G., & Ellingson, E. 1999, ApJ, 527, 54
- Bamford et al. (2009) Bamford, S. P., Nichol, R. C., Baldry, I. K., et al. 2009, MNRAS, 393, 1324
- Becker et al. (1995) Becker, R. H., White, R. L., & Helfand, D. J. 1995, ApJ, 450, 559
- Belfiore et al. (2015) Belfiore, F., Maiolino, R., Bundy, K., et al. 2015, MNRAS submitted, arXiv:1410.7781
- Bell (2008) Bell, E. F. 2008, ApJ, 682, 355
- Bell & de Jong (2000) Bell, E. F., & de Jong, R. S. 2000, MNRAS, 312, 497
- Bell et al. (2004) Bell, E. F., McIntosh, D. H., Barden, M., et al. 2004, ApJ, 600, L11
- Bell et al. (2012) Bell, E. F., van der Wel, A., Papovich, C., et al. 2012, ApJ, 753, 167
- Bershady et al. (2010) Bershady, M. A., Verheijen, M. A. W., Swaters, R. A., et al. 2010, ApJ, 716, 198
- Birnboim & Dekel (2003) Birnboim, Y., & Dekel, A. 2003, MNRAS, 345, 349
- Blanton et al. (2005a) Blanton, M. R., Eisenstein, D., Hogg, D. W., Schlegel, D. J., & Brinkmann, J. 2005a, ApJ, 629, 143
- Blanton et al. (2011) Blanton, M. R., Kazin, E., Muna, D., Weaver, B. A., & Price-Whelan, A. 2011, AJ, 142, 31
- Blanton et al. (2005b) Blanton, M. R., Lupton, R. H., Schlegel, D. J., et al. 2005b, ApJ, 631, 208
- Blanton & Roweis (2007) Blanton, M. R., & Roweis, S. 2007, AJ, 133, 734
- Blanton et al. (2003) Blanton, M. R., Hogg, D. W., Bahcall, N. A., et al. 2003, ApJ, 594, 186
- Blumenthal et al. (1984) Blumenthal, G. R., Faber, S. M., Primack, J. R., & Rees, M. J. 1984, Nature, 311, 517
- Brammer et al. (2009) Brammer, G. B., Whitaker, K. E., van Dokkum, P. G., et al. 2009, ApJ, 706, L173
- Brinchmann et al. (2004) Brinchmann, J., Charlot, S., White, S. D. M., et al. 2004, MNRAS, 351, 1151
- Brook et al. (2006) Brook, C. B., Kawata, D., Martel, H., Gibson, B. K., & Bailin, J. 2006, ApJ, 639, 126
- Bruzual & Charlot (2003) Bruzual, G., & Charlot, S. 2003, MNRAS, 344, 1000
- Bundy et al. (2006) Bundy, K., Ellis, R. S., Conselice, C. J., et al. 2006, ApJ, 651, 120
- Bundy et al. (2010) Bundy, K., Scarlata, C., Carollo, C. M., et al. 2010, ApJ, 719, 1969
- Bundy et al. (2015) Bundy, K., Bershady, M. A., Law, D. R., et al. 2015, ApJ, 798, 7
- Cappellari & Copin (2003) Cappellari, M., & Copin, Y. 2003, MNRAS, 342, 345
- Cappellari et al. (2011) Cappellari, M., Emsellem, E., Krajnović, D., et al. 2011, MNRAS, 416, 1680
- Catinella et al. (2010) Catinella, B., Schiminovich, D., Kauffmann, G., et al. 2010, MNRAS, 403, 683
- Cattaneo et al. (2006) Cattaneo, A., Dekel, A., Devriendt, J., Guiderdoni, B., & Blaizot, J. 2006, MNRAS, 370, 1651
- Chabrier (2003) Chabrier, G. 2003, PASP, 115, 763
- Cheung et al. (2012) Cheung, E., Faber, S. M., Koo, D. C., et al. 2012, ApJ, 760, 131
- Chung et al. (2009) Chung, A., van Gorkom, J. H., Kenney, J. D. P., Crowl, H., & Vollmer, B. 2009, AJ, 138, 1741
- Cid Fernandes et al. (2004) Cid Fernandes, R., Gu, Q., Melnick, J., et al. 2004, MNRAS, 355, 273
- Cid Fernandes et al. (2010) Cid Fernandes, R., Stasińska, G., Schlickmann, M. S., et al. 2010, MNRAS, 403, 1036
- Cirasuolo et al. (2007) Cirasuolo, M., McLure, R. J., Dunlop, J. S., et al. 2007, MNRAS, 380, 585
- Colless et al. (2001) Colless, M., Dalton, G., Maddox, S., et al. 2001, MNRAS, 328, 1039
- Condon et al. (1998) Condon, J. J., Cotton, W. D., Greisen, E. W., et al. 1998, AJ, 115, 1693
- Cooper et al. (2008) Cooper, M. C., Newman, J. A., Weiner, B. J., et al. 2008, MNRAS, 383, 1058
- Cowie & Barger (2008) Cowie, L. L., & Barger, A. J. 2008, ApJ, 686, 72
- Croom et al. (2012) Croom, S. M., et al. 2012, MNRAS, 421, 872
- de Jong (1996) de Jong, R. S. 1996, A&A, 313, 377
- Dekel & Birnboim (2006) Dekel, A., & Birnboim, Y. 2006, MNRAS, 368, 2
- Di Matteo et al. (2005) Di Matteo, T., Springel, V., & Hernquist, L. 2005, Nature, 433, 604
- Drory et al. (2015) Drory, N., MacDonald, N., Bershady, M. A., et al. 2015, AJ, 149, 77
- Eisenstein et al. (2011) Eisenstein, D. J., Weinberg, D. H., Agol, E., et al. 2011, AJ, 142, 72
- Fabello et al. (2011) Fabello, S., Catinella, B., Giovanelli, R., et al. 2011, MNRAS, 411, 993
- Fabello et al. (2012) Fabello, S., Kauffmann, G., Catinella, B., et al. 2012, MNRAS, 427, 2841
- Faber et al. (2007) Faber, S. M., Willmer, C. N. A., Wolf, C., et al. 2007, ApJ, 665, 265
- Fang et al. (2013) Fang, J. J., Faber, S. M., Koo, D. C., & Dekel, A. 2013, ApJ, 776, 63
- Fang et al. (2012) Fang, J. J., Faber, S. M., Salim, S., Graves, G. J., & Rich, R. M. 2012, ApJ, 761, 23
- Franx et al. (2008) Franx, M., van Dokkum, P. G., Schreiber, N. M. F., et al. 2008, ApJ, 688, 770
- Giovanelli et al. (2005) Giovanelli, R., Haynes, M. P., Kent, B. R., et al. 2005, AJ, 130, 2598
- Gonçalves et al. (2012) Gonçalves, T. S., Martin, D. C., Menéndez-Delmestre, K., Wyder, T. K., & Koekemoer, A. 2012, ApJ, 759, 67
- González Delgado et al. (2014) González Delgado, R. M., Pérez, E., Cid Fernandes, R., et al. 2014, A&A, 562, A47
- Gonzalez-Perez et al. (2011) Gonzalez-Perez, V., Castander, F. J., & Kauffmann, G. 2011, MNRAS, 411, 1151
- Gunn & Gott (1972) Gunn, J. E., & Gott, III, J. R. 1972, ApJ, 176, 1
- Hopkins et al. (2006) Hopkins, P. F., Hernquist, L., Cox, T. J., et al. 2006, ApJS, 163, 1
- Huang et al. (2013a) Huang, J.-S., Faber, S. M., Willmer, C. N. A., et al. 2013a, ApJ, 766, 21
- Huang et al. (2013b) Huang, M.-L., Kauffmann, G., Chen, Y.-M., et al. 2013b, MNRAS, 431, 2622
- Huchtmeier & Richter (1989) Huchtmeier, W. K., & Richter, O.-G. 1989, A&A, 210, 1
- Hummer & Storey (1987) Hummer, D. G., & Storey, P. J. 1987, MNRAS, 224, 801
- Hunter & Elmegreen (2004) Hunter, D. A., & Elmegreen, B. G. 2004, AJ, 128, 2170
- Kauffmann (2014) Kauffmann, G. 2014, ArXiv e-prints
- Kauffmann (2015) —. 2015, ArXiv e-prints
- Kauffmann et al. (2006) Kauffmann, G., Heckman, T. M., De Lucia, G., et al. 2006, MNRAS, 367, 1394
- Kauffmann et al. (2003a) Kauffmann, G., Heckman, T. M., White, S. D. M., et al. 2003a, MNRAS, 341, 54
- Kauffmann et al. (2003b) Kauffmann, G., Heckman, T. M., Tremonti, C., et al. 2003b, MNRAS, 346, 1055
- Kauffmann et al. (2007) Kauffmann, G., Heckman, T. M., Budavári, T., et al. 2007, ApJS, 173, 357
- Kereš et al. (2005) Kereš, D., Katz, N., Weinberg, D. H., & Davé, R. 2005, MNRAS, 363, 2
- Kewley et al. (2006) Kewley, L. J., Groves, B., Kauffmann, G., & Heckman, T. 2006, MNRAS, 372, 961
- Law et al. (2015) Law, D. R., Yan, R., Bershady, M. A., et al. 2015, AJ submitted
- Li et al. (2012a) Li, C., Jing, Y. P., Mao, S., et al. 2012a, ApJ, 758, 50
- Li et al. (2012b) Li, C., Kauffmann, G., Fu, J., et al. 2012b, MNRAS, 424, 1471
- Li et al. (2005) Li, C., Wang, T.-G., Zhou, H.-Y., Dong, X.-B., & Cheng, F.-Z. 2005, AJ, 129, 669
- Lin et al. (2014) Lin, L., Jian, H.-Y., Foucaud, S., et al. 2014, ApJ, 782, 33
- Martig et al. (2009) Martig, M., Bournaud, F., Teyssier, R., & Dekel, A. 2009, ApJ, 707, 250
- Martin et al. (2005) Martin, D. C., Fanson, J., Schiminovich, D., et al. 2005, ApJ, 619, L1
- Martin et al. (2007) Martin, D. C., Wyder, T. K., Schiminovich, D., et al. 2007, ApJS, 173, 342
- Masters et al. (2010) Masters, K. L., Mosleh, M., Romer, A. K., et al. 2010, MNRAS, 405, 783
- Mendel et al. (2013) Mendel, J. T., Simard, L., Ellison, S. L., & Patton, D. R. 2013, MNRAS, 429, 2212
- Mendez et al. (2011) Mendez, A. J., Coil, A. L., Lotz, J., et al. 2011, ApJ, 736, 110
- Merluzzi et al. (2013) Merluzzi, P., Busarello, G., Dopita, M. A., et al. 2013, MNRAS, 429, 1747
- Mo et al. (1998) Mo, H. J., Mao, S., & White, S. D. M. 1998, MNRAS, 295, 319
- Moore et al. (1996) Moore, B., Katz, N., Lake, G., Dressler, A., & Oemler, A. 1996, Nature, 379, 613
- Moran et al. (2012) Moran, S. M., Heckman, T. M., Kauffmann, G., et al. 2012, ApJ, 745, 66
- Muñoz-Mateos et al. (2007) Muñoz-Mateos, J. C., Gil de Paz, A., Boissier, S., et al. 2007, ApJ, 658, 1006
- Muzzin et al. (2012) Muzzin, A., Wilson, G., Yee, H. K. C., et al. 2012, ApJ, 746, 188
- Omand et al. (2014) Omand, C. M. B., Balogh, M. L., & Poggianti, B. M. 2014, MNRAS, 440, 843
- Papaderos et al. (2013) Papaderos, P., Gomes, J. M., Vílchez, J. M., et al. 2013, A&A, 555, L1
- Paturel et al. (2003) Paturel, G., Theureau, G., Bottinelli, L., et al. 2003, A&A, 412, 57
- Peng et al. (2010) Peng, Y.-J., Lilly, S. J., Kovač, K., et al. 2010, ApJ, 721, 193
- Pérez et al. (2013) Pérez, E., Cid Fernandes, R., González Delgado, R. M., et al. 2013, ApJ, 764, L1
- Rees & Ostriker (1977) Rees, M. J., & Ostriker, J. P. 1977, MNRAS, 179, 541
- Roche et al. (2010) Roche, N., Bernardi, M., & Hyde, J. 2010, MNRAS, 407, 1231
- Sánchez et al. (2012a) Sánchez, S. F., Kennicutt, R. C., Gil de Paz, A., et al. 2012a, A&A, 538, A8
- Sánchez et al. (2012b) Sánchez, S. F., et al. 2012b, A&A, 538, A8
- Sánchez et al. (2014) Sánchez, S. F., Rosales-Ortega, F. F., Iglesias-Páramo, J., et al. 2014, A&A, 563, A49
- Sánchez-Blázquez et al. (2014) Sánchez-Blázquez, P., Rosales-Ortega, F. F., Méndez-Abreu, J., et al. 2014, A&A, 570, A6
- Sarzi et al. (2013) Sarzi, M., Alatalo, K., Blitz, L., et al. 2013, MNRAS, 432, 1845
- Schawinski et al. (2007) Schawinski, K., Thomas, D., Sarzi, M., et al. 2007, MNRAS, 382, 1415
- Schawinski et al. (2014) Schawinski, K., Urry, C. M., Simmons, B. D., et al. 2014, MNRAS, 440, 889
- Schiminovich et al. (2007) Schiminovich, D., Wyder, T. K., Martin, D. C., et al. 2007, ApJS, 173, 315
- Sharp et al. (2015) Sharp, R., Allen, J. T., Fogarty, L. M. R., et al. 2015, MNRAS, 446, 1551
- Silk (1977) Silk, J. 1977, ApJ, 211, 638
- Skrutskie et al. (2006) Skrutskie, M. F., Cutri, R. M., Stiening, R., et al. 2006, AJ, 131, 1163
- Strateva et al. (2001) Strateva, I., Ivezić, Ž., Knapp, G. R., et al. 2001, AJ, 122, 1861
- Suh et al. (2010) Suh, H., Jeong, H., Oh, K., et al. 2010, ApJS, 187, 374
- Szomoru et al. (2012) Szomoru, D., Franx, M., & van Dokkum, P. G. 2012, ApJ, 749, 121
- Szomoru et al. (2013) Szomoru, D., Franx, M., van Dokkum, P. G., et al. 2013, ApJ, 763, 73
- Taylor (2005) Taylor, M. B. 2005, in Astronomical Data Analysis Software and Systems XIV, ed. P. Shopbell, M. Britton, & R. Ebert, Vol. 347, 29
- Thomas & Davies (2006) Thomas, D., & Davies, R. L. 2006, MNRAS, 366, 510
- Thomas et al. (2004) Thomas, D., Maraston, C., & Korn, A. 2004, MNRAS, 351, L19
- Thomas et al. (2010) Thomas, D., Maraston, C., Schawinski, K., Sarzi, M., & Silk, J. 2010, MNRAS, 404, 1775
- Tifft (1963) Tifft, W. G. 1963, AJ, 68, 302
- Toomre & Toomre (1972) Toomre, A., & Toomre, J. 1972, ApJ, 178, 623
- Tortora et al. (2010) Tortora, C., Napolitano, N. R., Cardone, V. F., et al. 2010, MNRAS, 407, 144
- Tortora et al. (2011) Tortora, C., Napolitano, N. R., Romanowsky, A. J., et al. 2011, MNRAS, 418, 1557
- Vogt et al. (2004) Vogt, N. P., Haynes, M. P., Giovanelli, R., & Herter, T. 2004, AJ, 127, 3300
- Wang et al. (2013) Wang, J., Kauffmann, G., Józsa, G. I. G., et al. 2013, MNRAS, 433, 270
- Weinmann et al. (2009) Weinmann, S. M., Kauffmann, G., van den Bosch, F. C., et al. 2009, MNRAS, 394, 1213
- White & Frenk (1991) White, S. D. M., & Frenk, C. S. 1991, ApJ, 379, 52
- Wilkinson et al. (2015) Wilkinson, D. M., Maraston, C., Thomas, D., et al. 2015, MNRAS accepted.
- Williams et al. (2009) Williams, R. J., Quadri, R. F., Franx, M., van Dokkum, P., & Labbé, I. 2009, ApJ, 691, 1879
- Wisnioski et al. (2015) Wisnioski, E., Förster Schreiber, N. M., Wuyts, S., et al. 2015, ApJ, 799, 209
- Wolf et al. (2005) Wolf, C., Gray, M. E., & Meisenheimer, K. 2005, A&A, 443, 435
- Wolf et al. (2009) Wolf, C., Aragón-Salamanca, A., Balogh, M., et al. 2009, MNRAS, 393, 1302
- Worthey & Ottaviani (1997) Worthey, G., & Ottaviani, D. L. 1997, ApJS, 111, 377
- Wuyts et al. (2012) Wuyts, S., Förster Schreiber, N. M., Genzel, R., et al. 2012, ApJ, 753, 114
- Wuyts et al. (2013) Wuyts, S., Förster Schreiber, N. M., Nelson, E. J., et al. 2013, ApJ, 779, 135
- Wyder et al. (2007) Wyder, T. K., Martin, D. C., Schiminovich, D., et al. 2007, ApJS, 173, 293
- Yan et al. (2015) Yan, R., Tremonti, C., Bershady, M. A., et al. 2015, to be submitted
- Yang et al. (2007) Yang, X., Mo, H. J., van den Bosch, F. C., et al. 2007, ApJ, 671, 153
- Yi et al. (2005) Yi, S. K., Yoon, S.-J., Kaviraj, S., et al. 2005, ApJ, 619, L111
- York et al. (2000) York, D. G., Adelman, J., Anderson, Jr., J. E., et al. 2000, AJ, 120, 1579
- Zhang et al. (2013) Zhang, W., Li, C., Kauffmann, G., & Xiao, T. 2013, MNRAS, 429, 2191
- Zibetti et al. (2009) Zibetti, S., Charlot, S., & Rix, H.-W. 2009, MNRAS, 400, 1181
- Zwaan et al. (2005) Zwaan, M. A., Meyer, M. J., Staveley-Smith, L., & Webster, R. L. 2005, MNRAS, 359, L30