Rotational spectroscopy as a tool to investigate interactions between vibrational polyads in symmetric top molecules: low-lying states of methyl cyanide, CH3CN
Abstract
Rotational and rovibrational spectra of methyl cyanide were recorded to analyze interactions in low-lying vibrational states and to construct line lists for radio astronomical observations in space as well as for infrared spectroscopic investigations of planetary atmospheres. The rotational spectra cover large portions of the 361627 GHz region. In the infrared (IR), a spectrum was recorded for this study in the region of around 717 cm-1 with assignments covering 684765 cm-1. Additional spectra in the region were used to validate the analysis.
Information on the level structure of CH3CN is almost exclusively obtained from IR spectra, as are basics of the level structure. The large amount and the high accuracy of the rotational data improves knowledge of the level structure considerably. Moreover, since these data extend to much higher and quantum numbers, they allowed us to investigate for the first time in depth local interactions between these states which occur at high values. In particular, we have detected several interactions between and 2. Notably, there is a strong , , Fermi resonance between and at . Pronounced effects in the spectrum are also caused by resonant , , interactions between and 2 at , /, and at , /, . An equivalent resonant interaction occurs between of the ground vibrational state and , of for which we present the first detailed account. A preliminary account was given in an earlier study on the ground vibrational state. Similar resonances were found for CH3CCH and, more recently, for CH3NC, warranting comparison of the results. From data pertaining to , we also investigated rotational interactions with as well as , , Fermi interactions between and 3.
We have derived N2- and self-broadening coefficients for the , , and bands from previously determined values. Subsequently, we determined transition moments and intensities for the three IR bands.
keywords:
rotational spectroscopy , infrared spectroscopy , vibration-rotation interaction , methyl cyanide , interstellar molecule1 Introduction
Among the more than 180 different molecules detected in the interstellar medium (ISM) or in circumstellar envelopes (CSEs) of late type stars, there are 56 with a CN moiety, see, e.g., the Molecules in Space page111https://cdms.astro.uni-koeln.de/classic/molecules of the Cologne Database for Molecular Spectroscopy, CDMS [1, 2] or the Bibliography of Astromolecules222http://www.astrochymist.org/astrochymist_mole.html of the Astrochymist web-page333http://www.astrochymist.org/. Almost two thirds of these can be viewed as cyanides in a wider sense. The alkyl cyanides n-propyl cyanide, n-C3H7CN, also known as 1-cyanopropane or butyronitrile, and iso-propyl cyanide, i-C3H7CN, also known as 2-cyanopropane or iso-butyronitrile, both recently detected in the very massive and luminous galactic center source Sagittarius B2(N) (Sgr B2(N) for short) [3, 4] are the largest complex organic molecules detected in the ISM thus far, and, after HC11N, the second largest cyanides. Moreover, iso-propyl cyanide was the first branched alkyl compound detected in space [4]. Ethyl cyanide, C2H5CN, the next smaller homolog, was detected much earlier in the Orion Molecular Cloud as well as Sgr B2 [5]. Its 13C isotopologs were detected in Orion IRc2 [6] and Sgr B2(N) [7]. In addition, rotational transitions pertaining to the two lowest-lying vibrational states were detected in G327.30.6 [8] and Sgr B2(N) [9]. Transitions of higher excited states were detected in molecular clouds of Orion [10] and Sgr B2(N) [11].
Methyl cyanide, CH3CN, also known as acetonitrile or cyanomethane, is the smallest alkyl cyanide. It is a trace constituent in Earth’s atmosphere which was studied, e.g., by high-resolution spectroscopy using microwave limb sounding [12] and balloone-borne IR spectroscopy [13]. It is produced mainly by biomass burning [14, 15]. Acetonitrile is also a useful solvent in the chemical industry.
Methyl cyanide is a very important molecule in space. First identified in Sgr A and B more than 40 years ago, it was among the first molecules to be observed by radio astronomy [16]. It was also seen in comets, such as Kohoutek [17], in the atmosphere of Saturn’s moon Titan [18], in dark clouds, such as TMC-1 [19], around the low-mass protostar IRAS 162932422 [20], in the CSE of the famous carbon-rich late-type star CW Leonis, also known as IRC +10216 [21], and in external galaxies, such as NGC 253 [22]. Several isotopologs of CH3CN were detected as well in the ISM, including the rare CH2DCN [23] and possibly even 13CHCN [11]. Transitions of methyl cyanide within its lowest excited vibrational state were detected more than 30 years ago [24]. More recently, brief accounts on observations of transitions belonging to [11, 25], [11] as well as on transitions of vibrationally excited methyl cyanide with 13C [11] have been published.
The identifications were based on extensive laboratory investigations which began almost 70 years ago [26]. The most recent account on the ground state rotational spectrum of the main isotopolog CH3CN was given by some of the present authors along with analyses for several minor isotopologs [27]; unlabeled atoms refer to 1H, 12C, and 14N. The CH3CN line list was based mainly on an accurate and extensive study [28] which employed earlier data for frequencies below 74 GHz [29, 30, 31]. Information on the purely -dependent terms cannot be determined by rotational spectroscopy for a strongly prolate symmetric top, such as methyl cyanide, unless from the very weak transitions that gain intensity from centrifugal distortion effects on the the dipole moment. Thus the purely -dependent terms , , and an estimate of were determined from ground state energy differences [32].
The lowest excited vibrational state of CH3CN is the doubly degenerate CCN bending mode at a vibrational energy of 365.0 cm-1 [33]. It was studied first in 1961 by rotational spectroscopy between 92 and 222 GHz ( to 11) [34]. Soon thereafter, more accurate data with partly resolved 14N hyperfine structure between 18 and 148 GHz ( to 7) were reported [35, 36]. Later, data were obtained near 370 GHz () [37] and, employing a laser-sideband spectrometer, in selected regions between 589 and 1395 GHz ( to 75) [38]. Direct -type transitions between the components were also observed with [39, 40].
To our knowledge, there was only one prior high-resolution IR study of the band [33], although there were earlier low- to moderate-resolution studies of or indirect determinations of the vibrational energy from higher vibrational bands. A resonant interaction with and between , and , at was reported [41], but could only be analyzed approximately because only two slightly perturbed transitions in the ground vibrational state ( and 39) were observed.
The parallel band at 716.7 cm-1 [42] was treated as an isolated state in that study even though a rather strong Fermi interaction of with , the non-degenerate CC stretching mode at 920.3 cm-1 ( cm-1) was proposed from a force field analysis [43]. This interaction has not been considered in high resolution analyses of thus far. Transitions to became observable only through interaction with [42]. A Fermi interaction between , and at and 13 was proposed to explain deviations in the high- part of the band [44]. This interaction was confirmed in a later study mainly concerned with , and bands between 850 and 1150 cm-1 [45]; in addition, a and interaction between and at and 5, respectively was found for the first time along with several other perturbations among the higher lying states.
The rotational spectrum of CH3CN in its state has also been studied between 18 and 112 GHz ( to 5) [36, 46, 47], near 370 GHz () [37] and, employing a laser-sideband spectrometer, in selected regions between 787 and 1273 GHz ( to 68) [38].
Despite the numerous studies of methyl cyanide in various spectral regions, there has been no detailed attempt to study its spectroscopy globally. If there were effects, which were caused by vibrational states outside of the polyad under investigation, they were only considered through the effective parameters, see, e.g., Refs. [41, 45].
In the present work, we have recorded extensive rotational and rovibrational spectra in order to study vibration-rotation interactions not only within vibrational states or within vibrational polyads, but also between vibrational polyads. In comparison to earlier data, we access higher and quantum numbers, have a more complete coverage of the data and typically higher accuracies. The data permitted the first detailed analysis of a resonant interaction between and and the first detections and analyses of interactions between and 2 as well as between and 3. Preliminary results were described earlier [48]. In this article, we present an expanded analysis of these vibrational states of methyl cyanide with up to 2 and provide preliminary analyses of interactions with vibrational states pertaining to the next polyad. We calculate rotational and rovibrational spectra from our resulting analysis to support methyl cyanide observations in diverse environments in space as well as in Earth’s atmosphere and those of other planets or related objects.
Interactions between vibrational polyads of symmetric top molecules, such as methyl cyanide, are facilitated by the comparatively small vibrational energy of 365 cm-1 for combined with the large Coriolis coupling between the two components which causes levels with , but different to repel each other increasingly at higher such that the lower energy component can interact with the ground vibrational state at specific whereas the higher energy component in turn can interact with the different components of also at specific . Vibrational polyads are groups of one or more vibrational states separated by approximately equal amounts of vibrational energy, see e.g. Ref. [49] for a recent review.
Interactions in symmetric top molecules between vibrational polyads were studied first in the case of propyne, CH3CCH, also known as methylacetylene, which is isoelectronic to methyl cyanide. A , , Fermi interaction at between and as well as a Coriolis interaction with , at and 9, respectively, between and were first revealed mainly by rotational spectroscopy [50] and later improved by infrared as well as additional rotational spectroscopy [51]. The latter study also revealed a rotational (Coriolis-type) resonance between and , which is the lowest vibration of the next higher tetrad. Interactions between the dyad and the tetrad were studied in greater detail later [52]. More recently, such Fermi and -resonances were analyzed between and 2 in methyl isocyanide [53]. The vibrational energy of is lower, only 267.3 cm-1, such that the Fermi interaction occurs already at and 10, while they occur at and 14 for the corresponding resonances in methylacetylene and methyl cyanide.
We are not aware of resonant interactions between the ground and an excited vibrational state in the case of a symmetric top molecule other than the case of CH3CN. However, a Coriolis-type interaction between the ground vibrational state of HNCO and its lowest state was proposed and its strength estimated [54]. An analysis was presented for the analogous case of the isoelectronic HN3 molecule [55]. A remarkable case is vinyl cyanide, C2H3CN, also known as acrylonitrile, for which the ground vibrational state was connected to its lowest state through and 6 interactions without observation of high-resolution infrared transitions [56]. Recently, was connected to and as well as the latter two to each other [57]. The density of vibrational states increases with energy, and therefore chances to connect states at lower quantum numbers and through interactions with smaller increase. However, observation may be difficult in practice because transitions in higher vibrational states are weaker than corresponding ones in lower vibrational states. In addition, the number of at least similarly strong rotational transitions per frequency unit increases also with vibrational state.
2 Experimental details
2.1 Rotational spectra at the Jet Propulsion Laboratory
Most of the CH3CN rotational data were extracted from broad frequency scans taken with the JPL cascaded multiplier spectrometer [58]. Generally, a multiplier chain source is passed through a meter pathlength flow cell and is detected by a silicon bolometer cooled to near 1.7 K. The cell is filled with a steady flow of reagent grade acetonitrile at room temperature, and the pressure and modulation are optimized to enable good S/N ratios with narrow lineshapes. The S/N ratio was optimized for a higher- transition (e.g. ) because of the very strong ground state transitions of the main isotopolog with lower , which may exhibit saturated line profiles. This procedure enables better dynamic range for the extraction of line positions for rare isotopologs and highly excited vibrational satellites. The frequency ranges covered were 440540, 619631, 638648, 770855, 875930, 9671050, 10831093, 11001159, 11681198, 15761591, and 16141627 GHz, as in our previous analysis [27]. In addition, we obtained new data at 530595 GHz and data with improved S/N in the 780835 GHz region. Most of these multiplier sources were previously described [58]. However, the multiplier chain with frequency range coverage between 9671050 GHz was not described in that work. This chain consists of two cascaded triplers after the amplified W-band stage, the peak output power is near 100 W. The efficiency of frequency multipliers is usually strongly frequency-dependent. In addition, recording conditions and sensitivities of detectors can have strong influences on the quality of the spectra. Particularly good S/N ratios were reached around 600, 800, 900 and at 11001200 GHz. The S/N ratios changed considerably within each scan and were usually lower towards the edges. Uncertainties of 50 kHz were assigned to isolated lines with good to moderate S/N ratios, smaller uncertainties, down to 10 kHz, in cases of very good S/N and very symmetric lineshapes, larger uncertainties if the S/N was poorer or if the lineshape was rather asymmetric, e.g. because of the proximity to another line.
2.2 Rotational spectra at the Universität zu Köln
All measurements at the Universität zu Köln were recorded at room temperature in static mode employing different Pyrex glass cells having an inner diameter of 100 mm with pressures in the range of 0.10.5 Pa at lower frequencies, increased to around 1.0 Pa at higher frequencies. The window material was Teflon at lower frequencies, whereas high-density polyethylene was used at higher frequencies. Frequency modulation was used throughout with demodulation at , causing an isolated line to appear close to a second derivative of a Gaussian.
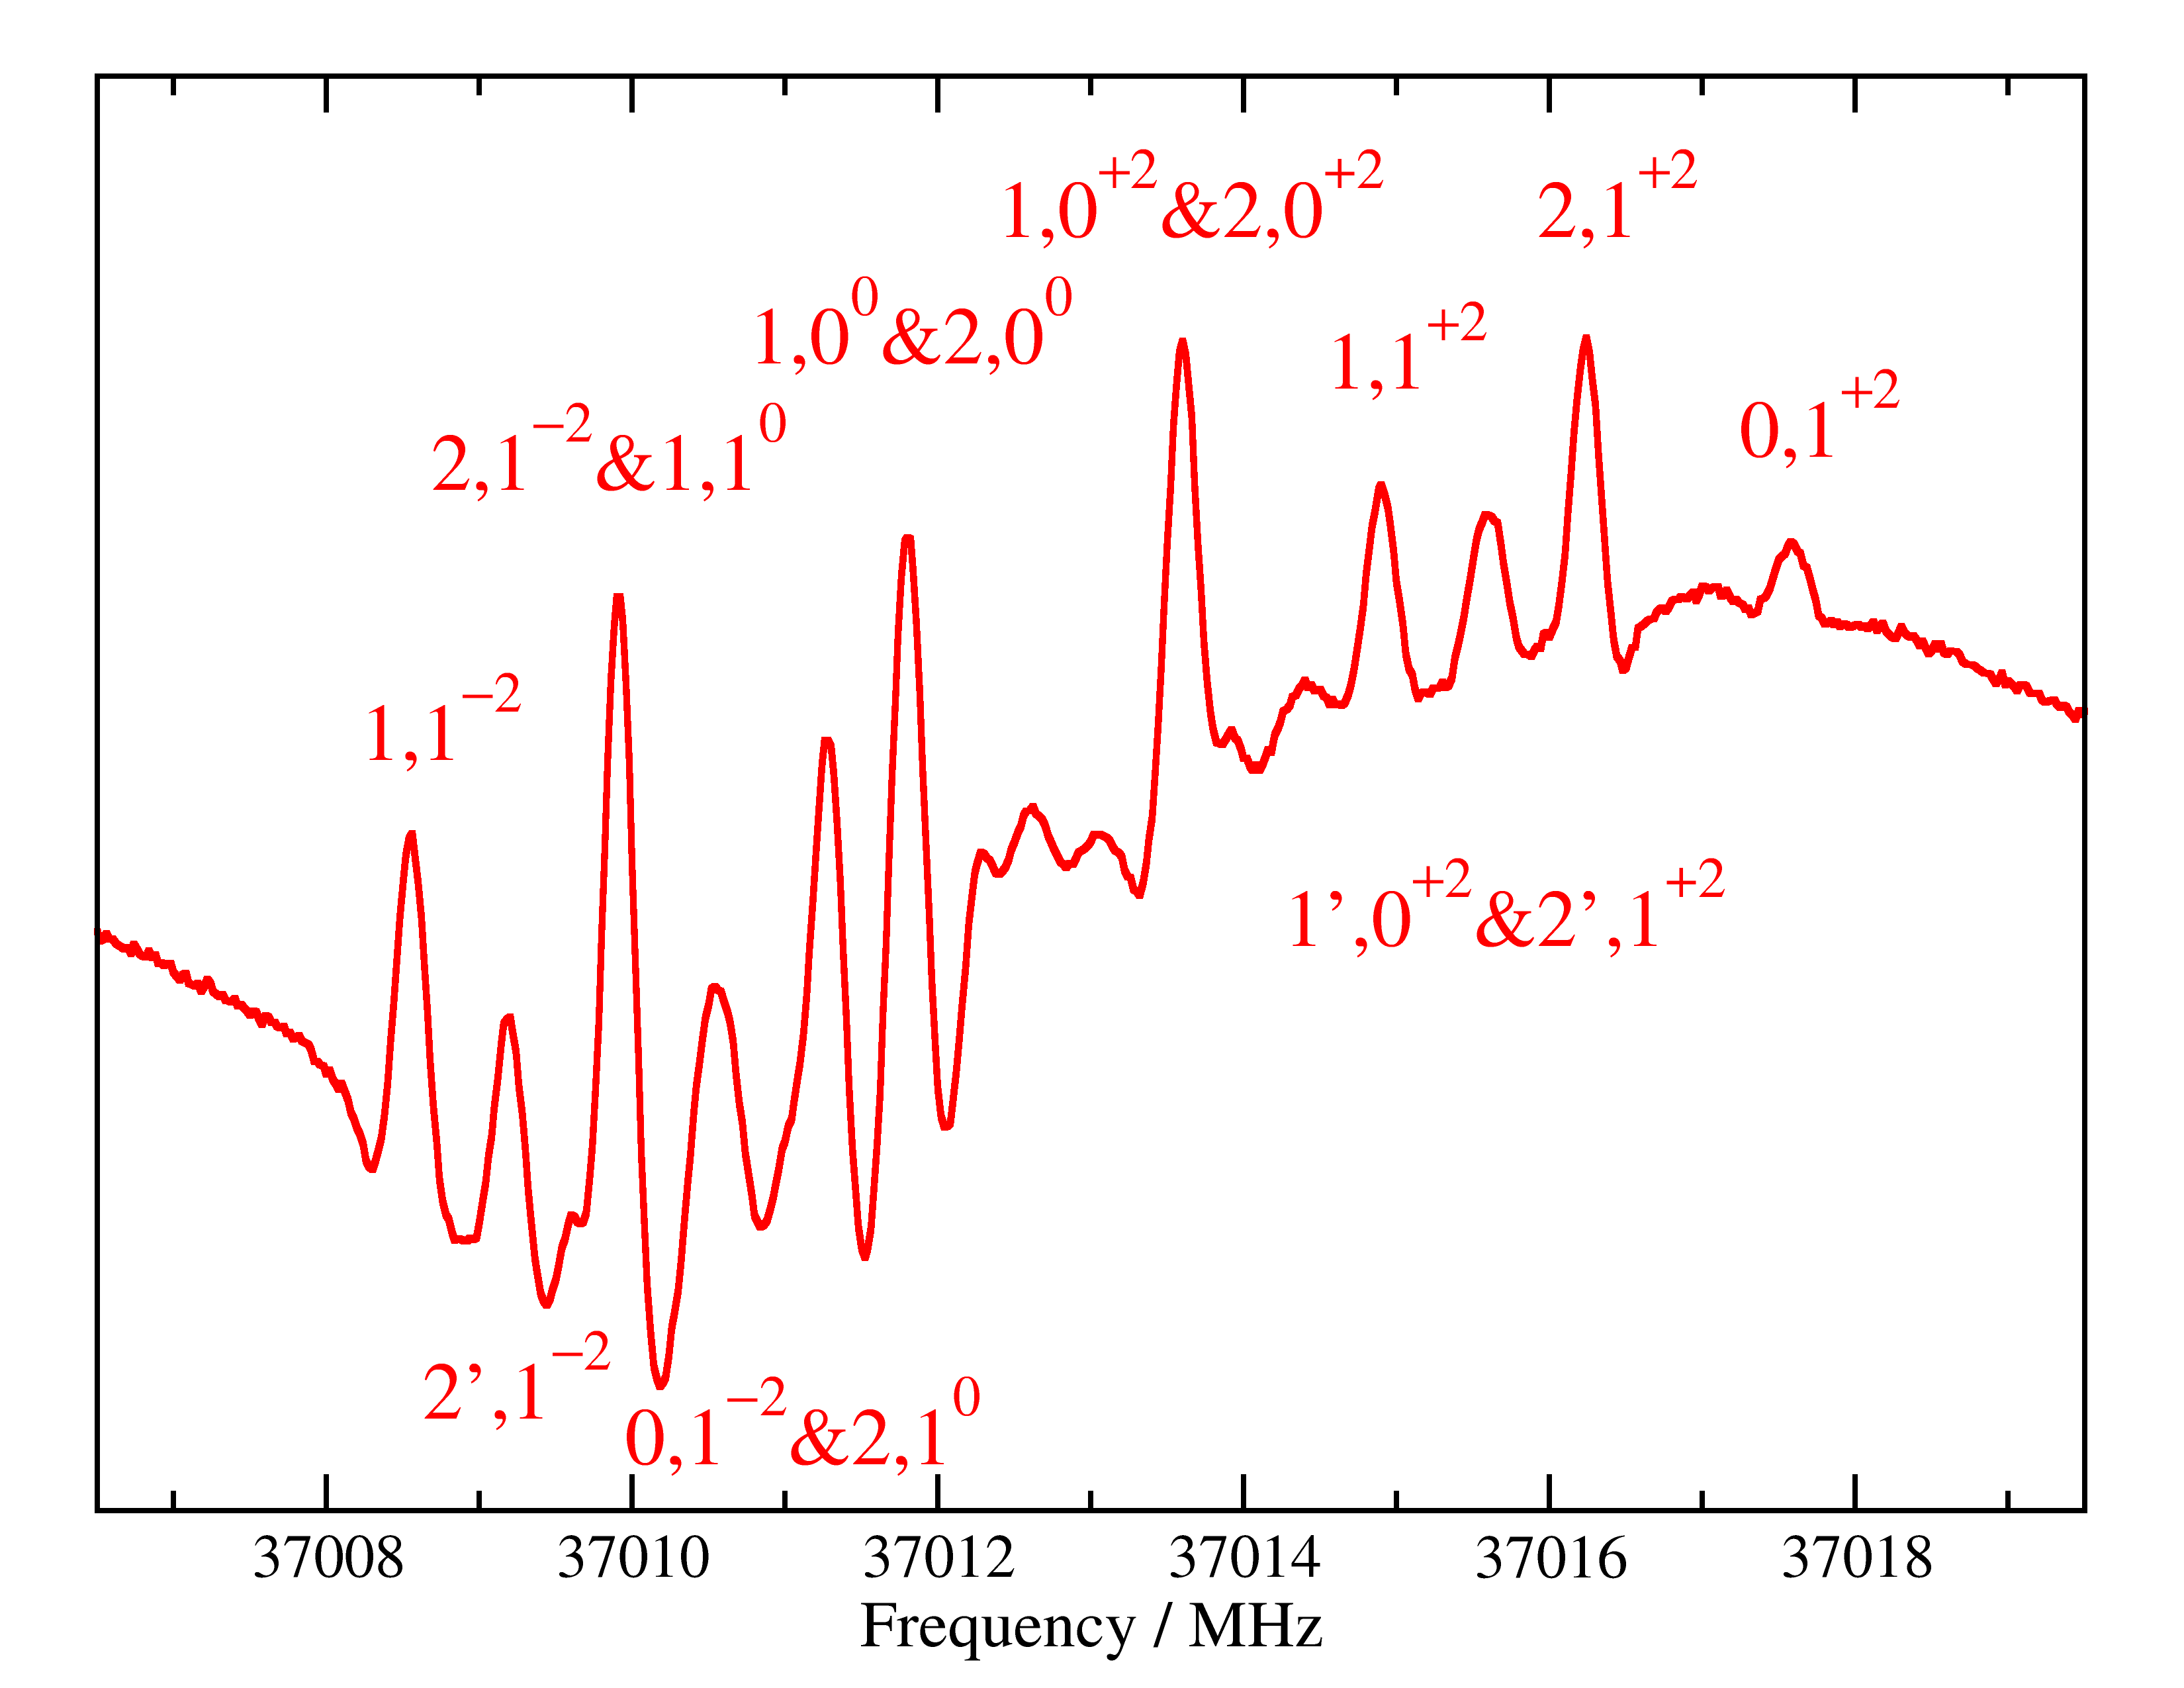
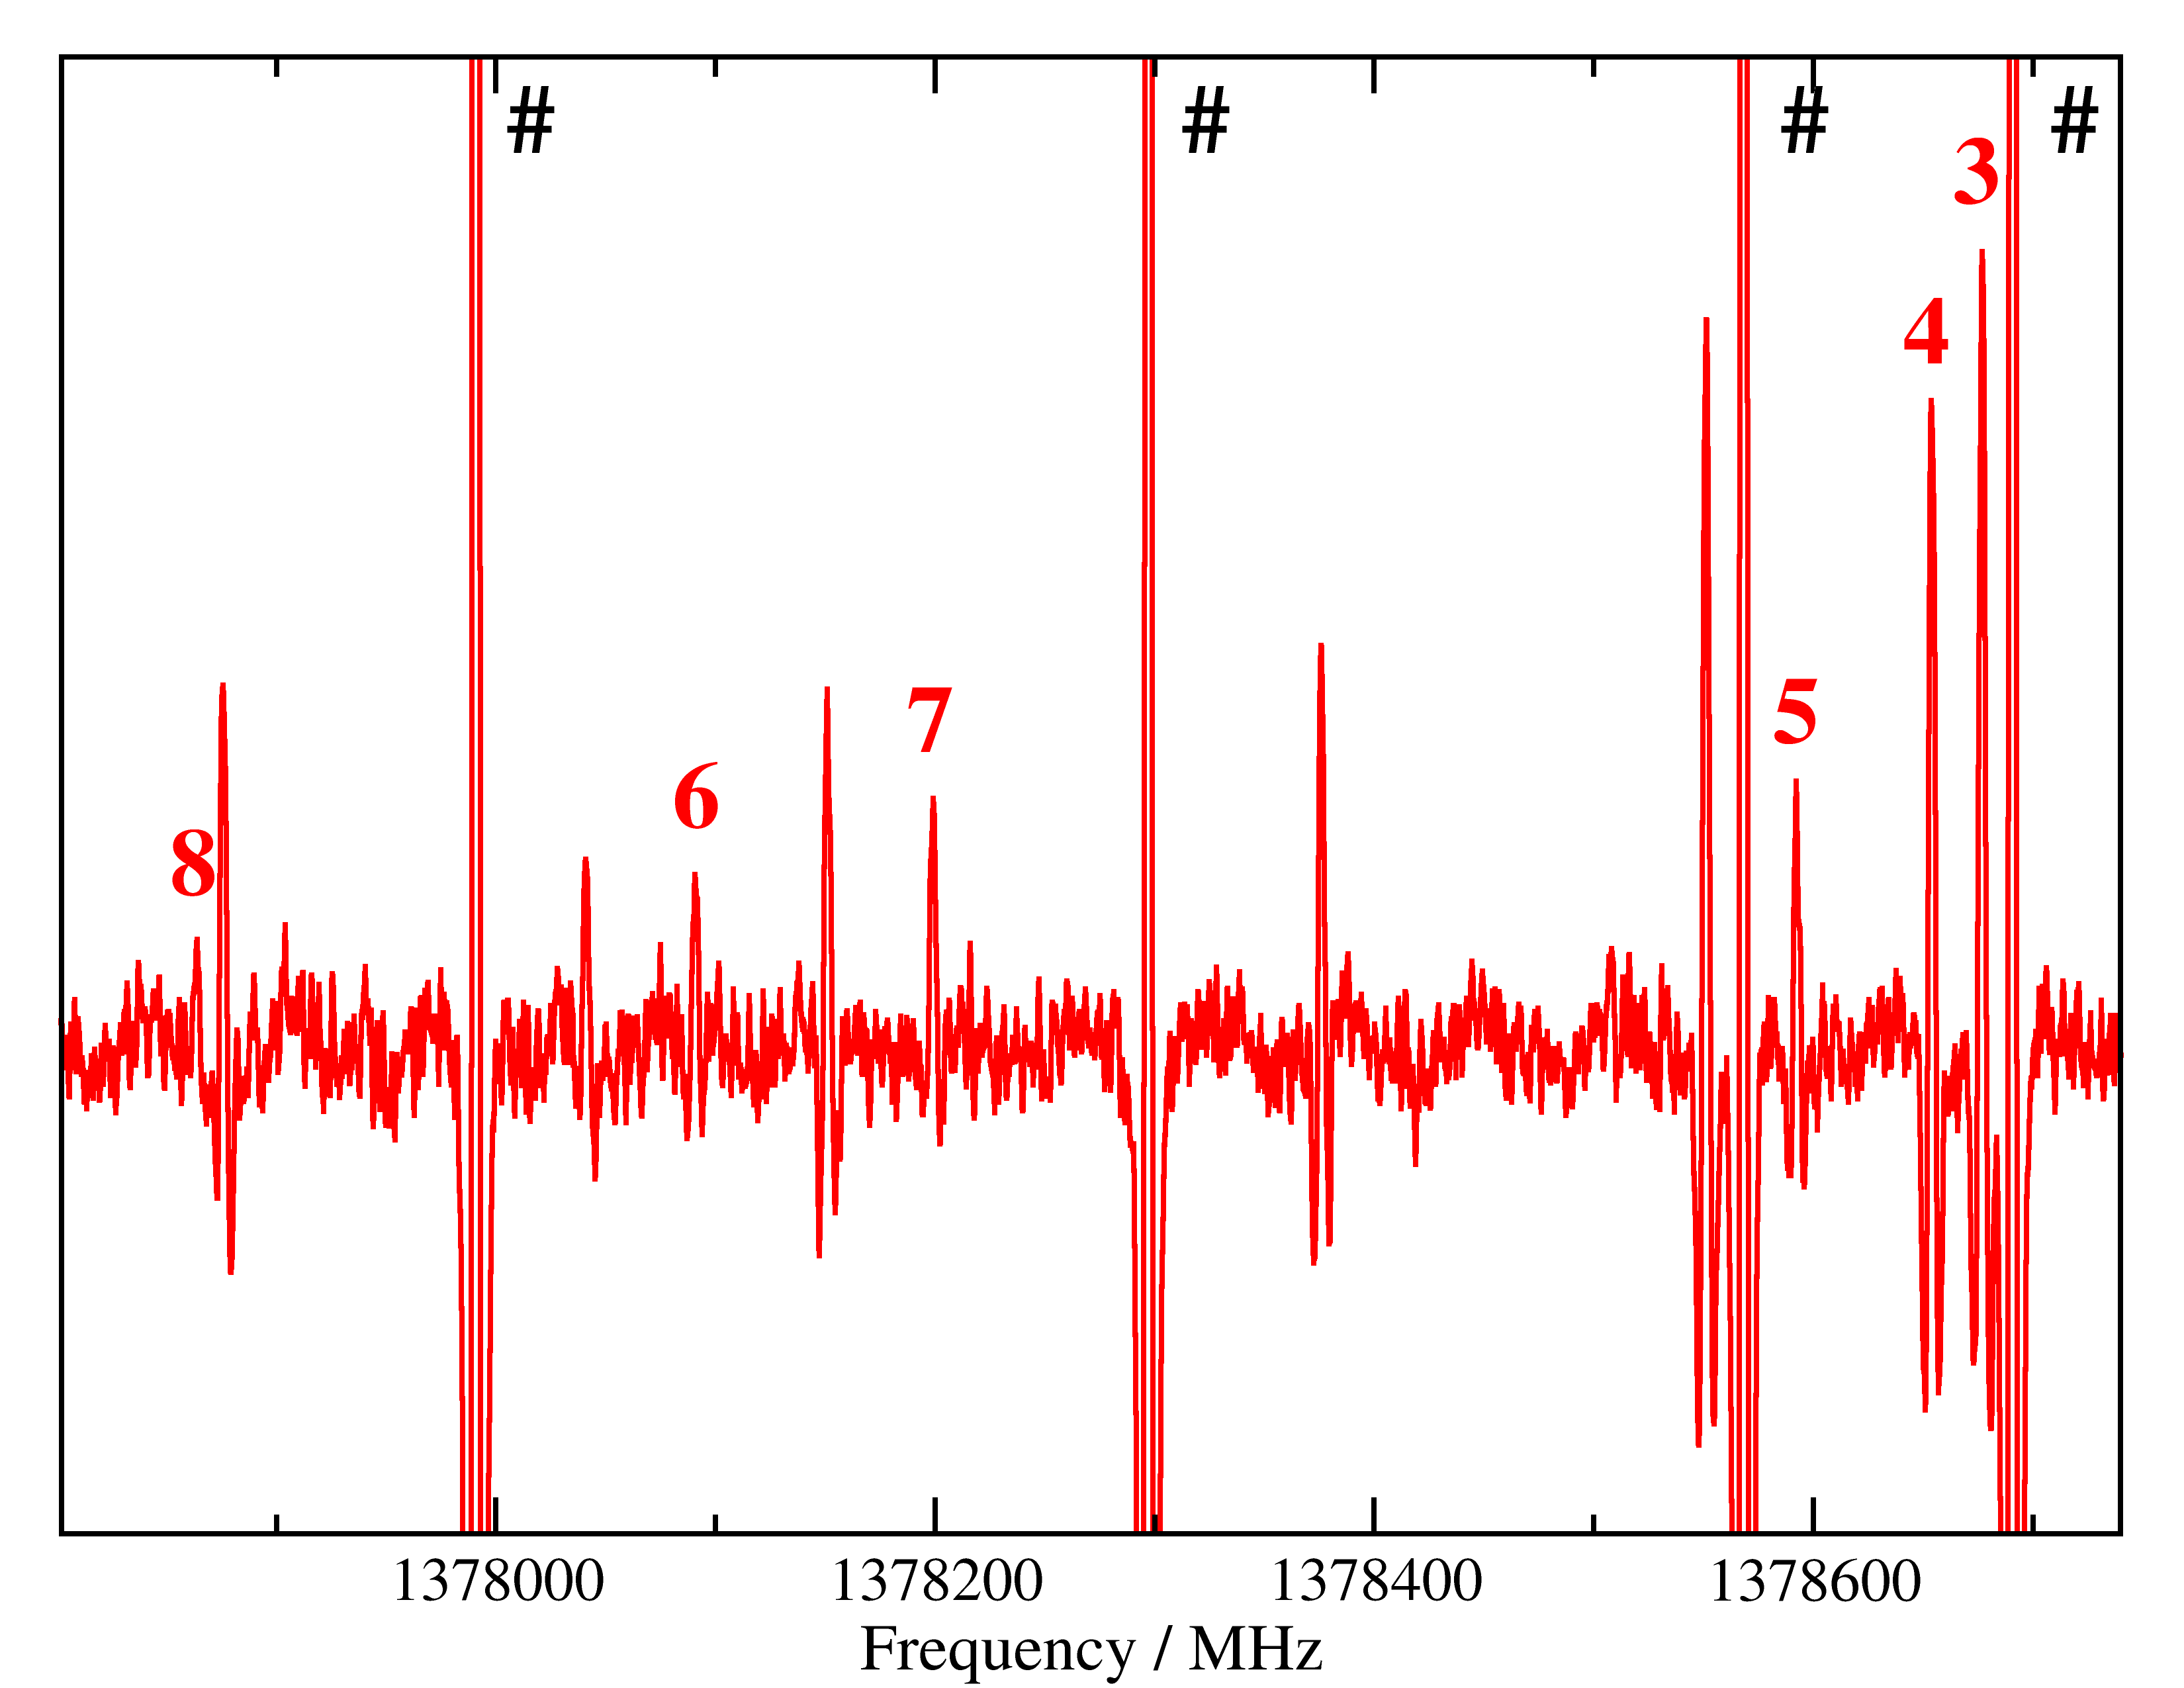
The and transitions of several vibrational states around 37 and 55 GHz, respectively, were recorded with an Agilent E8257D microwave synthesizer as source and a home-built Schottky diode detector. A 7 m long double pass absorption cell was used for these measurements. All other measurements were carried out in shorter (around 3 m) single pass cells. The transitions of around 74.0 GHz were recorded using a backward-wave oscillator (BWO) based 4 mm synthesizer AM-MSP 1 (Analytik & Meßtechnik GmbH, Chemnitz, Germany) as source and a Schottky-diode as detector. A small number of methyl cyanide rotational transitions were recorded around 850 GHz and around 880 GHz with the Cologne Terahertz Spectrometer [59] using a BWO as source and a liquid helium cooled InSb hot-electron bolometer (QMC) as detector. Further, extensive measurements were carried out in parts of the 13301501 GHz region employing a frequency multiplier (Virginia Diode, Inc.) driven by an Agilent E8257D microwave synthesizer as source and the InSb bolometer as detector. This spectrometer was used previously for investigations of CH3SH and 13CH3OH [60, 61].

2.3 Infrared spectrum
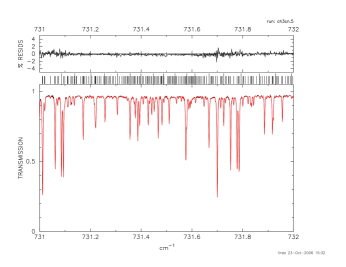
One infrared spectrum of CH3CN was recorded between 600 and 989 cm-1 at 0.0016 cm-1 resolution using an MCT detector with a Bruker 120 HR Fourier transform spectrometer at Pacific Northwest National Laboratory (PNNL); the 2 region is shown in Fig. 1. For this, a multi-pass absorption cell, set to an optical path length of 19.20 m, was filled to 0.226 Torr (30.1 Pa) of CH3CN at 293.0 K. Small amounts of OCS and CO2 were added to the sample for frequency calibration; comparison of 63 well-isolated lines of the fundamental of OCS at 860 cm-1 [62] produced a calibration factor 1.000000868 (21) with an rms of 0.0000182 cm-1. Nearly 12000 line positions and relative intensities between 690 and 765 cm-1 were retrieved using non-linear least-squares curve-fitting [63]. However, the corresponding precisions in the 2 region were an order of magnitude worse than the OCS calibration because the observed spectrum was so congested. Fig. 2 shows the quality of the curve fitting for a small section of .
Two other room-temperature spectra spanned the region (250 to 400 cm-1) at 294 K using pressures of 0.78 Torr (103.9 Pa) with a 19.2 m path and 1.01 Torr (134.5 Pa) with a 3.24 m path. These were calibrated using residual water inside the FTS [64] to obtain a calibration factor of 1.000000207 (495) with an rms of only 0.000140 cm-1. The spectra were very congested and no attempt was made to retrieve postions and intensities by curve-fitting. Previously reported CH3CN line centers [33] had better precisions in this second region, and so these new data were used mainly to search for hot bands and to confirm assignments in the 2 region.
3 Results
3.1 Overview of CH3CN spectroscopy
| State | Sym. | Energy | Reference | |
|---|---|---|---|---|
| 0 | .0 | per definitionem | ||
| 365 | .024 | this work | ||
| 716 | .750 | this work | ||
| 739 | .148 | this work | ||
| 920 | .290 | Ref. [45] | ||
| 1041 | .855 | Ref. [45] | ||
| 1077 | .786 | Ref. [45] | ||
| 1122 | .15 | Ref. [45] | ||
| 1290 | .0 | Ref. [69] | ||
| 1385 | .2 | Ref. [69] | ||
| 1401 | .7 | Ref. [69] | ||
| 1408 | .9 | Ref. [69] | ||
| 1426 | . | this work | ||
| 1447 | .9 | Ref. [69] | ||
| 1449 | .7 | Ref. [69] | ||
| 1514 | . | this work | ||
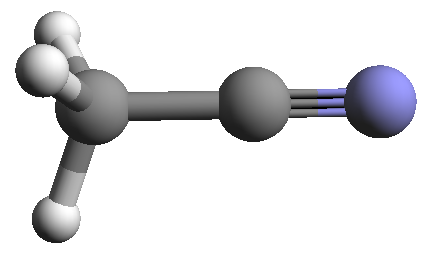
As shown in Fig. 3, the light H atoms are the only ones not on the symmetry axis of CH3CN. Hence, methyl cyanide is a strongly prolate molecule (). Rotational transitions with are strong because of the large dipole moment of 3.92197 (13) D [65]. transitions only gain intensity through centrifugal distortion effects and are usually very weak. In the absence of perturbations, the purely axial parameters (or ), , etc. cannot be determined by rotational spectroscopy. Moreover, even rovibrational spectroscopy yields, strictly speaking, the differences (or ), , etc. from single state analyses, but not the ground state parameters. In the case of CH3CN, analyses of three IR bands involving two doubly degenerate vibrational modes, , , and , permitted the axial parameters to be determined [32].
Methyl cyanide has four totally symmetric and four doubly degenerate vibrational modes. The three lowest energy fundamentals are the doubly degenerate CCN bending mode at 365.024 cm-1 [33], the totally symmetric CC stretching mode at 920.290 cm-1 [45], and the doubly degenerate CH3 rocking mode at 1041.855 cm-1 [45]. They are comparatively weak with integrated room temperature cross sections in the range 2 to cm/molecule [66, 67]. Interestingly, the overtone band is slightly stronger than or [66, 67]. In the case of , line-by-line intensity measurements have also been published [68]. A list of low-lying vibrational states, up to 1500 cm-1, is given in Table 1.
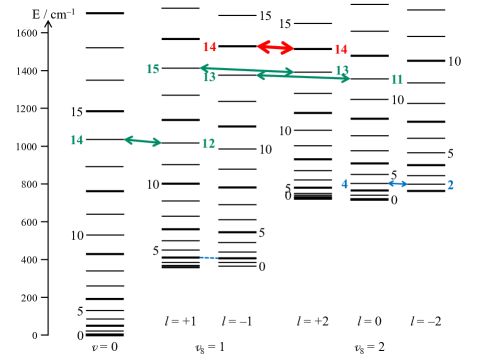
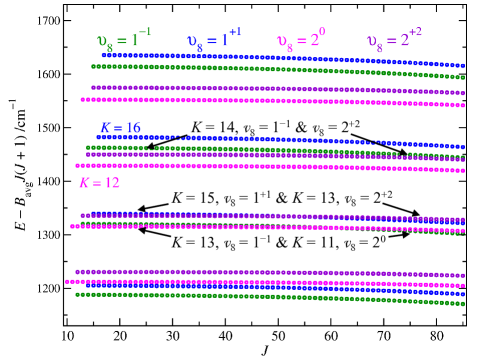
The fairly large value of , 5.27 cm-1, leads to a rapid increase in rotational energy with which is shown up to 1700 cm-1 in Fig. 4. The highest levels observed involve , and the energy is at 2313 cm-1.
The vibrational energy of the lowest, doubly degenerate vibrational mode is at 365.024 cm-1 [33], similar to the energy in (Fig. 4). The Coriolis interaction between the two components of , described by , is large, close to the limiting case . It effectively shifts the levels of the ladder to lower energies and the energies of the ladder to higher energies. As a result, of is actually lower than . More importantly, levels with are near-degenerate, leading to pronounced interaction within . The interaction is highlighted in Fig. 4 for of and of . As a consequence of the Coriolis interaction within , the level spacing in is considerably smaller than in while it is larger in . Šimečková et al. [41] found evidence of a resonant , , interaction between , and , (Fig. 4) at . They analyzed the interaction approximately because only two slightly perturbed transitions in the ground vibrational state ( and 39) were observed.
Other global interactions within an isolated degenerate vibrational mode of a strongly prolate rotor are rare, in contrast to nearly spherical or oblate rotors, see, e.g. Ref. [70] and references therein.
The basic features of the level structure of are similar to those of , the main difference being three components, instead of two. Pronounced interaction occurs also within , in particular between and at low with a resonant interaction of and of , as shown in Fig. 4. In addition, the level structure in is irregular at low with being lowest in energy and still slightly below . Such irregular level structure in states such as may lead to local perturbations within the vibrational state with, e.g., , (), , (), etc. In the case of several different such local perturbations, indeterminacies, as investigated in Ref. [70] and references therein, may need to be considered. A global effect may be caused by a , interaction (). However, this effect is rather small in a strongly prolate rotor, and was barely determined for of propyne [51].
| (rot) | 89/89 (89) | 88/75 (45) | 88/75 (8) | 88/68 (20) | 88/68 (20) | 88/68 (20) |
|---|---|---|---|---|---|---|
| (rot) | 21/21 (21) | 19/13 (7) | 17/11 (7) | 19/12 (12) | 13/8 (7) | 11/8 (6) |
| no. of rot linesb | 316/225 (196) | 596/c (58) | 527/c (37) | 424/85+5d (18) | 546/73+6d (24) | 299/45+5d (9) |
| rms errore | 0.859/0.911 | 0.807/ | 0.796/ | 0.982/ | 0.915/ | 0.957/ |
| (IR) | / ()f | 71/71 (71) | 74/74 (74) | 66/65 | 53/37 | 66/57 |
| (IR) | 7/7 (7) | 11/11 (11) | 11/11 (11) | 12/10 | 2/4 | 7/4 |
| no. of IR linesb | 5/5 (5)f | 836/g (836) | 861/g (861) | 935/944 (0) | 40/44h (0) | 197/122h (0) |
| rms errore | 0.716/0.643 | 0.826/ | 0.797/ | 0.771/ | 0.849/ | 0.727/ |
a Previous data from Refs. [27, 33, 42] and references therein for , , and
, respectively.
b Each blend of lines counted as one line. Hyperfine splitting in the present and previous data was considered in the present fit.
Transitions with of -doubled states associated with and , respectively, in the present data set.
Lines, which were weighted out, are not counted. Transitions between vibrational states were counted for higher vibrational state.
c Only total number given as 187.
d Numbers after the plus were given zero weight in Ref. [42].
e No rms error was given in Refs. [33, 42]; we assume parameter uncertainties are based on standard errors,
i.e. the rms error is 1.0 by definition. The rms errors for data from Ref. [27] were calculated from the experimental data
available at http://www.astro.uni-koeln.de/site/vorhersagen/daten/CH3CN/CH3CN/gs/.
f No individual loops were given in Ref. [32]. We used the five splittings from Table II
in that work with the reported uncertainties.
g Only total number given as 1705. Slight difference to our numbers mainly because of blended lines, see subsubsection 3.3.2.
h 52 assigned hot band transitions are mentioned in Ref. [42]; see subsubsection 3.4.3.
3.2
Recently, we have revisited the ground state rotational spectrum of several isotopic species of methyl cyanide [27]. Besides new data, ground state transition frequencies for the main species were mainly taken from Ref. [28] with additional lower frequency data [29, 30, 31]. The and quantum numbers extended to 89 and 21, respectively, see also Table 2.
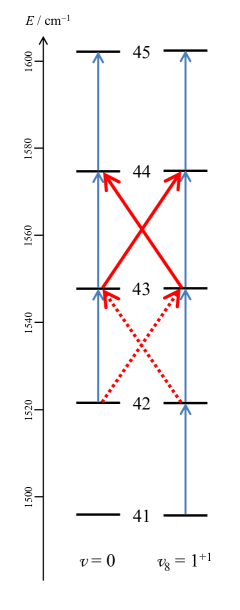
The first objective and the main achievement of the present study with respect to the ground vibrational state was the detailed analysis of the resonance between and mentioned in the previous subsection. Absorption features pertaining to , , to 49 and to , , to 45 and 47 to 49 could easily be assigned in our spectral recordings because of their intensities. Moreover, the perturbed transitions showed regular and mostly small displacements from predictions which did not take the interaction into account. The largest shifts were 24 MHz and 16 MHz for the and transitions, respectively. After these data had been included in the fit, two pairs of cross ladder transitions between the two vibrational states were predicted to have sufficient intensities for observation. The weaker pair with were identified, but the ones with , predicted to be stronger by about a factor of 2.5 than the former ones, were blended with stronger lines. Fig. 5 shows a detail of the energy levels around the levels perturbed most by the interaction between and as well as the observed transitions.
The measurements in Köln between 1.33 and 1.5 THz closed a considerable part of the gap between 1.2 and 1.6 THz in the previous data set [27]. We reanalyzed also the spectra between 1.1 and 1.2 THz taken at JPL and realized that the uncertainties were very similar to those of Ref. [28], albeit with a slightly better coverage and extending to slightly higher . Therefore, we employed the JPL data in our present analysis.
We also attempted to assign rotational transitions with . Their predicted uncertainties were small enough to identify them easily if the distortion dipole moment was as large as D. However, even then they could be blended with stronger methyl cyanide transitions, of which several are not yet assigned. No assignments could be made, leading us to conclude that the distortion dipole moment is probably smaller. It is also possible that the calculated uncertainties of these transitions are too small.
3.3
3.3.1 Rotational data
The rotational spectrum of CH3CN in its lowest vibrational state ( cm-1) was reported on several occasions [35, 36, 37, 38]. The data [37] had residuals in part much larger than the reported 50150 kHz uncertainties already in the initial report, which were confirmed here. Therefore, and because of their more limited range, we omitted these data from our line list. The laser side-band measurements [38] were also quite limited in and in accuracy (around 1 MHz) and were superseded by our more accurate data. Part of the lower frequency data up to 150 GHz [35, 36] was also superseded by our data, the remainder was retained in the fit with reported uncertainties. We also used in our fit direct -type transitions between the components [39, 40].
The interaction between and was already described in subsection 3.2. Interactions of with any higher vibrational states have not been reported in the literature prior to the present investigation.
Based on the studies on propyne [50, 51], we expected an interaction between and at slightly higher than 12 because of the slightly larger vibrational energy difference in methyl cyanide compared to propyne, 374.12 cm-1 compared to 340.41 cm-1. Inspection of the energy levels of these CH3CN vibrational states indicated a resonant interaction to occur at , see Figs. 4 and 6. Using the value of the main Fermi parameter from the propyne study [50, 51] was a reasonable initial guess along with published parameters for . Our final results suggest the interaction to be strongest at and 92, however, the highest assignments presently reach for either state at these rather high values of . The magnitudes of the perturbations between and showed strong variations with , as expected, but also with , most likely because the energy differences between the two vibrational ladders also change significantly with . The perturbations exceed 1 MHz at , and reach 37 MHz at . At , perturbations in the spectrum larger than 1 MHz were already seen at , and the shift exceeded 300 MHz at .
The data set up to revealed perturbations in of which were not accounted for by this , , Fermi interaction. They were caused by a , , interaction with of (Figs. 4 and 6), the same type of interaction as between and . It is shown in Fig. 7 that the strongest mixing occurs at and 53. Among the four transitions with , the transition was too close to the lower frequency limit of its experimental spectral window, the transition was observed with a total perturbation of 1.8 GHz. In addition, both cross ladder transitions were observed, but one was too close to a stronger line to determine a reliable and sufficiently accurate transition frequency. In addition, the transition frequencies were determined for both vibrational states.
The same type of interaction showed noticeable effects in the spectrum at higher (up to 49) between of and of , see also Figs. 4 and 6, with the largest perturbation at , as shown in Fig. 7. The regular rotational transitions were detected for both vibrational states in the case of , both cross-ladder transitions were detected for . The total perturbations amounted to more than 1.5 GHz for the former two transitions and more than 3.0 GHz for the latter two. The remaining associated transitions were about an order of magnitude weaker and were not identified.
We mention for completeness a , , interaction between of and of whose strongest effects are currently predicted at . Should the interaction cause any measureable perturbation in the spectrum, it should be very localized because of the high order of the interaction. A , , interaction is possible between of and of , but these levels are so high in energy that they are unlikely to be accessed.
The overall coverage of our is indicated in Table 2. Besides the few cross-ladder transitions between and 2, the data are limited almost entirely to regular rotational transitions. Transitions between different components may occur because of mixing facilitated by . Such transitions were predicted to be very weak, and only one transition was identified, so we view this identification as tentative. We also searched for transitions, but, as in the case of the ground vibrational state, were unable to identify any with sufficient certainty.
3.3.2 The band
An investigation of was reported in Ref. [33], and we use the line list from that work as indicated in subsection 2.3. Lines with full weight were assigned uncertainties of 0.0002 cm-1, except for the small number of lines, for which 0.0004 cm-1 were used because of their persistent larger residuals in the fits. Lines with weight 0.1 were assigned uncertainties of 0.0006 cm-1. A few lines (around 10 to 20) with weight 0.1 were omitted either because of very large residuals or because the line was blended, but was the weaker line, and the stronger line was not in the line list. In other rare cases, blended lines () were treated as intensity-weighted averages. The effects caused by these differences in the previous and present line list on the parameter values, uncertainties and on the quality of the fit are probably negligible.
3.4
3.4.1 Rotational data
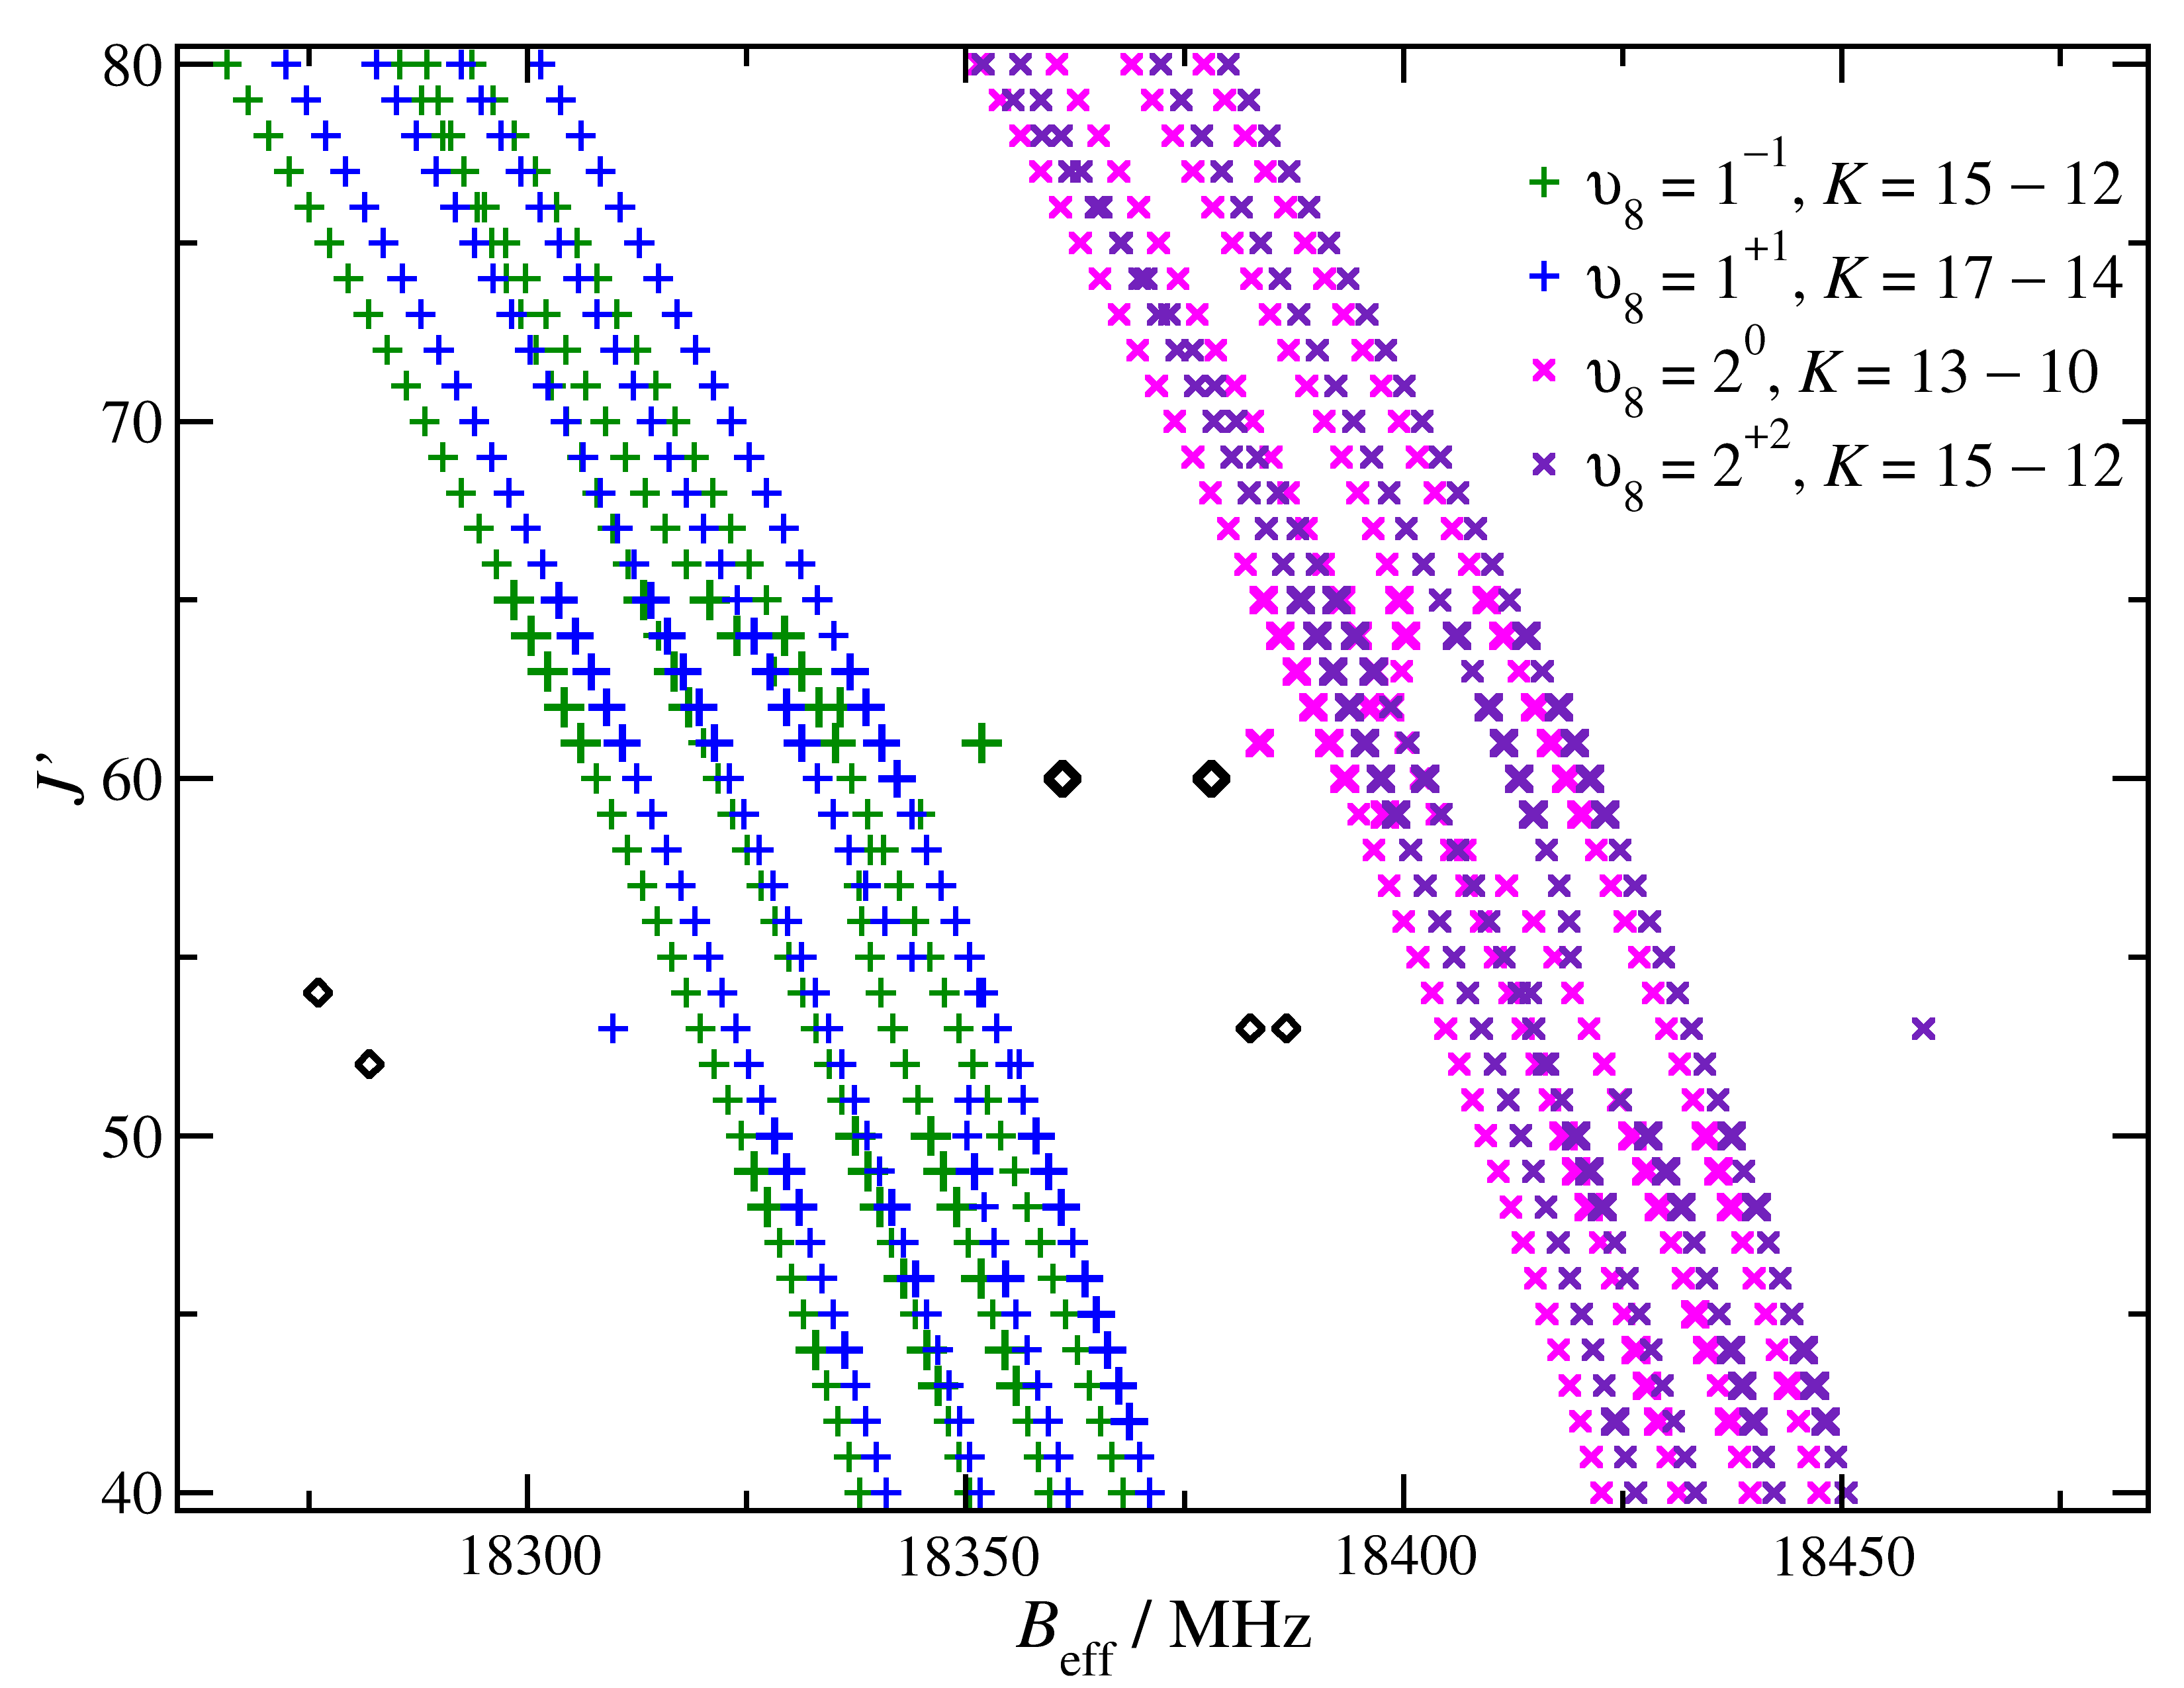
The rotational spectrum of methyl cyanide in its excited vibrational state was also studied extensively. As for , the lower frequency data up to 112 GHz [36, 46, 47] were in part superseded by new data taken in Cologne; see Fig. 8 for an overview of the transition. The remaining data were used in the final fit with reported uncertainties. The data from Ref. [37] had reported uncertainties of 50150 kHz, though not specified. They fit on average to within 100 kHz and were retained in the final fit with assigned uncertainties of 100 kHz. The laser-sideband data [38] were not retained in the fit for the same reasons as in the case of .
Interactions between and 2 were described in subsection 3.3.
The energy difference between and is 203.54 cm-1, rather large for a resonant Fermi interaction to occur. A , interaction between of and of was considered in the analysis of the band [45]. We determined a resonance to occur at . Our closest transition is which is calculated to be shifted by 350 MHz, see Fig. 9. A (), interaction, resonant at , was identified here for the first time. Our closest transitions are and with calculated shifts of about 20 MHz and 25 MHz, respectively.
Even though the energy difference between and is 302.71 cm-1, much larger than the difference between and , the Coriolis interaction within the components of and lead to a , Fermi resonance at of and , which caused perturbations in the band [45]. We were able to assign transitions up to in . Effects of this Fermi resonance were clearly present, but they were not sufficient to separate them reliably from the stronger Fermi resonance of with occuring at .
A , resonant interaction between of and of near shows no effects in the spectrum up to . At higher , the intensities of these high energy lines are just too small to be identified reliably in our present spectral recordings. An identical type of interaction may occur at and 15 of and and 13 of , however, we have no assignments yet for such high energy transitions.
Fermi interactions between and 2 may also occur between and 3. There are , , Fermi resonances between and at and between and at ; a resonant interaction may occur for the latter at , currently predicted at . In the case of , our assignments extend to and to for . These levels are perturbed sufficiently, up to more than 20 MHz and almost 30 MHz, respectively, to evaluate the corresponding Fermi parameters.
, , interactions are expected to occur between and 3 at , and , ; at , and , ; and at , and , . One tentative assignment exists for the latter interaction. In addition, we have 6 assignments extending to as high as of , but several have residuals slightly larger than the estimated uncertainties, which may be explained by unregnonized overlap with other transitions, by perturbations of one or both rotational levels, or by underestimation of the uncertainties.
We should point out that there may be interactions even higher in or , but we do not have evidence or data for these at present. No attempts were made to locate interations of with vibrational states higher than . Such interactions may be non-negligible, but most likely at levels with few or no assignments in our present data set.
3.4.2 The 2 band
Transition frequencies were determined entirely from our new IR spectrum since Ref. [42] did not report their experimental values.
The strongly allowed transitions in the IR band are those with . The quantum numbers reach 12, higher by 2 than in the previous study [42], while the maximum value of is essentially identical, 66 versus 65. As in the previous study, we were unable to make any assignments in the perpendicular , component, which is only weakly allowed, but we were able to make numerous assignments to levels in the component which gain intensity through mixing. This mixing is particularly strong for of and of with the former being lower in energy at low- until the energy ordering changes at . As a consequence, many and IR transitions were asssigned covering most of the from 8 to 62. It is interesting to note that the mixing of these levels changes only slightly between adjacent levels such that rotational transitions between these mixed levels are too weak to be observed with the exception of those at the change of the energy ordering. As also shown in Table 2, the IR assignments to cover mostly to 3 with several assignments and few higher ones, those to cover mostly to 2; a few sparse higher- assignments are viewed as tentative and were weighted out in the final fit.
Isolated lines with sufficiently good signal-to-noise ratio were given uncertainties of 0.0002 cm-1, as in the case of . Noisier lines or lines in more crowded regions, such as in the -branch, were given larger uncertainties of 0.0003 cm-1 to 0.0010 cm-1.
We were also able to make assignments in the hot band and in the difference band, as was done earlier [42]. The latter band gains intensity because of an anharmonic resonance between and [42]. We will publish our detailed account on these states separately. Judging from the observation of transitions in with , we may be even able to make assignments in .
3.4.3 The hot band
Because of the strength of the band, little can be gained from the analysis of the hot band. On the other hand, IR transitions to are limited to those which gain intensity through interaction, see previous subsubsection. These transitions belong to the component for the most part. According to Koivusaari et al. [42], transitions of are frequently overlapping each other or are blended with cold band transitions. Nevertheless, they made 52 -branch assignments with . 50 of these assignments were made in the component of of which 6 had zero weight. Since no IR transition frequencies were published in Ref. [42], we searched our spectra for suitable hot band transitions. Unfortunately, the congestion of the spectral lines and the quality of the spectra were such that only few lines could be assigned with certainty.
| Parameter | ||||||||
|---|---|---|---|---|---|---|---|---|
| c | 0 | .0 | 365 | .024 365 (9) | 716 | .750 42 (13) | 739 | .148 225 (56) |
| 148 900 | .103 (66) | 115 | .930 (26) | 187 | .404 (18) | 259 | .956 (122) | |
| 9 198 | .899 167 (11) | 27 | .530 277 (49) | 54 | .057 316 (111) | 54 | .502 729 (70) | |
| 2 830 | .6 (18) | 11 | .46 (48) | 20 | .19 (34) | 7 | .45 (164) | |
| 177 | .407 87 (25) | 0 | .987 48 (60) | 1 | .675 5 (25) | 1 | .808 8 (15) | |
| 3 807 | .576 (8) | 95 | .599 (17) | 216 | .319 (37) | 189 | .162 (31) | |
| 164 | .6 (66) | 14 | .9 (22) | |||||
| 6 | .062 0 (14) | 0 | .034 1 (22) | 0 | .150 3 (239) | 0 | .024 9 (55) | |
| 1 025 | .69 (15) | 2 | .59 (6) | 17 | .71 (34) | 0 | .37 (21) | |
| 237 | .4 (21) | 315 | .3 (30) | 200 | .7 (63) | 627 | .8 (59) | |
| 444 | .3 (25) | |||||||
| 52 | .75 (51) | |||||||
| 7 | .901 (32) | |||||||
| 3 | .10 (17) | 2 | .64 (20)d | 5 | .28 (40)d | 5 | .28 (40)d | |
| 552 | . (68) | |||||||
| 55 | .3 (22) | |||||||
| 4 | .223 08 (107) | 0 | .038 7 (19)d | 0 | .077 4 (38)d | 0 | .077 4 (38)d | |
| 0 | .1519 (113) | |||||||
| 1 | .845 (90) | |||||||
| 1 | .15 (31) | |||||||
| 138 656 | .195 (73) | 138 656 | .042 (102) | |||||
| 10 | .332 9 (72) | 10 | .405 1 (98) | |||||
| 0 | .390 469 (7) | 0 | .394 512 (6) | |||||
| 834 | . (41)d | 834 | . (41)d | |||||
| 34 | .057 (64)d | 34 | .057 (64)d | |||||
| 2 | .359 5 (24)d | 2 | .359 5 (24)d | |||||
| 2 | .59 (17)d | 2 | .59 (17)d | |||||
| 0 | .508 5 (63)d | 0 | .508 5 (63)d | |||||
| 17 | .798 438 (23) | e | 17 | .729 857 (138)e | ||||
| 2 | .664 5 (111) | e | 2 | .615 3 (89)e | ||||
| 63 | .842 (14) | e | 68 | .668 (31)e | ||||
| 93 | .19 (53)d | e | 93 | .19 (53)d,e | ||||
| 311 | .5 (15) | e | 191 | .9 (26)e | ||||
a Numbers in parentheses are one standard deviation in units of the least significant figures.
Empty entries indicate parameter not applicable or not used in the fit. See section 4 for sign and value considerations.
b Parameter given for ; , with representing an excited
vibrational state.
c All parameters given in units of megahertz, except for , which is given in
units of inverse centimeters.
d Ratio kept fixed in the fit for respective or .
e The parameter and its distortion corrections connect levels with ,
see subsection 3.1 and section 4.
3.5 Remarks on higher vibrational states
The vibrational state interacts with , with , and with . Therefore, we need to take into account previously determined parameters for these states [45], which involve interactions among these three vibrational states.
There is a Coriolis interaction between and which will be resonant at or slightly higher for , too high to be observed easily. Another interaction occurs between of and of .
An anharmonic resonance occurs at of and . Another, stronger anharmonic resonance occurs at of and . Inspection of preliminary energy levels involving these states suggest a plethora of further interactions among these states. Such interactions are also possible with states of the next polyad consisting of , , , , and [69].
4 Determination of spectroscopic parameters
Pickett’s SPCAT and SPFIT programs [71] were used for prediction of the CH3CN spectra and for fitting of the measured data. The programs were intended to be rather general, thus being able to fit asymmetric top rotors with spin and vibration-rotation interaction. They have evolved considerably with time because many aspects were not available initially [72, 73], in particular special considerations for symmetric or linear molecules or for higher symmetry cases. Spectra of symmetric top rotors with excitation of one [51, 74] or two quanta of a degenerate vibrational mode [51] were fit successfully with SPFIT. The -doubling is implemented as mod 3, thus are identified with . Hence, , the Coriolis interaction parameter between the -components of and equals and , respectively. In fact, the Coriolis term enters the Hamiltonian as , see, e.g., Eq. (1) in Refs. [33] and [42]. The - and -dependent distortion parameters to are usually defined without the factor of , hence equals and for and , respectively, and so on. Similarly, e.g., and , are the coefficients of and , respectively. When they act as Coriolis parameters between two interacting states, the values from SPFIT often equal twice the values from other fitting programs. This is likely a consequence of the definition of which is approximately equal to . designates a Fermi (more generally anharmonic) interaction parameter. or as sub- or superscripts represent, as usual, corresponding distortion corrections. , , and are the coefficients of operators which connect levels with higher by 2 than , , and , respectively, and with modified accordingly to meet the symmetry condition mod 3. I.e. is defined for a parameter as coefficient of , with being the anticommutator. Interaction parameters between different vibrations are indicated by numbers in parentheses separated by a comma; the degree of excitation and the quantum numbers are also given if necessary. The most important interaction parameter with within a degenerate vibrational state of a strongly prolate symmetric rotor is , also known as because it connects levels differing in . It can have large effects in particular in low-lying bending modes, in which the magnitude of often is close to the limiting case of 1.0, which will cause ample near-degeneracies. Scaling factors for depending on the -components and the vibrational excitation are not implemented in SPCAT and SPFIT. The values are and for and 2, respectively. We note that and its distortion corrections are sometimes defined negatively. This applies to the studies on methyl cyanide [33, 42, 45, 69] and propyne [50, 51, 52]. Therefore, we inverted the signs and added footnotes to the appropriate tables. We also note an additional factor of 2 in the definitions of , , etc. in the articles on propyne, causing the determined numerical values to be smaller than in SPFIT. However, none of these parameters were used in the IR studies of methyl cyanide relevant to our investigation [33, 42, 45, 69].
| Parameter | ||||||||
|---|---|---|---|---|---|---|---|---|
| c | 920 | .290 03 | 1 041 | .854 71 | 1 077 | .786 3 | 1 122 | .15 |
| 166 | .205 | 889 | .440 | 302 | .030 | 347 | .76 | |
| 46 | .148 22 | 5 | .734 13 | 80 | .294 85 | 81 | .289 | |
| 31 | .63 | 149 | .333 | 22 | .8d | 22 | .8d | |
| 7 | .165 | 0 | .973 1 | 3 | .504 6d | 3 | .504 6d | |
| 5 | .702 05 | 14 | .001 | 462 | .d | 462 | .d | |
| 22 | .24 | |||||||
| 13 | .895 | |||||||
| 315 | .68 | 148 | .1 | |||||
| 66 663 | .668 | 138 665 | .87 | 138 527 | .8 | |||
| 7 | .224 8 | 11 | .013d | 11 | .013d | |||
| 0 | .078 153 | 0 | .401 54d | 0 | .401 54d | |||
| 64 | .8 | |||||||
| 50 | .34 | |||||||
| 2 | .385 | 7 | .285d | 7 | .285d | |||
| 4 | .763 4 | 17 | .683d,e | 17 | .683d,e | |||
| 10 | .85 | 75 | .79d,e | 75 | .79d,e | |||
a Empty entries indicate parameter not applicable or not used in the fit.
Signs of and altered, see section 4.
b Parameter difference , given for rotational and distortion parameters
( represents an excited vibrational state).
c All parameters given in units of megahertz, except for , which is given in
units of inverse centimeters.
d Ratio kept fixed in the fit for parameter or .
e The parameter and its distortion corrections connect levels with ,
see subsection 3.1 and section 4.
We determined rotational, centrifugal, and hyperfine structure (HFS) parameters of the ground state as common for all vibrational states. As most of the data, in particular the IR data, were not affected by HFS, all states were defined twice, with and without HFS. Vibrational changes , where represents a parameter and the parameter in an excited vibrational state. This is very similar to several previous studies on CH3CN [33, 42, 45, 69] and rather convenient because vibrational corrections are usually small with respect to especially for lower order parameters . In addition, this offers the opportunity to constrain vibrational corrections to to twice those of , thus reducing the amount of independent spectroscopic parameters further.
The degenerate vibrational states required and to be used in the fit with centrifugal distortion corrections as far as needed. Several of the distortion corrections between and 2 were constrained to be identical. Fitting of our new low frequency data of required to be used in the fit, the quadrupole parameter equivalent to . We assumed that the value determined by SPFIT is
Starting values for the parameters of , , and , were taken from Refs. [27, 33, 42]. Parameters describing the triad around 1000 cm-1, , , and , were taken from Ref. [45] and were kept fixed with the exception of one rotational interaction parameter between and .
Parameters were introduced newly to the fit, or a constraint was released, if the rms error (as the measure of the quality of the fit) was reduced by an amount deemed significant and if the new parameter was useful in the Hamiltonian and if the resulting value(s) appeared to be reasonable. The latter aspect was a difficult one because vibrational corrections to some higher order parameters were of similar magnitudes as the parameters themselves and because some vibrational changes to or were rather different from twice the corresponding vibrational change to . In most instances, care was taken to search for the largest reduction of the rms error. In almost all instances, this led to parameters determined with high significance, i.e. their values were more than five times larger in magnitude than their uncertainties. In few cases, parameters not determined with high significance were kept in the fit because the uncertainties were of similar magnitudes as those for other vibrational states.
Concerning the interactions between and 2, we determined distortion corrections and to the main Fermi term , whereas was not determined with significance. We estimated its value by assuming . Once both parameters were well-determined, their ratio was essentially 2 within the uncertainties. Therefore, the ratio was constrained to reduce the number of independent parameters. No distortion corrections could be determined for the Fermi terms associated with the interactions between and 3, so the and distortion corrections were fixed to appropriate multiples of the values determined for the /2 resonance. Trial fits with yielded values or constraints which were in some cases much smaller than those in the /2 resonances with essentially no effect on the quality on the fit. These parameters were omitted from the final fits.
The parameter (for ) had little effects on the rms error in most trial fits and was not determined with significance. It seemed to be determined in some trial fits, but its magnitude appeared to be too large with respect to that of of propyne [51]. Moreover, changes in some of the remaining spectroscopic parameters were deemed too large in these cases. Therefore, was omitted from the final fit.
| Parameter | Value | |
|---|---|---|
| 70 | .897 (27) | |
| 53 157 | .7 (33) | |
| 6 | .b,c | |
| 369 | .89 (44)b | |
| 1 | .681 (87)b | |
| 65 | .491 (24)d | |
| 130 | .982 (48)d | |
| 8 | .736 2 (21) | |
| 7 | .98 (16) | |
| 45 170 | .8e | |
| 77 208 | . (93) | |
| 91 509 | . (131) | |
| 909 | .e | |
| 1 | .84e | |
| 11 430 | .e | |
| 50 129 | .2e | |
| 2 239 | .1e | |
a Alternative designations from Ref. [45] given in brackets.
Numbers in parentheses after the interaction parameter designate the vibrational
states separated by a comma, see also section 4. Numbers in
parentheses after the values are one standard deviation in units of the least
significant figures.
b and distortion corrections to and
kept fixed to and , respectively, times the corresponding
value; see, e.g., Ref. [51].
c Estimated assuming , see section 4.
d Ratio constrained, see section 4.
e Kept fixed to values from Ref. [45].
| Parameter | Present | Ref. [33] | Present | Ref. [42] | Present | Ref. [42] | ||||||||
|---|---|---|---|---|---|---|---|---|---|---|---|---|---|---|
| c | 365 | .024365 (9) | 365 | .015965 (12) | 716 | .75042 (13) | 716 | .70441 (1) | 739 | .14823 (6) | 739 | .12907 (3) | ||
| 88 | .400 (26) | 90 | .079 (36) | 133 | .347 (18) | 140 | .069 (39) | 205 | .453 (122) | 210 | .826 (96) | |||
| 27 | .53028 (5) | 27 | .53255 (33) | 54 | .05732 (11) | 54 | .07405 (54) | 54 | .50273 (7) | 54 | .50740 (90) | |||
| 11 | .46 (48) | 18 | .11 (81) | 20 | .2 (3) | 12 | .3 (10) | 7 | .5 (16) | 20 | .1 (42) | |||
| 0 | .9875 (6) | 0 | .8739 (129) | 1 | .6755 (25) | 1 | .3316 (69) | 1 | .809 (2) | 1 | .790 (39) | |||
| 95 | .599 (17) | 93 | .436 (69) | 216 | .32 (4) | 218 | .41 (18) | 189 | .16 (3) | 182 | .93 (24) | |||
| 14 | .9 (22) | 215 | .0 (51) | 384 | .3 (72) | |||||||||
| 0 | .034 (2) | 0 | .908 (114) | 0 | .150 (24) | 0 | .025 (6) | |||||||
| 2 | .59 (6) | 35 | .74 (171) | 17 | .71 (34) | 0 | .37 (21) | |||||||
| 315 | .3 (30) | 200 | .7 (63) | 627 | .8 (59) | |||||||||
| 2 | .64 (20)d | 5 | .28 (40)d | 5 | .28 (40)d | |||||||||
| 138 | .65620 (7) | 138 | .64715 (7) | 138 | .65604 (10) | 138 | .63733 (16) | |||||||
| 10 | .333 (7) | 10 | .448 (93) | 10 | .405 (10) | 10 | .448 (9) | |||||||
| 0 | .390469 (7) | 0 | .389679 (66) | 0 | .39451 (1) | 0 | .39420 (18) | |||||||
| 834 | . (41)d | 453 | . (174) | 834 | . (41)d | |||||||||
| 34 | .06 (6)d | 40 | .77 (90) | 34 | .06 (6)d | 46 | .8 (30) | |||||||
| 2 | .3595 (24)d | 2 | .6750 (111) | 2 | .3595 (24)d | 2 | .845 (45) | |||||||
| 15 | .23 (90) | |||||||||||||
| 2 | .59 (17)d | 2 | .59 (17)d | |||||||||||
| 0 | .509 (6)d | 0 | .509 (6)d | |||||||||||
| 17 | .79844 (2) | 17 | .79776 (11) | e | e | 17 | .72986 (14)e | 17 | .70068 (51)e | |||||
| 2 | .6645 (111) | e | e | 2 | .6153 (89)e | |||||||||
| 63 | .84 (1) | 63 | .80 (16) | e | e | 68 | .67 (3)e | 66 | .84 (17)e | |||||
| 93 | .19 (53)d | e | e | 93 | .19 (53)d,e | |||||||||
| 312 | . (2) | 324 | . (57) | e | e | 192 | . (3)e | |||||||
a Numbers in parentheses are one standard deviation in units of the least significant figures.
Empty entries indicate parameter not applicable or not used in the fit. See section 4 for sign and value considerations.
b Parameter difference given for rotational and distortion parameters ( represents an excited vibrational state).
Signs were adjusted to present definition for data from Refs. [33, 42]. In all instances, previous values refer
to the combined fits of IR and rotational data.
c All parameters given in units of megahertz, except for , which is given in
units of inverse centimeters.
d Ratio kept fixed in the fit for respective or .
e The parameter and its distortion corrections connect levels with ,
see subsection 3.1 and section 4.
5 Discussion
Our present ground state spectroscopic parameters are very close to those of our previous study [27]; differences outside three times the experimental uncertainties occur only in , , and . The experimental data associated with the / perturbation help to constrain the level structure in the ground vibrational state, additional contributions may come from the data involving the / perturbations. As a consequence, we obtained a precisely determined value for as Hz. The agreement with Hz from an earlier study [32] is good, though the large uncertainty in the earlier study limits the value of the agreement somewhat. Our previous estimate of 51 Hz, derived by scaling with the ratio as an order-of-magnitude estimate, was apparently too small.
As can be seen in Table 6, the extensive new rotational data pertaining to and 2 allowed us to determine spectroscopic parameters or changes thereof up to higher order than previously [33, 42]. The uncertainties of many lower order parameters were improved in addition.
The previous and present spectroscopic parameters agree reasonably at lower order and particularly for those with dependence on . The agreement deteriorates for higher order parameters, especially those dependent on . Consideration of the resonances between and 2 as well as between and 3 affected the purely -dependent parameters significantly, very similar to the case of propyne, where the Fermi interactions involving the equivalent band occur at slightly lower [50, 51]. As in the case of propyne, we did not require to be included in the fit. Comparison of the various parameters from our study as well as those from Ref. [33] suggests that the magnitude of reported in that study is at least a factor of 100 too large. Similarly, the previous value of in CH3CN was Hz [33], whereas our value is Hz; in addition, a value of Hz was reported for , in Ref. [33], whereas we obtained a value similar to that in in trial fits. However, the uncertainties were only slightly smaller than the values, so was omitted in the final fit.
The vibrational changes in distortion parameters from to in Table 3 are often small, though not in all instances. The rather large changes in and are common in these types of molecules. In fact, the changes of upon excitation of each of the two low-lying bending modes are even larger in magnitude in propyne [51]. Excitation of the CCN bending mode leads also to large changes in of HC3N [77], DC3N [78], or other, similar molecules.
The changes of rotational and centrifugal distortion parameters from ground state values in and are roughly twice those in , though pronounced deviations occur already in (or ). The similarity to related values in propyne [50, 51] and methyl isocyanide [75, 76] may indicate that the low energies of the vibrations lead to substantial changes in with different quantum number. Changes upon excitation in are closer to the ratio of 2 in , but deviations increase, in particular for the changes in the values. These deviations may be caused by the incomplete analysis of the /3 or other resonances.
The values are essentially identical between and . The changes in and are rather small, and higher order parameters were constrained to the same values. The values are rather similar also, whereas the values differ considerably, possibly again a consequence of a not or not fully accounted interaction.
With respect to the perturbation of the ground vibrational state by , Šimečková et al. [41] calculated perturbations of about 45 MHz and 36 MHz for the two ground state transitions involving and , this is about 20 MHz larger than actually observed. The difference can be traced almost entirely to the energy differences between the two perturbing levels at , which was estimated to be 0.013 cm-1 [41] whereas our calculations yield 0.025 cm-1. Our value of , MHz agrees quite well with MHz from the combined analysis of IR and rotational data or with MHz from an analysis of IR data only [45]. We should point out that the sign cannot be determined from the fit of the line frequencies, but it may be determinable from relative intensities in the rotational or IR spectra. The value given in Ref [45] was actually negative; we will try to determine the sign in our subsequent study which will include data. Other interaction parameters between different vibrational states were either determined for the first time here or were not released in our fits.
Selected low order spectroscopic parameters of CH3CN have been compared in Table 7 with corresponding values of CH3CCH and CH3NC. The data of CH3CN and of CH3CCH are comparatively similar, while those of CH3NC with its much lower bending mode are substantially different. The Fermi parameters between the first and the second bending state reflect these changes, and the values appear to scale approximately with .
and should ideally differ from by factors of and , respectively, see, e.g., Ref. [51]. The experimental values of MHz and MHz compare quite well with the expected values of 75192 MHz and 92091 MHz, respectively, in particular considering that there are no transition frequencies in the fit, and that we used spectroscopic parameters from a previous study for this state [45].
The lack of assignments in may limit the accuracies of the predicted line positions in the sub-band at higher . However, our data on the perturbations between and 2 may in part compensate these limitations.
| Parameter | CH3CNc | CH3CCHd | CH3NCe | |||
|---|---|---|---|---|---|---|
| 158 099 | . | 159 139 | . | 157 308 | . | |
| 9 198 | .9 | 8 545 | .9 | 10 052 | .8 | |
| 2 831 | . | 2 939 | . | 2 567 | . | |
| 177 | .4 | 163 | .4 | 227 | .5 | |
| 3 808 | . | 2 908 | . | 4 692 | . | |
| b | 365 | .0 | 330 | .9 | 267 | .3 |
| 88 | .3 | 61 | .9 | 0 | .6 | |
| 27 | .53 | 23 | .94 | 39 | .07 | |
| 138 656 | . | 141 919 | . | 146 007 | . | |
| 10 | .34 | 10 | .94 | 10 | .13 | |
| 390 | .5 | 334 | .8 | 587 | .6 | |
| 17 | .80 | 16 | .79 | 6 | .94 | |
| (b±1,b2,∓2) | 53 169 | . | 51 745 | . | 23 808 | . |
6 Expanded database for CH3CN line parameters
Compilations of CH3CN molecular line parameters are greatly expanded by including new or updated predictions of spectra within or between the three states of the present investigation. Predictions of rotational and infrared spectra for astrophysical applications will be available in the catalog section444https://cdms.astro.uni-koeln.de/classic/entries/ of the CDMS [1, 2] and that of JPL555http://spec.jpl.nasa.gov/ftp/pub/catalog/catdir.html [79]. The parameter, line, fit and other auxiliary files are available online as supplements with the publication and in the Cologne Spectroscopy Data section666https://cdms.astro.uni-koeln.de/classic/predictions/daten/CH3CN/CH3CN/ of the CDMS. For remote sensing of, e.g., Titan, the new compilation will also be provided to HITRAN [64] and GEISA [80] with N2-pressure and self-broadening information included. For this, the extensive pressure broadening CH3CN measurements of and branch transitions of [68] were modeled by extending empirical expressions applied to ammonia [81, 82]. The resulting polynomial has no physical meaning, but it does provide reasonable estimates of Lorentz broadening coefficients for CH3CN transitions.
| , | , | Frequency | Self-broadened width | , | |
|---|---|---|---|---|---|
| obs. (%unc.) | calc. (%diff.) | ||||
| 2, 1 | 3, 1 | 918.43291 | 1.358 (0.7) | 1.2588 (7.88) | 3, 1 |
| 3, 1 | 2, 1 | 922.10564 | 1.307 (1.0) | 1.2588 (3.83) | 3, 1 |
| 7, 6 | 8, 6 | 915.09499 | 1.071 (0.7) | 1.0798 (0.82) | 8, 6 |
| 8, 6 | 7, 6 | 924.88187 | 1.039 (0.9) | 1.0798 (3.78) | 8, 6 |
| 18, 9 | 19, 9 | 907.67687 | 1.722 (0.5) | 1.6957 (1.55) | 19, 9 |
| 19, 9 | 18, 9 | 930.89430 | 1.711 (0.7) | 1.6957 (0.90) | 19, 9 |
| 22, 7 | 23, 7 | 905.12404 | 1.773 (0.4) | 1.7497 (1.33) | 23, 7 |
| 23, 7 | 22, 7 | 933.24349 | 1.821 (0.6) | 1.7497 (4.07) | 23, 7 |
| 28, 0 | 29, 0 | 901.25148 | 1.583 (0.5) | 1.5807 (0.15) | 29, 0 |
| 29, 0 | 28, 0 | 936.73087 | 1.528 (0.5) | 1.5807 (3.33) | 29, 0 |
| 40, 4 | 41, 4 | 892.54529 | 0.896 (0.7) | 0.8737 (2.55) | 41, 4 |
| 41, 4 | 40, 4 | 942.65553 | 0.823 (0.8) | 0.8737 (5.81) | 41, 4 |
a The measured values are taken from Ref. [68].
6.1 Pressure-broadened half widths
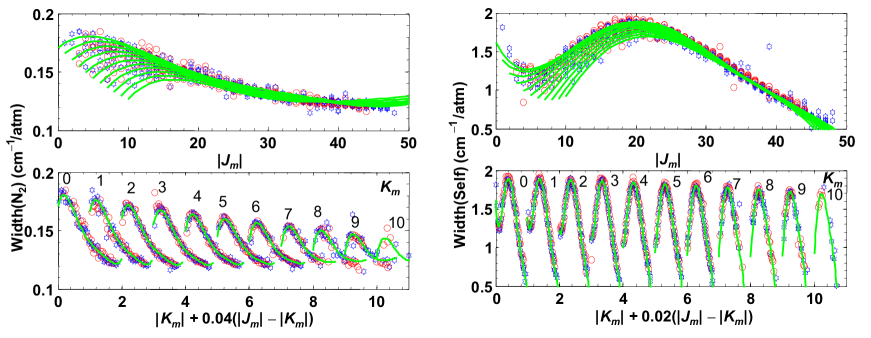
The measured N2- and self-broadened halfwidths (HWHM) for CH3CN in the band at 920 cm-1 vary smoothly with respect to their quantum numbers and [68]. Patterns become more obvious when the widths are examined as a function of values related to the transition quantum numbers; these are defined as , for branch transitions, and , for and branch transitions. Examples are shown in Table 8. N2- and self-broadened half widths were derived for our CH3CN compilation by modeling the reported widths for the band [68] according to the expression in Eq. 1; the polynomial coefficients are listed in Table 9.
| (1) |
| Coefficients | N2 | Self | ||
|---|---|---|---|---|
| 0 | .171 | 1 | .621 | |
| 4 | .731 | 172 | .4 | |
| 9 | .962 | 82 | .99 | |
| 0 | .7152 | 26 | .32 | |
| 1 | .704 | 18 | .89 | |
| 1 | .233 | 14 | .42 | |
| 0 | .03155 | 1 | .28 | |
| 0 | .1068 | 1 | .296 | |
| 0 | .1361 | 0 | .7237 | |
| 0 | .002544 | 0 | .1243 | |
| 0 | .6094 | 24 | .83 | |
| 2 | .643 | 34 | .66 | |
| 3 | .849 | 10 | .5 | |
| 1 | .819 | 9 | .179 | |
| 4 | .388 | 171 | .6 | |
| 22 | .42 | 319 | .8 | |
| 33 | .41 | 66 | .99 | |
| 37 | .85 | 430 | .9 | |
The measured widths were weighted in the fit by the inverse of the square of the reported uncertainties [68]. The impact of a few outliers (at very low and higher and ) were suppressed as an important side-effect. As shown in Fig. 10, the calculated values using Eq. 1 (solid curves) reproduce the pattern of the measured data points within 5 % for most of the transitions. The full lists are given in Supplemental files 5_Width(N2)_CH3CN_v4.out and 6_Width(Self)_CH3CN_v4.out. Finally, we adopted this expression to estimate N2- and self-broadened half widths for the three IR bands, , , of the present study. Because the experimental lines, for which line widths were determined, have , we limited the line-widths at 296 K to:
cm-1/atm for N2-broadened half-widths, and
cm-1/atm for self-broadened half-widths.
6.2 N2-pressure-induced frequency shifts
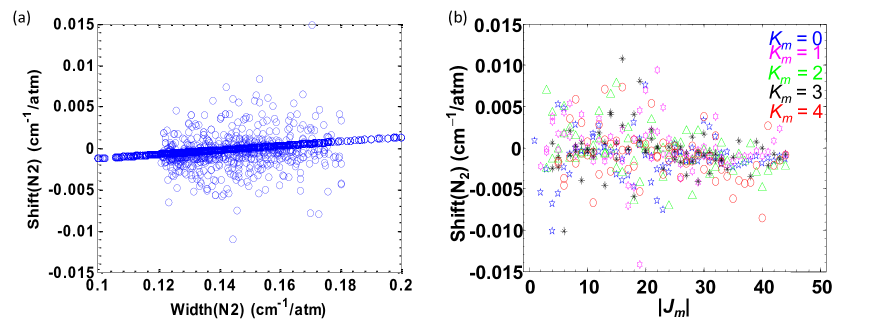
Rinsland et al. [68] also reported N2-pressure-induced frequency shifts for CH3CN in its band, but no distinctive pattern is seen for pressure shifts with respect to and . However, there was a significant correlation between measured line widths and frequency shifts, as presented in their Fig. 11 of Ref [68]. We use this observation in our present work to obtain frequency shift estimates for the transition of , , and . First, we apply a scaled set of the measured N2-induced frequency shifts for transitions for all other CH3CN transitions having the same set of quantum numbers, , , , and . However, not all transitions predicted in the present work have counter parts among the measured transitions; we assume for these cases that their N2-induced frequency shifts can be estimated from their pressure-broadened line widths using the width-shift relationship proposed by Rinsland et al. [68]. Based on Fig. 11 of Ref. [68], a simple expression was derived as
| (2) |
One commonly assumes that the overall magnitudes of the pressure shifts increase with increasing vibrational band centers [84]. We estimated the pressure shifts of from those of the band according to
| (3) |
with being the vibrational energy of , , or and that of .
The resulting N2-pressure shifts for the , , and bands are presented in Fig. 11a. The width-shift relationships resemble those observed in the band [68]. The distribution with respect to , shown in Fig. 11b, does not show a distinctive pattern, as was the case for [68].
6.3 Intensities of , , and
We evaluated transition dipole moments for each of the three IR bands of the present study. There are some indications that additional correction terms may lead to a better intensity modelling, especially in the cases of and . More sophisticated intensity modelling is beyond the aim of the present study, in particular because the quality of the IR spectrum in the region is not sufficient for such modelling.
| Integrated intensity | ||||||||||||||
| IR band | Calc. () | Calc. () | Ref. [66] | Ref. [67] | Ref. [85] | Ref. [86] | ||||||||
| 0 | .043 | 1 | .483 | 1 | .483 | |||||||||
| 0 | .043 | 0 | .251 | 0 | .244 | |||||||||
| 0 | .043 | 0 | .257 | 0 | .264 | |||||||||
| region | 2 | .285a | 1 | .77 (4) | 1 | .81 | 2 | .79 (28) | ||||||
| 0 | .030 | 1 | .674 | 1 | .585 | |||||||||
| 0 | .000 | 0 | .000 | 0 | .090 | |||||||||
| region | 2 | .580a | 2 | .63 (18) | 2 | .50 (4) | 3 | .43 | ||||||
a Estimated from the cold bands, and , by multiplication with the vibrational partition factor 1.5006 at 296 K. An increase of 2.677 % from other isotopic species was considered.
6.3.1
Our simulations on a line-by-line basis indicate that the spectrum is represented reasonably well by a transition dipole moment of D.
We calculated partition function values by summing over all states up to , , and . While the rotational contribution to the partition function at 296 K is well converged, the vibrational contribution is slightly truncated. We have estimated the truncation error classically, assuming a rigid rotor as well as a harmonic oscillator. This approximation in itself introduces some error, but we estimate it to be small with respect to the truncation error. The truncation leads to a corrections of 1.408 %. The resulting intensity, integrated over all lines, is given in Table 10. The integrated intensity in the entire region, i.e. with all hot bands, was estimated by multiplying the calculated intensity with the vibrational partition factor of 1.5006. An additional increase of the integrated intensity by 2.677 % was required because of the contributions of other isotopic species. There is a convention in HITRAN that intensities refer to a sample in natural isotopic composition. The resulting intensity is also given in Table 10. Our value is about half way between two lower values [67, 85] and one higher one [86].
6.3.2
We assumed transition dipole moments of D for both and components as for the cold band. This approximation appears to be valid well within the estimated intensity uncertainties of 4 %, see subsubsection 6.3.3. Fig. 12 shows the calculated contributions of the and subbranches.
As can be seen in Table 10, slightly more than 10 % of the total intensity in the region of methyl cyanide are caused by IR transitions originating in states higher than . Finding unblended lines among these will be difficult because this was already not easy for .
6.3.3
The relative precisions of measured intensities were checked using spectral comparisons. For example, the 731732 cm-1 interval in Fig. 2 has 181 retrieved features with intensities ranging from to cm-2/atm at 293 K. Since the sample was a mixture, line intensities of the two calibration species were measured to obtain the partial pressures of OCS (3 %) and CO2 (0.4 %). In addition, selected strong CH3CN lines of the band were retrieved and compared to values reported in Table 2 of Ref. [68]; this indicated that the retrieved intensities in the 2 region should be increased by 4 %; with these calibrations, the overall (relative) precision is thought to be 0.0002 cm-1 for line centers and 5 % for intensities. However, worse precisions are expected for blended features separated by less than 0.0025 cm-1 and for 5100 absorptions weaker than cm-2/atm at 293 K.
Our simulations indicate that the spectrum is represented well by a transition dipole moment of D. See subsection 2.3 for considerations concerning the experimental intensities and subsubsection 6.3.1 for a remark on the partition function and on the sample composition. The integrated intensity from our Hamiltonian model is cm/molecule for the band alone. Only a small portion of this intensity, and cm/molecule is transfered through the interaction to the and components, respectively.
About 23 % of the intensity at 296 K should arise from the and bands. A preliminary analysis suggests that a fair fraction of these lines will not be blended by other lines of similar or higher intensity. Even some of the lines originating in states higher than , which account for slightly more than 10 % of the band intensity, may be usable for spectroscopic analyses. More work is needed to clarify these aspects.
7 Conclusions
Our extensive and accurate rotational data in vibrational states resulted in a parameter set extended to higher order and to mostly improved uncertainties at lower order. More importantly, these data enabled the first treatments of resonances between and 2, as well as between and 3. These resonances cause considerable perturbations in the rotational spectrum, and their successful treatments affect the spectroscopic parameters, in particular the -dependent ones and those at higher order. We have also performed the first in-depth analysis of the resonant interaction between the ground vibrational state and .
The analysis of a new spectrum was an additional important contribution to the determination of spectroscopic parameters. Only about half of the roughly 12000 lines in the spectrum are caused by the cold band. A large fraction of the unaccounted lines will be caused by the hot band and the difference band. Accounting for these will require in depth analysis of the / band system aided by rotational transitions. A still considerable fraction of lines are due at least in part to bands originating in states higher than .
We have derived line broadening and shift parameters for the , , and bands from previously determined values and have used this information to determine transition moments and intensities for the three IR bands. Individually measured transition intensities may lead to an improved intensity model.
We have generated an expanded database for CH3CN line parameters for transitions within each of the states , mainly for radio astronomical observations, in particular with ALMA and other interferometers. In addition, information is provided for transitions between these three states for remote sensing of, e.g., the atmosphere of Titan.
The inclusion of data pertaining to is almost complete. We intend to improve the data involving its interactions with other vibrational states. We want to study also the proposed strong, although distant, thus non-resonant Fermi interaction of with [43]. In addition, we have already made assignments in the IR band as well as for rotational transitions in , though these are often tentative. The spectra are perturbed, but, as it appears, only locally, such that a reasonable deperturbation may be possible by considering only spectroscopic parameters of the perturbing states.
Acknowledgements
H.S.P.M. is grateful to the Bundesministerium für Bildung und Forschung (BMBF) for financial support through project FKZ 50OF0901 (ICC HIFI Herschel) during part of the present investigation. The measurements in Köln were supported by the Deutsche Forschungsgemeinschaft (DFG) through the collaborative research grants SFB 494 initially, and later SFB 956, project area B3. The portion of this work, which was carried out at the Jet Propulsion Laboratory, California Institute of Technology, was performed under contract with the National Aeronautics and Space Administration. The infrared spectra analyzed in the present study were recorded at the W.R. Wiley Environmental Molecular Sciences Laboratory, a national scientific user facility sponsored by the Department of Energy’s Office of Biological and Environmental Research located at the Pacific Northwest National Laboratory (PNNL). PNNL is operated for the United States Department of Energy by the Battelle Memorial Institute under Contract DE-AC05-76RLO1830.
Appendix A. Supplementary Material
Supplementary data for this article are available on ScienceDirect (www.sciencedirect.com) and as part of the Ohio State University Molecular Spectroscopy Archives (http://library.osu.edu/sites/msa/jmsa_hp.htm). The parameter, line, and fit files along with a readme file are provided as well as the full tables of the modeling of N2- and self-broadening line widths of the band along with an explanation file. Supplementary data associated with this article can be found, in the online version, at http://dx.doi.org/10.1016/j.jms.2015.02.009.
References
- [1] H.S.P. Müller, S. Thorwirth, D.A. Roth, G. Winnewisser, Astron. Astrophys. 370 (2001) L49L52.
- [2] H.S.P. Müller, F. Schlöder, J. Stutzki, G. Winnewisser, J. Mol. Struct. 742 (2005) 215227.
- [3] A. Belloche, R.T. Garrod, H.S.P. Müller, K.M. Menten, C. Comito, P. Schilke, Astron. Astrophys. 499 (2009) 215232.
- [4] A. Belloche, R.T. Garrod, H.S.P. Müller, K.M. Menten, Science 345 (2014) 15841587.
- [5] D.R. Johnson, F.J. Lovas, C.A. Gottlieb, E.W. Gottlieb, M.M. Litvak, M. Guélin, P. Thaddeus, Astrophys. J. 218 (1977) 370376.
- [6] K. Demyk, H. Mäder, B. Tercero, J. Cernicharo, J. Demaison, L. Margulès, M. Wegner, S. Keipert, M. Sheng, Astron. Astrophys. 466 (2007) 255259.
- [7] H.S.P. Müller, A. Belloche, K.M. Menten, C. Comito, P. Schilke, J. Mol. Spectrosc. 251 (2008) 319325.
- [8] E. Gibb, A. Nummelin, W.M. Irvine, D.C.B. Whittet, P. Bergman, Astrophys. J. 545 (2000) 309326.
- [9] D.M. Mehringer, J.C. Pearson, J. Keene, T.G. Philips, Astrophys. J. 608 (2004) 306313.
- [10] A.M. Daly, C. Bermúdez, A. López, B. Tercero, J.C. Pearson, N. Marcelino, J.L. Alonso, J. Cernicharo, Astrophys. J. 768 (2013) 81.
- [11] A. Belloche, H.S.P. Müller, K.M. Menten, P. Schilke, C. Comito, Astron. Astrophys. 559 (2013) A47.
- [12] N.J. Livesey, J.W. Waters, R. Khosravi, G.P. Brasseur, G.S. Tyndall, W.G Read, Geophys. Res. Lett. 28 (2001) 779782.
- [13] A. Kleinböhl, G.C. Toon, B. Sen, J.-F.L. Blavier, D.K. Weisenstein, P.O. Wennberg, Geophys. Res. Lett. 32 (2005) L23807.
- [14] N.J. Livesey, M.D. Fromm, J.W. Waters, G.L. Manney, M.L. Santee, W.G Read, J. Geophys. Res. 109 (2004) D06308.
- [15] I.J. Simpson, S.K. Akagi, B. Barletta, N.J. Blake, Y. Choi, G.S. Diskin, A. Fried, H.E. Fuelberg, S. Meinardi, F.S. Rowland, S.A. Vay, A.J. Weinheimer, P.O. Wennberg, P. Wiebring, A. Wisthaler, M. Yang, R.J. Yokelson, D.R. Blake, Atmos. Chem. Phys. 11 (2011) 64456463.
- [16] P.M. Solomon, K.B. Jefferts, A.A. Penzias, R.W. Wilson, Astrophys. J. 168 (1971) L107L110.
- [17] B.L. Ulich, E.K. Conklin, Nature 248 (1974) 121122.
- [18] B. Bézard, A. Marten, G. Paubert, Bull. Am. Astron. Soc. 25 (1993) 1100.
- [19] H.E. Matthews, T.J. Sears, Astrophys. J. 267 (1983) L53L57.
- [20] S. Cazaux, A.G.G.M. Tielens, C. Ceccarelli, A. Castets, V. Wakelam, E. Caux, B. Parise, D. Teyssier, Astrophys. J. 593 (2003) L51L55.
- [21] M. Agúndez, J. P. Fonfría, J. Cernicharo, J. R. Pardo, M. Guélin, Astron. Astrophys. 479 (2008) 493501.
- [22] R. Mauersberger, C. Henkel, C.M. Walmsley, L.J. Sage, T. Wiklind, Astron. Astrophys. 247 (1991) 307314.
- [23] M. Gerin, F. Combes, G. Wlodarczak, T. Jacq, M. Guélin, P. Encrenaz, C. Laurent, Astron. Astrophys. 259 (1992) L35L38.
- [24] P.F. Goldsmith, R. Krotkov, R.L. Snell, R.D. Brown, P. Godfrey, Astrophys. J. 274 (1983) 184194.
- [25] S.M. Fortman, J. P. McMillan, C.F. Neese, S.K. Randall, A.J. Remijan, T.L. Wilson, F.C. De Lucia, J. Mol. Spectrosc. 280 (2012) 1120.
- [26] H. Ring, H. Edwards, M Kessler, W. Gordy, Phys. Rev. 72 (1947) 12621263.
- [27] H.S.P. Müller, B.J. Drouin, J.C. Pearson, Astron. Astrophys. 506 (2009) 14871499.
- [28] G. Cazzoli, C. Puzzarini, J. Mol. Spectrosc. 240 (2006) 153163.
- [29] S.G. Kukolich, D.J. Ruben, J.H.S. Wang, J.R. Williams, J. Chem. Phys. 58 (1973) 31553159.
- [30] S.G. Kukolich, J. Chem. Phys. 76 (1982) 97101.
- [31] D. Boucher, J. Burie, J. Demaison, A. Dubrulle, J. Legrand, B. Segard, J. Mol. Spectrosc. 64 (1977) 290294.
- [32] R. Anttila, V.M. Horneman, M. Koivusaari, R. Paso, J. Mol. Spectrosc. 157 (1993) 198207.
- [33] M. Koivusaari, V-M. Horneman, R. Anttila, J. Mol. Spectrosc. 152 (1992) 377388.
- [34] P. Venkateswarlu, J.G. Baker, W. Gordy, J. Mol. Spectrosc. 6 (1961) 215228.
- [35] A. Bauer, S. Maes, J. Phys. (Paris) 30 (1969) 169180.
- [36] A. Bauer, PhD thesis, Université de Lille, France, 1970.
- [37] R. Bocquet, G. Wlodarczak, A. Bauer, J. Demaison, J. Mol. Spectrosc. 127 (1988) 382389.
- [38] W. Chen, R. Bocquet, D. Boucher, J. Demaison, G. Wlodarczak, J. Mol. Spectrosc. 150 (1991) 470467.
- [39] W. Lafferty, J. Mol. Spectrosc. 25 (1968) 359364.
- [40] J. Cosleou, J.C. López, J.L. Alonso, G. Wlodarczak, J. Demaison, J. Mol. Spectrosc. 149 (1991) 242251.
- [41] M. Šimečková, Š. Urban, U. Fuchs, F. Lewen, G. Winnewisser, I. Morino, K.M.T. Yamada, J. Mol. Spectrosc. 226 (2004) 123136.
- [42] M. Koivusaari, A.-M. Tolonen, R. Paso, J. Schroderus, R. Anttila, J. Mol. Spectrosc. 160 (1993) 566573.
- [43] J.L. Duncan, D.C. McKean, F. Tullini, G.D. Nivellini, J. Perez Peña, J. Mol. Spectrosc. 69 (1978) 123140.
- [44] Y. Mori, T. Nakagawa, K. Kuchitsu, J. Mol. Spectrosc. 104 (1984) 388401.
- [45] A.-M. Tolonen, M. Koivusaari, J. Schroderus, S. Alanko, R. Anttila, J. Mol. Spectrosc. 160 (1993) 554565.
- [46] A. Bauer, S. Maes, C. R. Acad. Sci., Ser. B 268 (1969) 1569.
- [47] A. Bauer, J. Mol. Spectrosc. 40 (1971) 183206.
- [48] H.S.P. Müller et al. contribution WG03, presented at the 62nd International Symposium on Molecular Spectroscopy, June 18 22, 2007, Columbus, Ohio, USA; see also http://molspect.chemistry.ohio-state.edu/symposium_62/symposium/Abstracts/p074.pdf
- [49] M. Hermann, D.S. Perry, Phys. Chem. Chem. Phys. 15 (2013) 99709993.
- [50] H.S.P. Müller, P. Pracna, V.-M Horneman, J. Mol. Spectrosc. 216 (2002) 397407.
- [51] P. Pracna, H.S.P. Müller, S. Klee, V.-M Horneman, Mol. Phys. 102 (2004) 15551568.
- [52] P. Pracna, H.S.P. Müller, Š. Urban, V.-M Horneman, S. Klee, J. Mol. Spectrosc. 256 (2009) 152162.
- [53] P. Pracna, J. Urban, O. Votava, Z. Meltzerová, Š. Urban, V.-M. Horneman, Mol. Phys. 109 (2011) 22372243.
- [54] K. Yamada, J. Mol. Spectrosc. 81 (1980) 139151.
- [55] F. Hegelund, J. Bendtsen, J. Mol. Spectrosc. 124 (1987) 306316.
- [56] Z. Kisiel, L. Pszczółkowski, B.J. Drouin, C.S. Brauer, S. Yu, J.C. Pearson, J. Mol. Spectrosc. 258 (2009) 2634.
- [57] Z. Kisiel, L. Pszczółkowski, B.J. Drouin, C.S. Brauer, S. Yu, J.C. Pearson, I.R. Medvedev, S. Fortman, C. Neese, J. Mol. Spectrosc. 280 (2012) 134144.
- [58] B.J. Drouin, F.W. Maiwald, J.C. Pearson, Rev. Sci. Instr. 76 (2005) 093113
- [59] G. Winnewisser, A.F. Krupnov, M.Y. Tretyakov, M. Liedtke, F. Lewen, A.H. Saleck, R. Schieder, A.P. Shkaev, S.V. Volokhov, J. Mol. Spectrosc. 165 (1994) 294300.
- [60] L.-H. Xu, R.M. Lees, G.T. Crabbe, J.A. Myshrall, H.S.P. Müller, C.P. Endres, O. Baum, F. Lewen, S. Schlemmer, K.M. Menten, B.E. Billinghurst, J. Chem. Phys. 137 (2012) 104313.
- [61] L.-H. Xu, R.M. Lees, Y. Hao, H.S.P. Müller, C.P. Endres, F. Lewen, S. Schlemmer, J. Mol. Spectrosc. 303 (2014) 17.
- [62] A.G. Maki, J.S. Wells, J. Res. Nat. Inst. Stand. Tech. 97 (1992) 409470.
- [63] L.R. Brown, J.S. Margolis, R.H. Norton, B. Stedry, Appl. Spectrosc. 37 (1983) 287292.
- [64] L.S. Rothman, I.E. Gordon, Y. Babikov, A. Barbe, D.C. Benner, et al., J. Quant. Spectrosc. Radiat. Transfer 130 (2013) 450.
- [65] J. Gadhi, A. Lahrouni, J. Legrand, J. Demaison, J. Chim. Phys. Phys.-Chim. Biol. 92 (1995) 19841992.
- [66] C.P. Rinsland, S.W. Sharpe, R.L. Sams, J. Quant. Spectrosc. Radiat. Transfer 96 (2005) 271280.
- [67] M. Nishio, P. Paillous, M. Khlifi, P. Bruston, F. Raulin, Spectrochim. Acta 51A (1995) 617622.
- [68] C.P. Rinsland, V.M. Devi, D.C. Benner, T.A. Blake, R.L. Sams, L.R. Brown, I. Kleiner, A. Dehayem-Kamadjeu, H.S.P. Müller, R.R. Gamache, D.L. Niles, T. Masiello, J. Quant. Spectrosc. Radiat. Transfer 109 (2009) 974994.
- [69] R. Paso, R. Anttila, M. Koivusaari, J. Mol. Spectrosc. 165 (1994) 470480.
- [70] K. Sarka, L. Nová Stříteská, A. Ceausu-Velcescu, J. Mol. Spectrosc. (2014), in press, doi: 10.1016/j.jms.2014.09.003.
- [71] H.M. Pickett, J. Mol. Spectrosc. 148 (1991) 371377.
- [72] B.J. Drouin, H.S.P. Müller, J. Mol. Spectrosc. 251 (2008) 13.
- [73] J.C. Pearson, H.S.P. Müller, H.M. Pickett, E.A. Cohen, B.J. Drouin, J. Quant. Spectrosc. Radiat. Transfer 111 (2010) 16141616.
- [74] S. Yu, B.J. Drouin, J.C. Pearson, H.M. Pickett, Astrophys. J. Suppl. Ser. 180 (2009) 119124.
- [75] J. Plíva, L.D. Le, J.W.C. Johns, Z. Lu, R.A. Bernheim, J. Mol. Spectrosc. 173 (1995) 423430.
- [76] P. Pracna, J. Urban, O. Votava, Z. Meltzerová, Š. Urban, V.-M. Horneman, B.J. Drouin, J. Phys. Chem. A 115 (2011) 10631068.
- [77] S. Thorwirth, H.S.P. Müller, G. Winnewisser, J. Mol. Spectrosc. 204 (2000) 133144.
- [78] H. Spahn, H.S.P. Müller, T.F. Giesen, J.-U. Grabow, M.E. Harding, J. Gauss, S. Schlemmer, Chem. Phys. 346 (2008) 132138.
- [79] H.M. Pickett, R.L. Poynter, E.A. Cohen, M.L. Delitsky, J.C. Pearson, H.S.P. Müller, J. Quant. Spectrosc. Radiat. Transfer 60 (1998) 883890.
- [80] N. Jacquinet-Husson, L. Crepeau, R. Armante, C. Boutammine, A. Chédin, et al., J. Quant. Spectrosc. Radiat. Transfer 112 (2011) 23952445.
- [81] L.R. Brown, J.S. Margolis, J. Quant. Spectrosc. Radiat. Transfer 56 (1996) 283294.
- [82] V. Nemtchinov, K. Sung, P. Varanasi, J. Quant. Spectrosc. Radiat. Transfer 83 (2004) 243265.
- [83] J.M. Colmont, F. Rohart, G. Wlodarczak, J.P. Bouanich, J. Mol. Spectrosc. 238 (2006) 98107.
- [84] M. Baranger, Phys. Rev. 112 (1958) 855865.
- [85] F. Cerceau, F. Raulin, R. Courtin, D. Gautier, Icarus 62 (1985) 207220.
- [86] Y. Koga, S. Kondo, S. Saeki, W.B. Person, J. Phys. Chem. 88 (1984) 31523157.