On the formation of galactic thick disks
Abstract
Recent spectroscopic observations in the Milky Way suggest that the chemically defined thick disk (stars with high [/Fe] ratios and thus old) has a significantly smaller scale-length than the thin disk. This is in apparent contradiction with observations of external edge-on galaxies, where the thin and thick components have comparable scale-lengths. Moreover, while observed disks do not flare (scale-height does not increase with radius), numerical simulations suggest that disk flaring is unavoidable, resulting from both environmental effects and secular evolution. Here we address these problems by studying two different suites of simulated galactic disks formed in the cosmological context. We show that the scale-heights of coeval populations always increase with radius. However, the total population can be decomposed morphologically into thin and thick disks, which do not flare. We relate this to the disk inside-out formation, where younger populations have increasingly larger scale-lengths and flare at progressively larger radii. In this new picture, thick disks are composed of the imbedded flares of mono-age stellar populations. Assuming that disks form inside out, we predict that morphologically defined thick disks must show a decrease in age (or [/Fe] ratios) with radius and that coeval populations should always flare. This also explains the observed inversion in the metallicity and [/Fe] gradients for stars away from the disk midplane in the Milky Way. The results of this work are directly linked to, and can be seen as evidence of, inside-out disk growth.
Subject headings:
Galaxy: evolution — Galaxy: abundances — galaxies: kinematics and dynamics1. Introduction
The formation of galactic thick disks has been an important topic ever since their discovery in external galaxies (Burstein, 1979; Tsikoudi, 1979) and in the Milky Way (Gilmore and Reid, 1983). A number of different mechanisms have been proposed for the formation of thick disks (see Introduction in Minchev et al. 2012 and references therein), but it is generally believed that they are the oldest disk components.
Stellar disk density decomposition into thinner and thicker components in external edge-on galaxies have found that the thin and thick disk components have comparable scale-lengths (e.g., Yoachim and Dalcanton 2006; Pohlen et al. 2007; Comerón et al. 2012). While this is consistent with results for the Milky Way when similar morphologically (or structural) definition for the thick disk is used (e.g., Robin et al. 1996; Ojha 2001; Jurić et al. 2008), it is in contradiction with the significantly more centrally concentrated older or [/Fe]-enhanced stellar populations (e.g., Bensby et al. 2011; Cheng et al. 2012a; Bovy et al. 2012). This apparent discrepancy may be related to the different definition of thick disks - morphological decomposition or separation in chemistry.
Moreover, while observed disks do not flare (van der Kruit & Searle, 1982; de Grijs, 1998; Comerón et al., 2011), numerical simulations suggest that flaring cannot be avoided due to a range of different dynamical effects. The largest source is probably satellite-disk interactions (e.g., Bournaud et al. 2009; Kazantzidis et al. 2008; Villalobos & Helmi 2008) shown to increase an initially constant scale-height by up to a factor of in 3-4 disk scale-lengths. Studying preassembled N-body disks, Minchev et al. (2012) showed that purely secular evolution (in the absence of external perturbations) also causes flared disks, due to the redistribution of disk angular momentum. This was linked to the accumulation of outward/inward migrators in the outer/inner disk (with vertical actions larger/smaller than those of non-migrators), which caused vertical thickening/contraction and thus flaring. In addition to merger perturbations and radial migration, misaligned gas infall (Scannapieco et al., 2009; Roškar et al., 2010) and reorientation of the disk rotation axis (Aumer & White, 2013) can also produce disk flaring.
In this Letter we show that the above outlined contradictions can be reconciled when realistic galactic disks growing in a cosmological environment are considered.
2. Simulations
We study two simulations following the formation of disks in the cosmological context, which use two distinct simulation techniques.
The first model, Model1, is a gas dynamical simulation in a cosmological context using a sticky particle algorithm, as described in Martig et al. (2009, 2012), with 150 pc spatial and 104-5 M⊙ mass resolution. This is a barred late-type galaxy with stellar mass and a disk scale-length kpc, estimated from all stars in the range kpc, kpc. Further details about this simulation can be found in Martig et al. (2014) (model g106) and Minchev et al. (2013).
The second model, Model2, is a full cosmological zoom-in hydro simulation, using initial conditions from one of the Aquarius Project haloes (Springel et al., 2008; Scannapieco et al., 2009). The technique used here is Tree-PM SPH with 300 pc spatial and M⊙ mass resolution. Model2 is a non-barred galaxy with stellar mass and a disk scale-length kpc, estimated in the same spatial range as for Model1. Further details about this simulation can be found in Aumer et al. (2013), their model Aq-D-5.
Both simulations form initial central components during an early epoch of violent merger activity. Gas-rich mergers supply the initial reservoir of gas at high redshift and merger activity decreases with redshift, similarly to what is expected for the Milky Way. This inside-out disk formation results in centrally concentrated older stellar populations for both simulations (see Martig et al. 2014 and Aumer et al. 2014). The general formation and evolutionary behavior of our disks is similar to many recent simulations in the cosmological context (e.g., Brook et al. 2012; Stinson et al. 2013).
We work in units of disk scale-lengths, , which are estimated using the total stellar population at the final simulation time.
3. Results
3.1. To flare or not to flare
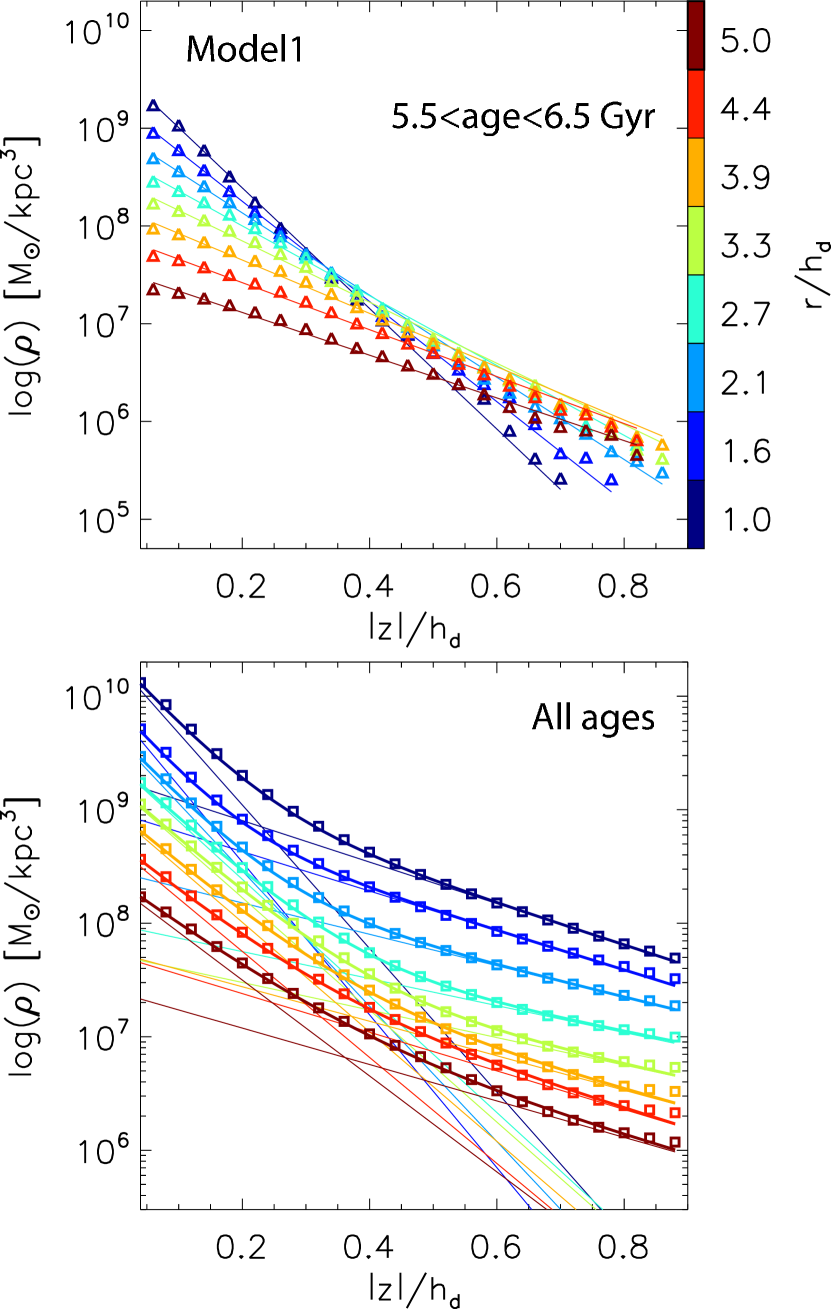
Similarly to Martig et al. (2014), we decomposed the stellar disks into mono-age populations, i.e., narrow bins of age, where we used age Gyr. It was found that single exponentials provided good fits to the column density in the vertical direction for all age bins and both Model1 and Model2, in agreement with Martig et al. (2014). Assuming that chemistry can be a proxy for age, this is also consistent with studies of mono-abundance populations in the Milky Way (Bovy et al., 2012). The top panel of Fig. 1 shows single exponential fits for a typical mono-age population of Model1, in eight radial bins in the range disk scale-lengths, . Radial bins of width were used. It can be seen that the fits are very good for all radii. In contrast, the bottom panel of Fig. 1 shows that a sum of two exponentials is required for a proper fit when considering the total stellar population.
It is clear already from the top panel of Fig. 1 that significant flaring exists for the particular mono-age population shown (i.e., the vertical density profile flattens with increasing radius). However, only milder variations with radius are seen for the total population, when decomposed into thin and thick disks (Fig. 1, bottom panel).
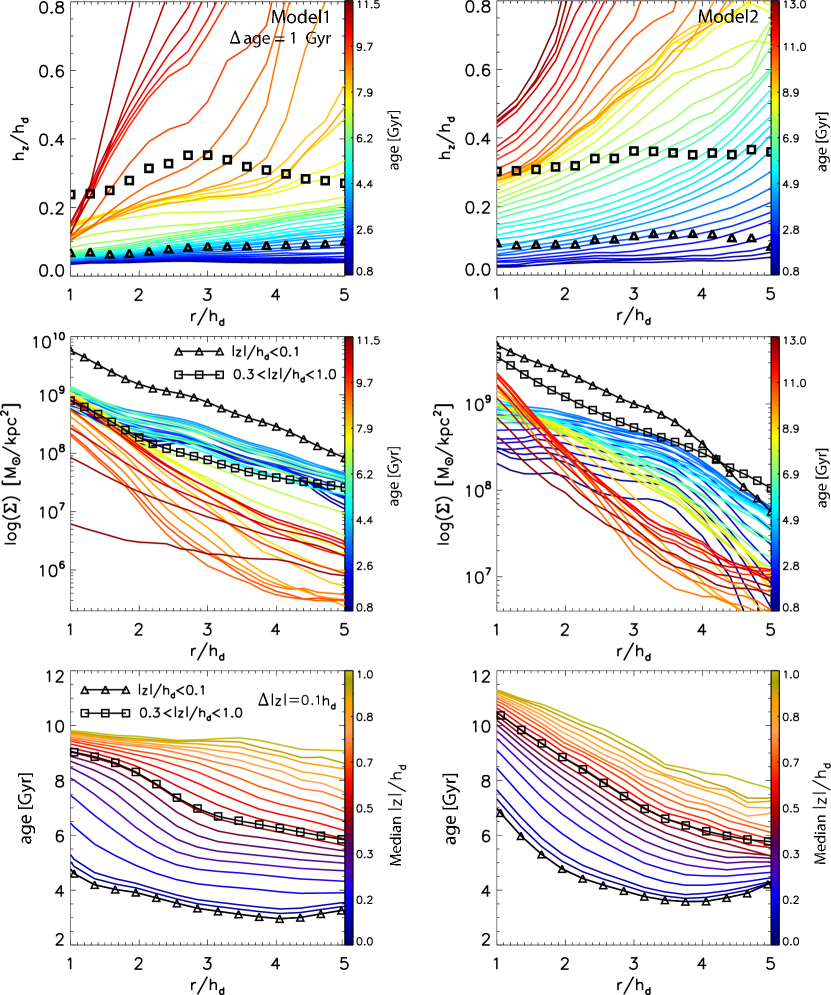
In the top row of Fig. 2 we plot the scale-height variation with galactocentric radius, , in the region 1-5 disk scale-lengths, , for both Model1 (left panel) and Model2 (right panel). Forty overlapping mono-age populations of width 1 Gyr are shown, covering the age range in each disk, as indicated in the color bar on the right of each panel. Both the radius and scale-height, , are in units of . It can be seen that, indeed, for both models significant flaring is present, which increases for older coeval populations. For Model1 the increase in scale-height with radius for stars of age Gyr is about a factor of four in four scale-lengths. The flaring decreases by about a factor of two for stars with age Gyr. Even more significant flaring is seen for Model2.
In contrast to the flaring found for all mono-age populations, the thin and thick disk decomposition of the total stellar population including all ages, results in no apparent flaring. This is shown by the triangle and square symbols overlaid in the top row of Fig. 2.
We discuss the interpretation and implications of this interesting result in the following sections.
3.2. Interpretation
What is the reason for the flaring of mono-age disks? In numerical simulations flaring is expected to result from a number of mechanisms related to galactic evolution in a cosmological context (e.g., Bournaud et al. 2009; Kazantzidis et al. 2008; Villalobos & Helmi 2008; Aumer & White 2013). Even in the absence of environmental effects, flaring is unavoidable due to secular evolution alone (radial migration caused by spirals and/or a central bar, Minchev et al. 2012). It should be stressed here that, while migration flares disks in the lack of external perturbations, during satellite-disk interactions it works against disk flaring (Minchev et al., 2014b). Yet, this is not sufficient to completely suppress the flaring induced by orbiting satellites, as evident from the top row of Fig. 2. This suggests that external effects are much more important for the disk flaring we see in the simulations. Because the mass and intensity of orbiting satellites generally decreases with decreasing redshift, so does the flaring induced. It can be expected that at a certain time secular evolution takes over the effect of external perturbations.111Minchev et al. (2014a) suggested that this time could also be inferred from the shape of the [/Fe]-velocity dispersion relation of narrow metallicity samples.
Resolution and sub-grid models for gas physics may set an unrealistically high lower limit for the vertical velocity dispersion of young stars (e.g., House et al. 2011). The fact that the youngest populations in our simulations do not flare (dark-blue curves in top panels of Fig. 2) seems to indicate that numerical issues are not important for our result (see also Martig et al. 2014, Sec. 5).
What is the reason for the lack of flaring in the total disk population? In an inside-out formation scenario, the outer disk edge (where flaring is induced) moves progressively from smaller to larger radii, because of the continuous formation of new stars in disk subpopulations of increasing scale-length. At the same time the frequency and masses of perturbing satellites decreases. Because of the inside-out disk growth, which results in more centrally concentrated older samples (see Fig. 2, middle row), the younger the stellar population, the further out it dominates in terms of stellar mass. Therefore, the thickened disk component results from the imbedded flares of different coeval populations, as seen in the top row of Fig. 2.
From the above discussion, it can easily be seen that inside-out disk growth would always have the effect of suppressing disk flaring in the total stellar population, if not completely removing it. We produced the equivalents of Fig. 2 for other disks from the two simulation suites considered here. The flaring was always strongly reduced when the total population was considered, suggesting that our results are generic.
3.3. Radial age gradients at high distance from the disk midplane
From the top panels of Fig. 2 it can be expected that morphologically defined thick disks, as in observations of edge-on galaxies, will show a decrease in age with increasing disk radius. To quantify this, in the bottom row of Fig. 2 we show the mean age variation with radius for stellar samples at different distance from the disk midplane, as indicated by the color bar on the right. Slices in have thickness .
We also plot the mean age of samples close to (triangles) and high above (squares) the disk midplane, to be associated with thin and thick disks defined morphologically. The two vertical ranges considered, and , for the Milky Way would correspond to kpc and kpc, using a disk scale-length kpc.
A decrease of age with radius is found for the above morphologically defined thin disk in both models. However, a significant negative age gradient is also seen in the morphological thick disks. Over the radial extent of 4 scale-lengths shown in Fig. 2, we find a drop in mean age of Gyr and Gyr for the thick disks of Model1 and Model2, respectively.
4. Implications for the Milky Way
We can already look for evidence of our prediction in Milky Way observations.
4.1. Inversion in radial [/Fe] and [Fe/H] gradients away from the disk midplane
As discussed above, our results suggest that even at distances high above the disk midplane, mean stellar age should decrease with galactic radius. As good age estimates for large stellar samples are currently unavailable, we can instead look at measurements of stellar [/Fe] ratios. Because stars of different masses release chemical elements to the interstellar medium on different timescales, abundance ratios, such as [/Fe], can be good proxies for age (e.g., Matteucci & Brocato 1990; Chiappini et al. 1997).
Negative [/Fe] gradients at large were reported by Boeche et al. (2013) and Boeche et al. (2014) in dwarfs and giants, respectively, studying data from the RAVE survey (Steinmetz et al., 2006). Anders et al. (2014) and Hayden et al. (2014) also showed a transition from a weakly positive (or flat) to a negative radial gradient in APOGEE [/M] measurements, as the distance from the Milky Way disk midplane was increased. Similar inversion of [/Fe] gradients has been also found in recent chemo-dynamical models (Minchev et al. 2014b; Rahimi et al. 2014; Miranda et al. 2015, submitted).
Flaring of mono-age disks can result also in the inversion of metallicity gradients with increasing distance from the disk midplane, as younger metal-rich stars in the outer disk can reach high vertical distances. Observationally, this inversion has been found in a number of spectroscopic Galactic surveys (e.g., SEGUE – Cheng et al. 2012b, RAVE – Boeche et al. 2013, APOGEE – Anders et al. 2014) and in simulations (Minchev et al., 2014b; Rahimi et al., 2014).
All of the above results are in agreement with the decline in age with radius found in this work.
4.2. Flaring of younger stellar populations
Studying APOGEE data, (Nidever et al., 2014) showed that, at kpc from the disk plane, the high-[/Fe] sequence dominates the inner disk ( kpc), while in the outer disk ( kpc) only the low-[/Fe] sequence is present (see their Fig. 10).
Flaring of younger stellar populations in the Milky Way have been reported in several works (e.g., (Feast et al., 2014; Kalberla et al., 2014; Carraro et al., 2015).
All these results are in agreement with the idea of mono-age flaring populations suggested here, which allow chemically- or age-defined thin-disk stars to reach large vertical distances in the outer disk.
4.3. Extended morphologically defined thick disks
We are suggesting here that inside-out disk formation inevitably gives rise to centrally concentrated older/[/Fe]-enhanced populations, but at the same time - to comparable scale-lengths for the morphologically defined thin and thick disks. It can be seen in the middle row of Fig. 2 that this expectation is borne out for both our models. While inside 3-4 mono-age populations become steeper with increasing age, the surface density profiles (of stars of all ages) close to (triangles) and high above (squares) the disk midplane run mostly parallel. Moreover, beyond 3-4 the thick disk profiles become flatter than the thin ones, i.e., extend further out.
A morphologically defined thick disk in the Milky Way with a scale-length larger than that of the thin disk has been reported by Robin et al. 1996 using a compilation of different data sets, Ojha (2001) using 2MASS data, and Jurić et al. (2008) using SDSS data. This is well in line with external observations and explained by the idea presented here, resolving the apparent disagreement with the centrally concentrated [/Fe]-enhanced populations in the Galaxy reported by Bensby et al. (2011) and Bovy et al. (2012).
5. Discussion
We showed that in galactic disks formed inside-out, mono-age populations are well fitted by single exponentials and always flare. In contrast, when the total stellar density is considered, a sum of two exponentials is required for a good fit, resulting in thin and thick disks, which do not flare. This can be explained by the increase in scale-length of younger populations flaring at progressively larger radii. This scenario resolves the apparent contradictions that chemically (or age) defined thick disks are centrally concentrated, but structurally thick populations in both observations of edge-on galaxies and in the Milky Way, extend as much as, or even beyond, the thinner component.
The result that flared mono-age populations give rise to non-flared thin and thick disks is directly linked to the disk inside-out formation. If galactic disks formed with a constant scale-length as a function of time, then the flares of all mono-age groups would simply add up, making significant flaring of the total stellar population unavoidable. This is not seen in observations of edge-on galaxies. Our results, thus, land support to this widely accepted idea of inside-out formation of galactic disks.
We found similar results in two simulation suites, represented here by Model1 and Model2, using radically different simulation techniques. This suggests that our results are generic and should be found in all cosmological simulations, where inside-out disk growth takes place.
While flaring has been seen as a general characteristic of disk heating by mergers, this conclusion can be linked to the initial conditions of preassembled disks typically used in such studies (allowing for a systematic exploration of parameter space). However, the results of this work suggest that heating by mergers can produce thick disks which do not flare, by considering the more realistic scenario of inside-out growing disks in a cosmological environment. It also implies that flaring in the total stellar population in observations of external galaxies cannot be used as a measure of the amount of mergers suffered by the host disk. Instead, flaring in narrow age groups should be searched for.
The phenomenon described here results from the interplay among the intensity of inside-out formation and the masses of infalling satellites and their frequency as functions of redshift. Further work is necessary to find observables which can differentiate between these processes. Our results may then form the basis for future high-precision surveys (e.g., Gaia in the Milky Way) to constrain disk formation mechanisms by quantifying the amount of mergers and gas inflow as a function of cosmic time.
References
- Anders et al. (2014) Anders, F., Chiappini, C., Santiago, B. X., et al.: 2014, A&A 564, A115
- Aumer & White (2013) Aumer, M., & White, S. D. M. 2013, MNRAS, 428, 1055
- Aumer et al. (2013) Aumer, M., White, S. D. M., Naab, T., and Scannapieco, C.: 2013, MNRAS 434, 3142
- Aumer et al. (2014) Aumer, M., White, S. D. M., & Naab, T. 2014, MNRAS, 441, 3679
- Bensby et al. (2011) Bensby, T., Alves-Brito, A., Oey, M. S., et al..: 2011, ApJ 735, L46
- Brook et al. (2012) Brook, C. B., Stinson, G. S., Gibson, et al.: 2012, MNRAS 426, 690
- Boeche et al. (2013) Boeche, C., Siebert, A., Piffl, T., et al.: 2013, A&A 559, A59
- Boeche et al. (2014) Boeche, C., Siebert, A., Piffl, T., et al. 2014, A&A, 568, AA71
- Bournaud et al. (2009) Bournaud, F., Elmegreen, B. G., and Martig, M.: 2009, ApJ 707, L1
- Bovy et al. (2012) Bovy, J., Rix, H.-W., Liu, C., et al.: 2012, ApJ 753, 148
- Burstein (1979) Burstein, D.: 1979, ApJ 234, 829
- Carraro et al. (2015) Carraro, G., Vázquez, R. A., Costa, E., Ahumada, J. A., & Giorgi, E. E. 2015, AJ, 149, 12
- Cheng et al. (2012a) Cheng, J. Y., Rockosi, C. M., Morrison, H. L., et al.: 2012a, ApJ 752, 51
- Cheng et al. (2012b) Cheng, J. Y., Rockosi, C. M., Morrison, H. L., et al.: 2012b, ApJ 746, 149
- Chiappini et al. (1997) Chiappini, C., Matteucci, F., & Gratton, R. 1997, ApJ, 477, 765
- Comerón et al. (2011) Comerón, S., Elmegreen, B. G., Knapen, J. H., et al.: 2011, ApJ 741, 28
- Comerón et al. (2012) Comerón, S., Elmegreen, B. G., Salo, H., et al.: 2012, ApJ 759, 98
- Feast et al. (2014) Feast, M. W., Menzies, J. W., Matsunaga, N., & Whitelock, P. A. 2014, Nature, 509, 342
- de Grijs (1998) de Grijs, R.: 1998, MNRAS 299, 595
- Gilmore and Reid (1983) Gilmore, G. and Reid, N.: 1983, MNRAS 202, 1025
- Guedes et al. (2011) Guedes, J., Callegari, S., Madau, P., & Mayer, L. 2011, ApJ, 742, 76
- House et al. (2011) House, E. L., Brook, C. B., Gibson, B. K., et al. 2011, MNRAS, 415, 2652
- Hayden et al. (2014) Hayden, M. R., Holtzman, J. A., Bovy, J., et al. 2014, AJ, 147, 116
- Haywood et al. (2013) Haywood, M., Di Matteo, P., Lehnert, M. D., Katz, D., & Gómez, A. 2013, A&A, 560, 109
- Jurić et al. (2008) Jurić, M., Ivezić, Ž., Brooks, A., et al. 2008, ApJ, 673, 864
- Kalberla et al. (2014) Kalberla, P. M. W., Kerp, J., Dedes, L., & Haud, U. 2014, ApJ, 794, 90
- Kazantzidis et al. (2008) Kazantzidis, S., Bullock, J. S., Zentner, A. R., Kravtsov, A. V., & Moustakas, L. A. 2008, ApJ, 688, 254
- Martig et al. (2012) Martig, M., Bournaud, F., Croton, D. J., et al.: 2012, ApJ 756, 26
- Martig et al. (2009) Martig, M., Bournaud, F., Teyssier, R., and Dekel, A.: 2009, ApJ 707, 250
- Martig et al. (2014) Martig, M., Minchev, I., and Flynn, C.: 2014, MNRAS 442, 2474
- Martig et al. (2014) Martig, M., Minchev, I., & Flynn, C. 2014, MNRAS, 443, 2452
- Matteucci & Brocato (1990) Matteucci, F., & Brocato, E. 1990, ApJ, 365, 539
- Minchev et al. (2012) Minchev, I., Famaey, B., Quillen, A. C., Dehnen, W., Martig, M., and Siebert, A.: 2012, A&A 548, 127
- Minchev et al. (2013) Minchev, I., Chiappini, C., & Martig, M. 2013, A&A, 558, AA9
- Minchev et al. (2014a) Minchev, I., Chiappini, C., Martig, M., et al. 2014a, ApJ, 781, 20
- Minchev et al. (2014b) Minchev, I., Chiappini, C., and Martig, M.: 2014b, A&A 572, 92
- Nidever et al. (2014) Nidever, D. L., Bovy, J., Bird, J. C., et al.: 2014, ApJ 796, 38
- Ojha (2001) Ojha, D. K. 2001, MNRAS, 322, 426
- Pohlen et al. (2007) Pohlen, M., Zaroubi, S., Peletier, R. F., & Dettmar, R.-J. 2007, MNRAS, 378, 594
- Rahimi et al. (2014) Rahimi, A., Carrell, K., and Kawata, D.: 2014, Research in Astronomy and Astrophysics 14, 1406
- Robin et al. (1996) Robin, A. C., Haywood, M., Creze, M., et al.: 1996, A&A 305, 125
- Roškar et al. (2010) Roškar, R., Debattista, V. P., Brooks, A. M., et al. 2010, MNRAS, 408, 783
- Steinmetz et al. (2006) Steinmetz, M., Zwitter, T., Siebert, et al. 2006, AJ, 132, 1645
- van der Kruit & Searle (1982) van der Kruit, P. C., & Searle, L. 1982, A&A, 110, 61
- Villalobos & Helmi (2008) Villalobos, Á., & Helmi, A. 2008, MNRAS, 391, 1806
- Scannapieco et al. (2009) Scannapieco, C., White, S. D. M., Springel, V., & Tissera, P. B. 2009, MNRAS, 396, 696
- Springel et al. (2008) Springel, V., Wang, J., Vogelsberger, M., et al. 2008, MNRAS, 391, 1685
- Stinson et al. (2013) Stinson, G. S., Bovy, J., Rix, H.-W., et al. 2013, MNRAS, 436, 625
- Tsikoudi (1979) Tsikoudi, V.: 1979, ApJ 234, 842
- Yoachim and Dalcanton (2006) Yoachim, P. and Dalcanton, J. J.: 2006, AJ 131, 226