Massive young stellar object W42-MME: The discovery of an infrared jet using VLT/NACO near-infrared images
Abstract
We report on the discovery of an infrared jet from a deeply embedded infrared counterpart of 6.7-GHz methanol maser emission (MME) in W42 (i.e. W42-MME). We also investigate that W42-MME drives a parsec-scale H2 outflow, with detection of bow shock feature at 0.52 pc to the north. The inner 0.4 pc part of the H2 outflow has a position angle of 18 and the position angle of 40 is found farther away on either side of outflow from W42-MME. W42-MME is detected at wavelengths longer than 2.2 m and is a massive young stellar object, with the estimated stellar mass of 194 M⊙. We map the inner circumstellar environment of W42-MME using VLT/NACO adaptive optics Ks and L′ observations at resolutions 02 and 01, respectively. We discover a collimated jet in the inner 4500 AU using the L′ band, which contains prominent Br line emission. The jet is located inside an envelope/cavity (extent 10640 AU) that is tapered at both ends and is oriented along the north-south direction. Such observed morphology of outflow cavity around massive star is scarcely known and is very crucial for understanding the jet-outflow formation process in massive star formation. Along the flow axis, which is parallel to the previously known magnetic field, two blobs are found in both the NACO images at distances of 11800 AU, located symmetrically from W42-MME. The observed W42-MME jet-outflow configuration can be used to constrain the jet launching and jet collimation models in massive star formation.
Subject headings:
ISM: jets and outflows – ISM: HII regions – ISM: magnetic fields – ISM: individual objects (W42-MME) – stars: formation1. Introduction
The driving mechanism of jets and their role in massive star formation (MSF) is still subject to considerable debate. Outflows are an ubiquitous feature of MSF (Lada, 1985; Beuther et al., 2002; Zhang, 2005). There have been increasing number of detection of molecular outflows from massive protostars (e.g. Beuther et al., 2002, 2009; Wu et al., 2004; Zhang, 2005; Arce et al., 2007), that suggests the accretion process for their formation. However, the number of known massive young stellar objects (MYSOs) associated with collimated jets is very limited (see Guzmán et al., 2010, for more details). Additionally, the information of magnetic field towards MYSO jet/outflow system is scarcely available (e.g. Jones et al., 2004; Carrasco-González et al., 2010). The investigation of MSF is often handicapped by the fact that massive stars are statistically rare, situated at large distances ( 1 kpc), present in clustered environments, and suffer from high extinction. All these factors inhibit their observational study in the early phases. Key to overcome these difficulties is the high-angular resolution observations towards candidate massive protostars at infrared and longer wavelengths, which will allow mapping of the inner circumstellar environment. It has been well established that the 6.7-GHz methanol maser emission (MME) is associated with early phases of MSF (e.g. Walsh et al., 1998; Urquhart et al., 2013) and hence traces the locations of MYSOs. Therefore, such sites are very promising to carry out a detailed study to understand the involved physical processes of MSF.
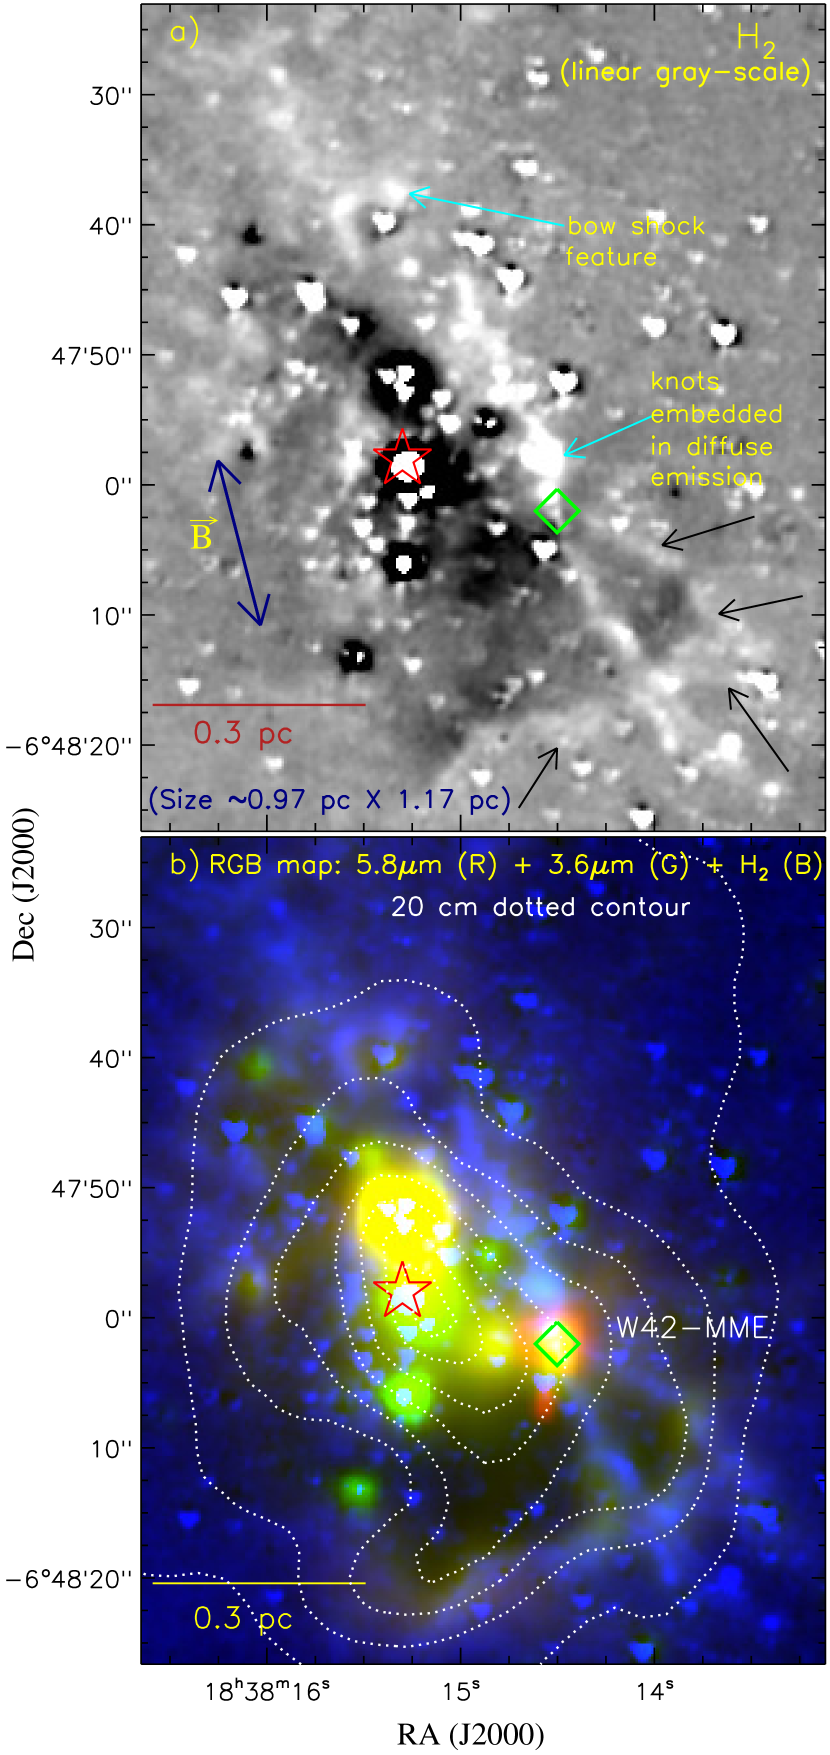
W42 is a Galactic giant H ii region (G25.380.18) harboring a spectroscopically classified O5-O6 star in the heart of a near-infrared (NIR) cluster (Blum et al., 2000). Distances reported for W42 range from 2.2 kpc obtained by Blum et al. (2000) assuming the O-star is in the ZAMS, to 3.8 kpc obtained kinematically using radio recombination line H86 from the H ii region (59.1 km s-1; Lester et al., 1985), and CO line from the associated cloud (58–69 km s-1; Anderson et al., 2009). Using the K-band polarimetric image towards the NIR cluster in W42, Jones et al. (2004) discovered a bipolar reflection nebula that is illuminated by an undetected source at 10 south-west of the O-star. Based on the alignment of the long axis of the nebula with the magnetic field at the position angle of 15, they argued that the reflection nebula is tracing a bipolar outflow driven by an embedded young stellar object (YSO) that is hidden by a cloud with extinction of AV 55 mag. However, they did not find any K-band counterpart of the driving source. We found that a 6.7 GHz MME detected by Szymczak et al. (2012) lies close to the predicted position of the driving source. We trace the reflection nebula as a parsec-scale bipolar outflow in the H2 (10) S(1) 2.12 m continuum-subtracted image (see Figure 1). The line of sight velocity of the MME is 58.1 km s-1, very similar to the velocity of the H ii region. Considering the fact that the 6.7-GHz maser is physically associated with W42, a distance of 3.8 kpc is also adopted for MME in this paper. The presence of a parsec-scale outflow around 6.7-GHz MME makes this system ideal for exploring the early phases of MSF, including looking for a jet using high angular resolution NIR imaging.
In this paper, using multi-wavelength archival data, we investigate an infrared counterpart (IRc) of 6.7-GHz MME (hereafter W42-MME) and present observational evidence for W42-MME as a MYSO with a jet at the base of a parsec-scale bipolar H2 outflow. The presence of jet is investigated using Very Large Telescope (VLT) NIR adaptive-optics images and the stellar counterpart is investigated using mid-infrared images.
2. Data and analysis
2.1. Adaptive-optics near infrared imaging data
Adaptive-optics imaging data towards 6.7-GHz MME were retrieved from the ESO-Science Archive Facility111http://archive.eso.org/eso/eso_archive_main.html (ESO proposal ID: 089.C-0455(A); PI: Joao Alves). The images were observed in Ks-band () and L′-band (), using 8.2m VLT with NAOS-CONICA (NACO) adaptive-optics system222http://www.eso.org/sci/facilities/paranal/instruments/naco.html (Lenzen et al., 2003; Rousset et al., 2003). Five Ks frames and six L′ frames of 24 and 21 seconds, respectively, were used in this study. These data were reduced using the standard analysis procedure available in IRAF and STAR-LINK packages, as described in detail by Kumar (2013). The astrometry of NACO images was calibrated using the GPS K-band point sources (see Section 2.2 for more details). The plate scales of final processed NACO Ks and L′ images were 0054/pixel and 0027/pixel, respectively, resulting in a resolution of 02 (760 AU) and 01 (380 AU), respectively.
2.2. Other Archival Data
We also utilized the multi-wavelength data from different surveys (e.g. Multi-Array Galactic Plane Imaging Survey (MAGPIS: 20 cm; Helfand et al., 2006), Galactic Ring Survey (GRS: 13CO(J = 10); Jackson et al., 2006), APEX Telescope Large Area Survey of the Galaxy (ATLASGAL: 870 m; Schuller et al., 2009), Herschel Infrared Galactic Plane Survey (Hi-GAL: 70–500 m; Molinari et al., 2010), Galactic Legacy Infrared Mid-Plane Survey Extraordinaire (GLIMPSE: 3.6–8.0 m; Benjamin et al., 2003), UKIRT Wide-field Infrared Survey for H2 (UWISH2: 2.12 m; Froebrich et al., 2011), and UKIRT NIR Galactic Plane Survey (GPS: 1.25–2.2 m; Lawrence et al., 2007)). To obtain a continuum-subtracted H2 map (hereafter H2 map), the GPS K-band image was registered and scaled to the UWISH2 narrow-band H2 (10) S(1) 2.12 m image (resolution 1). The H2 map was smoothed with a Gaussian of sigma 1 pixel to enhance the faint features. The K-band polarimetric data were obtained from Jones et al. (2004).
3. Results
3.1. Multi-wavelength view around 6.7-GHz MME
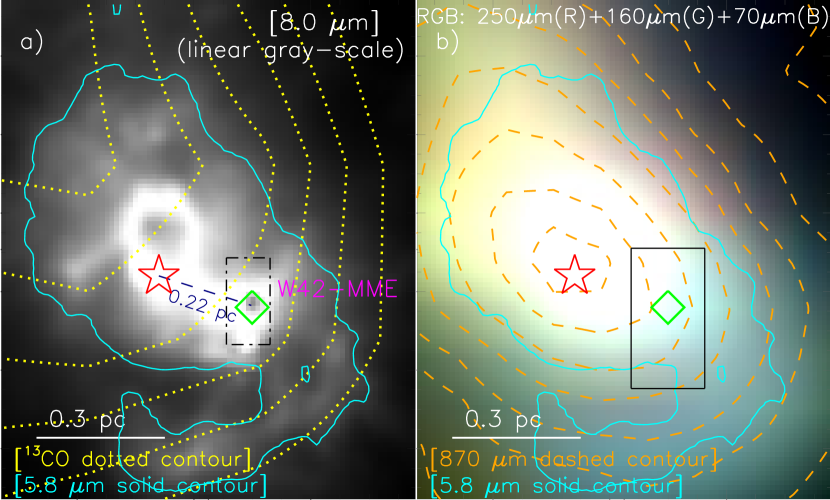
The distribution of molecular H2 emission is shown in Figure 1a, where the most prominent extended structure is a continuous elongated emission feature centered on the position of the 6.7-GHz MME. On the northern side, the feature intercepts a bow shock at a projected distance of 0.52 pc from the 6.7-GHz MME. The explanation of the origin of H2 emission in W42 is difficult because an O5-O6 star is located at 0.22 pc distance from the MME in W42 H ii region. The presence of H2 emission can be interpreted by either ultraviolet (UV) fluorescence or shocks. Considering the observed morphology of the H2 features, we suggest that the elongated H2 emission is caused by shock, which traces a parsec-scale bipolar H2 outflow. The presence of bow shock feature and knots embedded in diffuse emission along the elongated H2 feature offers further evidence for the shock-excited outflow activity. The overall morphology of the H2 feature resembles the bipolar outflows of Herbig Haro objects. The outflow nature of the observed H2 feature is further supported by recent detection of [Fe II] emission coinciding with the southwest part (see Figure 12 of Lee et al., 2014). The inner 0.4 pc part of the H2 outflow has a position angle of 18, which coincides with the reflection nebula reported by Jones et al. (2004) (see their Figure 5). However, the H2 feature continues much further than the reflection nebula on either side at a position angle of 40. Considering the variation in position angles along the outflow, the outflow morphology appears a little twisted in “S” shape. The GRS 13CO(J = 10) line data are unable to provide any outflow signatures towards MME due to coarse beam (beam size 45). Additionally, there are no high-resolution CO observations available in the literature.
In order to identify the IRc of 6.7-GHz MME, we present H2, 3.6 m, and 5.8 m images in Figure 1b. W42-MME is barely detected in the GPS K-band image (not shown here) with upper limit of 12.815 mag. It is well detected in GLIMPSE 3.6–5.8 m images but saturated in the 8.0 m (see Figures 1b and 2a). The GLIMPSE-I catalog lists photometric magnitude only in one of the GLIMPSE bands. Therefore, aperture photometry was carried out for W42-MME using the GLIMPSE images (see Dewangan et al., 2015, for more details). The GLIMPSE photometric magnitudes were measured to be 8.2950.031 (3.6 m), 6.1780.012 (4.5 m), and 4.5450.103 (5.8 m) mag. The color excess criteria further reveal this source to be a Class I YSO (see Dewangan et al., 2015, for classification schemes). Figure 1b also illustrates the distribution of ionized emission using MAGPIS 20 cm map (beam size 6). It can be noticed that the MME-outflow system is immersed within the W42 H ii region. The GRS 13CO(J = 10) molecular, ATLASGAL dust continuum at 870 m (beam size 192), and Herschel sub-millimetre emissions (beam size 6–18) are also peaked close to the 6.7-GHz MME position (see Figure 2). These data therefore suggest that W42-MME is located at the densest part of the molecular cloud in W42.
Apart from the elongated bipolar feature, the H2 map also shows H2 emissions in the south-west and south directions, as highlighted by black arrows (see Figure 1a). These particular H2 features are nicely coincident with GLIMPSE infrared and 20 cm emissions. In general, GLIMPSE images (3.6–8.0 m) have been used to trace a photodissociation region around the H ii region through the presence of polycyclic aromatic hydrocarbon features at 3.3, 6.2, 7.7, and 8.6 m. Therefore, it seems that these H2 features (see black arrows in Figure 1a) are formed due to UV fluorescence, tracing the wall of an ionized cavity-like structure (see Figure 1b). The ionized cavity-like structure seen in GLIMPSE images is also shown in Figure 2. Interestingly, the bipolar H2 feature in the south direction is further extended beyond the cavity-like structure (Figure 1).
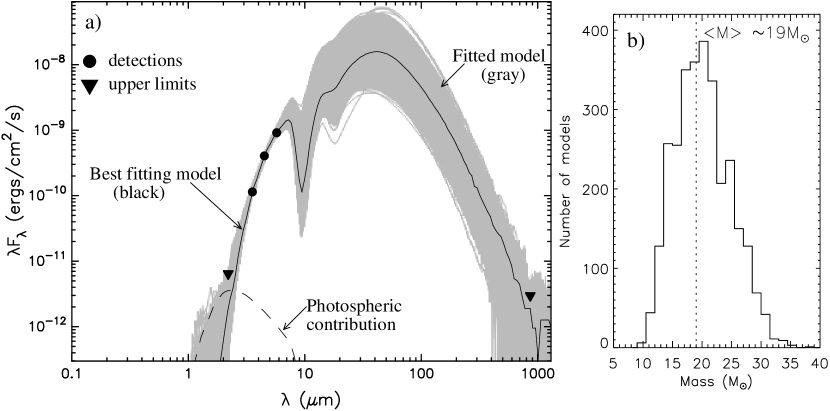
To estimate the stellar mass, we modelled the Spectral Energy Distribution (SED) of W42-MME using an on-line SED modelling tool (Robitaille et al., 2006, 2007). Spitzer-GLIMPSE fluxes at 3.6, 4.5, and 5.8 m bands were used as data points, whereas GPS K-band magnitude and ATLASGAL 870 m flux (obtained from Csengeri et al., 2014) were treated as upper limits (e.g. Dewangan et al., 2015). We provided the visual extinction in the range 0–70 mag and our adopted distance to W42-MME, as input parameters for SED modelling. The fitted SED models of W42-MME are shown in Figure 3a. The stellar mass distribution for W42-MME is also plotted in Figure 3b. The weighted mean values of the stellar mass and extinction are 194 M⊙ and 4815 mag, respectively. The extinction value of W42-MME is consistent with the estimates of Jones et al. (2004). The weighted mean value of age is found to be 8.1 104 year. Our SED result suggests that W42-MME is a MYSO candidate with a weighted mean luminosity of 4.5 104 L⊙. We also fitted the SED assuming a distance of 2.2 kpc and estimated a weighted mean mass of 143 M⊙. W42-MME is still a massive protostar candidate at a shorter distance of 2.2 kpc. The SED result of W42-MME is also in agreement with the generally accepted argument that the 6.7-GHz methanol masers are solely associated with MSF (e.g. Urquhart et al., 2013).
Taken together, it appears that W42-MME is a driving source of a parsec-scale bipolar outflow and the axis of the outflow is parallel to the magnetic field (see Figure 1).
3.2. Inner circumstellar environment of W42-MME
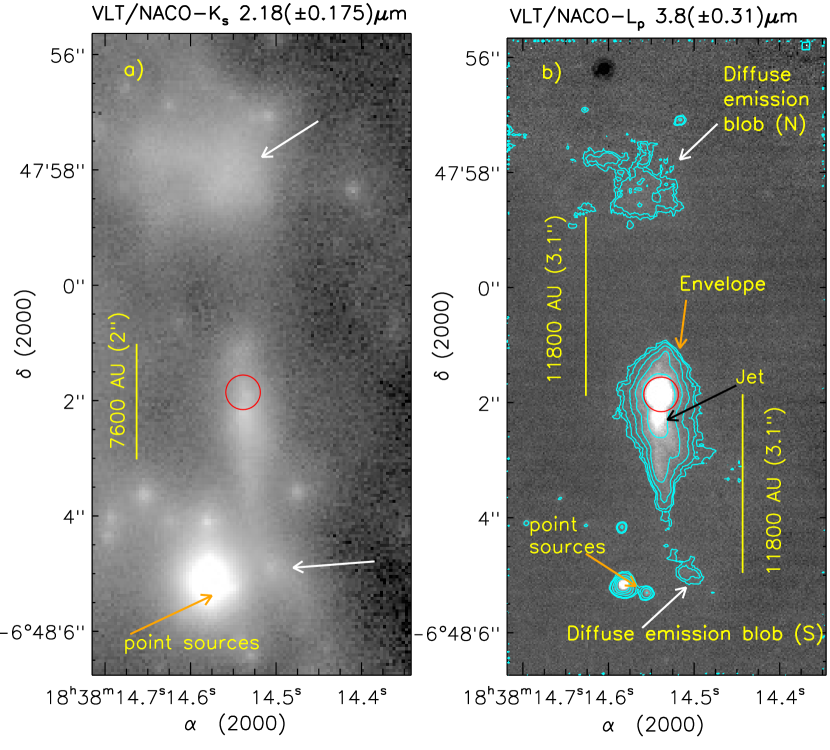
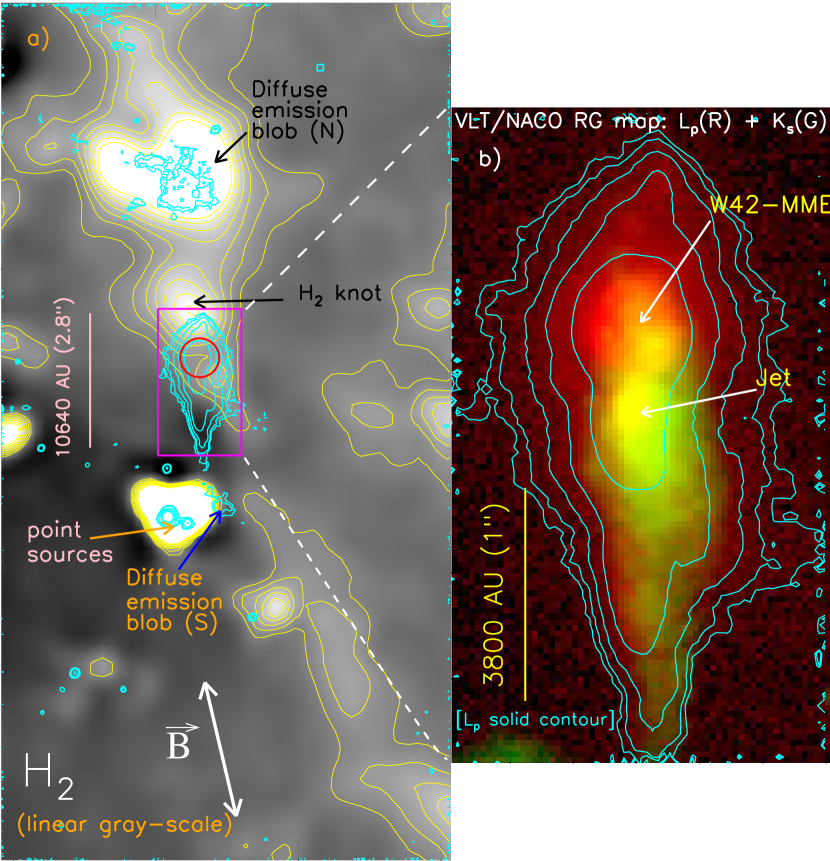
In Figure 4, we show the inner circumstellar environment of W42-MME using the VLT/NACO adaptive-optics images at Ks and L′ bands. The Ks image shows diffuse emissions near the position of 6.7-GHz MME, as well as, in north and south directions (see arrows in Figure 4a), which are coincident with the emissions seen in H2 map. The L′ image reveals a point source (i.e. W42-MME) associated with a small-scale feature (within a scale of 4500 AU). The small-scale feature is noticeably elongated in vertical direction and the full width half maximum of its point spread function is almost twice that of other stars seen in L′ image. This comparison allows us to rule out the small-scale feature as a point-like source. W42-MME is also surrounded by an envelope-like emission, which is extended on a physical scale of 10640 AU, oriented along the north-south direction.
Zhang & Tan (2011) performed the radiative transfer calculations to understand the observed NIR and mid-infrared emissions around embedded MYSOs. They suggest that the outflow cavity is the most significant features in images up to 70 m. They also find that the NIR emission is due mainly to scattered light from the outflow cavity wall. Using the prediction of model, we consider the envelope-like structure as an outflow cavity traced by the scattered light. The cavity has very narrow opening tip at both ends and is more extended (4900 AU in east-west) near the position of W42-MME (see Figure 4b).
In both NACO images, the diffuse emissions are found parallel to the cavity in north and south directions, which are separated by a similar distance 31 (11800 AU) with respect to W42-MME. It provides the evidence for the presence of a symmetric configuration along flow axis. The physical association of small-scale feature, the cavity, and the outflow is shown in Figure 5a. In the north direction, the H2 knot is coincident with the tip of the cavity along the flow axis. All these observed features suggest that they can be originated by the interaction of a jet with molecular gas in its surroundings. Therefore, the small-scale feature within the cavity is witness of a jet associated with MYSO W42-MME (see Figure 5b for zoomed-in view).
Considering together the observed emissions, NACO L′ image traces the inner part of the outflow, which is highly collimated to a small-angle jet. A zoomed-in view of the cavity and the jet using a two color composite NACO image (red:L′ and green:Ks) is shown in Figure 5b. The IRc and the cavity have red colors suggesting absence of Ks emission from the parts. It also appears that the cavity resembles an onion-like structure. The jet is bright in L′ image, which encompasses the Br (4.05 m) line emission as main contributor. Therefore, we suggest that it is an ionized jet associated with a driving source W42-MME. The Ks diffuse emission is also coincident with jet-like feature located within the cavity, which could be due to the Br (2.166 m) line emission. In order to further investigate the ionized nature of the jet, we estimated the emission measure (EM) of jet feature using its photometric fluxes obtained in both the NACO images. The photometric calculations of jet-feature were performed with the removal of its surrounding diffuse emission. In the calculation of EM, we assume that the whole jet emission is dominated by the hydrogen lines. Therefore the Ks and L′ fluxes of jet feature provide a measure of the Br and Br line emissions, respectively. Following the recombination theory and the observed flux ratio of Br to Br, we computed the extinction at Br and Br emissions (see Appendix to Ho et al., 1990, and references therein). The intrinsic flux ratio of Br to Br was adopted for Case B with Te=104 K and ne=104 cm-3. Following Indebetouw et al. (2005) extinction law, the visual extinction (AV) of jet emission is also estimated about 37 mag using the extinction at Br emission, which is in agreement with our SED result. Furthermore, the extinction corrected Br flux is used to measure the EM of 2.7 109 cm-6 pc (see Tokunaga & Thompson, 1979, for the equation), which can be taken as an indicative value. Our estimate of EM is consistent with the values obtained for candidates radio jets toward MYSOs (e.g. Guzmán et al., 2012). It is also to be noted that the magnetic field is parallel to the jet-outflow axis (see Figure 5a). In the south direction, the blob emissions and the tip of the cavity are not perfectly aligned with the H2 outflow axis. Furthermore, the H2 outflow has a little bend with respect to the jet axis. It further suggests the variation in position angles from small scale to large scale along the outflow axis.
3.3. Summary and Discussion
We studied the inner circumstellar environment of a deeply embedded IRc of 6.7-GHz MME in W42 (i.e. W42-MME), as the driving source of a parsec-scale bipolar H2 outflow. The parsec-scale H2 outflow morphology appears a little twisted in “S” shape, with the position angle changing smoothly from 18 near the IRc to 40 at the ends. W42-MME is characterized as a MYSO with mass of 194 M⊙. This is the first time we identified W42-MME and characterized its stellar mass. The aim of this work was to understand the jet/outflow formation process in MSF. We discovered a collimated jet in the inner 4500 AU in W42-MME using the L′ band to which Br line emission contributes prominently, suggesting the jet is ionized in nature. The presence of jet was further confirmed by the detection of bow shock feature and knots in diffuse emission in H2 map along the flow axis (i.e. jet-related features). The jet is found inside a cavity (extent 10640 AU) oriented along the north-south direction, which is tapered at both ends. Such a morphology appears to be responsible for collimating the jet/outflow. The diffuse nebular blobs seen in north and south directions are located at similar distances (11800 AU) from W42-MME, which can be considered as a symmetric configuration along the flow axis. Previously published magnetic field direction is parallel to the jet-outflow flow axis.
All these observed characteristics at a few thousands AU and a parsec-scale share some common features of the jet-driven bow shock model, the precessing jet model, and the magnetically-driven model (e.g. Arce et al., 2007; Pudritz et al., 2007, and references therein). In summary, a detailed modelling is needed to pinpoint the exact physical mechanism for W42-MME jet-outflow system.
The high angular resolution of NACO images around a MYSO W42-MME have enabled the detection of the inner jet-outflow configuration. Such a system is hardly known and is very crucial for understanding the jet-outflow formation process. We find that the morphology of outflow cavity in W42-MME is unique and rare, which is not seen at the inner environment of some well-studied low and massive stars (e.g. Valusamy et al., 2007; Fuller et al., 2001; Carrasco-González et al., 2010). Therefore, the inferred spatial morphology of W42-MME can be used to constrain the jet launching and jet collimation models in MSF.
References
- Anderson et al. (2009) Anderson, L. D., Bania, T. M., Jackson, J. M., et al. 2009, ApJS, 181, 255
- Arce et al. (2007) Arce, H. G., Shepherd, D., Gueth, F., et al. 2007, in Protostars and Planets V, ed. B. Reipurth, D. Jewitt, & K. Keil, 245-260
- Benjamin et al. (2003) Benjamin, R. A.,Churchwell, E., Babler, B. L., et al. 2003, PASP, 115, 953
- Beuther et al. (2002) Beuther, H., Schilke, P., Menten, K. M., Motte, F., Sridharan, T. K., & Wyrowski, F. 2002, ApJ, 566, 945
- Beuther et al. (2009) Beuther, H., Walsh, A. J., & Longmore, S. N. 2009, ApJS, 184, 366
- Blum et al. (2000) Blum, R. D., Conti, P. S., & Damineli, A. 2000, AJ, 119 1860
- Carrasco-González et al. (2010) Carrasco-González, C., Rodríguez, L. F., Anglada, G., Martí, J., Torrelles, J. M., & Osorio, M. 2010, Sci, 330, 1209
- Csengeri et al. (2014) Csengeri, T., Urquhart, J. S., Schuller, F., et al. 2014, A&A, 565, 75
- Dewangan et al. (2015) Dewangan L. K., Ojha D. K., Grave, J. M. C., & Mallick, K. K. 2015, MNRAS, 446, 2640
- Froebrich et al. (2011) Froebrich, D., Davis, C. J., Ioannidis, G., et al. 2011, MNRAS, 413, 480
- Fuller et al. (2001) Fuller, G. A., Zijlstra, A. A., & Williams, S. J. 2001, ApJ, 555, L125
- Guzmán et al. (2010) Guzmán, A. E., Garay, G., & Brooks, K. J. 2010, ApJ, 725, 734
- Guzmán et al. (2012) Guzmán, A. E., Garay, G., Brooks, K. J., & Voronkov, M. A. 2012, ApJ, 753, 51
- Helfand et al. (2006) Helfand, D. J., Becker, R. H., White, R. L., Fallon, A., & Tuttle, S. 2006, AJ, 131, 2525
- Ho et al. (1990) Ho, P. T. P., Beck, S. C., Turner, J. L. 1990, ApJ, 349, 57
- Indebetouw et al. (2005) Indebetouw, R., Mathis, J. S., Babler, B. L., et al. 2005, ApJ, 619, 931
- Jackson et al. (2006) Jackson, J. M., Rathborne, J. M., Shah, R. Y., et al. 2006, ApJS, 163, 145
- Jones et al. (2004) Jones, T. J., Woodward, C. E., & Kelley, M. S. 2004, ApJ, 128, 2448
- Kumar (2013) Kumar, M. S. N. 2013, A&A, 558,119
- Lada (1985) Lada, C. J. 1985, ARAA, 23, 267
- Lawrence et al. (2007) Lawrence, A., Warren, S. J., & Almaini, O., et al. 2007, MNRAS, 379, 1599
- Lee et al. (2014) Lee, J. J., Koo, B. C., Lee, Y. H., et al. 2014, MNRAS, 443, 2650
- Lenzen et al. (2003) Lenzen, R., Hartung, M., Brandner, W., et al. 2003, Proc. SPIE, 4841, 944
- Lester et al. (1985) Lester, D. F., Dinerstein, H. L., Werner, M. W. et al. 1985, AJ, 296, 565
- Molinari et al. (2010) Molinari, S., Swinyard, B., Bally, J., et al. 2010, A&A, 518, L100
- Pudritz et al. (2007) Pudritz, R. E., Ouyed, R., Fendt, C., & Brandenburg, A. 2007, in Protostars and Planets V, ed. B. Reipurth, D. Jewitt, & K. Keil (Tucson, AZ: Univ. Arizona Press), 277
- Robitaille et al. (2006) Robitaille, T. P., Whitney, B. A., Indebetouw, R., Wood, K., & Denzmore P. 2006, ApJS, 167, 256
- Robitaille et al. (2007) Robitaille, T. P., Whitney, B. A., Indebetouw, R., & Wood, K. 2007, ApJS, 169, 328
- Rousset et al. (2003) Rousset, G., Lacombe, F., Puget, P., et al. 2003, Proc. SPIE, 4839, 140
- Schuller et al. (2009) Schuller, F., Menten, K. M., Contreras, Y., et al. 2009, A&A, 504, 415
- Szymczak et al. (2012) Szymczak, M., Wolak, P., Bartkiewicz, A., & Borkowski, K. M. 2012, AN, 333, 634
- Tokunaga & Thompson (1979) Tokunaga, A. T., & Thompson, R. I. 1979, ApJ, 229, 583
- Urquhart et al. (2013) Urquhart, J. S., Moore, T. J. T., Schuller, F., et al. 2013, MNRAS, 431, 1752
- Valusamy et al. (2007) Valusamy, T., Langer, W. D., & Marsh, K. A. 2007, ApJ, 668, L159
- Walsh et al. (1998) Walsh, A. J., Burton, M. G., Hyland, A. R., & Robinson, G. 1998, MNRAS, 301, 640
- Wu et al. (2004) Wu, Y., Wei, Y., Zhao, M., et al. 2004, A&A, 426, 503
- Zhang (2005) Zhang, Q., Hunter, T. R., Brand, J., Sridharan, T. K., Cesaroni, R., Molinari, S., Wang, J., & Kramer, M. 2005, ApJ, 625, 864
- Zhang & Tan (2011) Zhang, Y., & Tan, J. C. 2011, ApJ, 733, 55