Collective waves in dense and confined microfluidic droplet arrays†
Ulf D. Schiller,∗a Jean-Baptiste Fleury,b Ralf Seemann,bc and Gerhard Gomppera
Received Xth XXXXXXXXXX 20XX, Accepted Xth XXXXXXXXX 20XX
First published on the web Xth XXXXXXXXXX 200X
DOI: 10.1039/b000000x
Excitation mechanisms for collective waves in confined dense one-dimensional microfluidic droplet arrays are investigated by experiments and computer simulations. We demonstrate that distinct modes can be excited by creating specific ‘defect’ patterns in flowing droplet trains. Excited longitudinal modes exhibit a short-lived cascade of pairs of laterally displacing droplets. Transversely excited modes obey the dispersion relation of microfluidic phonons and induce a coupling between longitudinal and transverse modes, whose origin is the hydrodynamic interaction of the droplets with the confining walls. Moreover, we investigate the long-time behaviour of the oscillations and discuss possible mechanisms for the onset of instabilities. Our findings demonstrate that the collective dynamics of microfluidic droplet ensembles can be studied particularly well in dense and confined systems. Experimentally, the ability to control microfluidic droplets may allow to modulate the refractive index of optofluidic crystals which is a promising approach for the production of dynamically programmable metamaterials.
1 Introduction
Microfluidic devices have become an important tool in chemistry and biology, where they are increasingly used, for example, in analytic essays,1, 2 micro-reactions 3 or flow cytometry.4 These applications typically involve manipulation and control of immersed objects, such as droplets, vesicles or cells,5 that interact hydrodynamically through the flow perturbations of the surrounding fluid. A detailed understanding of the correlated motion induced by long-ranged hydrodynamic interactions in microfluidic devices is therefore essential for efficient control of the flow of micro-particles. In recent years, a number of studies brought out that microfluidic droplet systems are especially well suited to steer their dynamics by modifying particle properties and/or device geometry.6, 7, 8, 9 Consequently, microfluidic droplets have become both a test-bed and a model system to study collective behaviour and self-organisation in non-equilibrium many-body systems.10 Typically, a pressure-driven flow is imposed such that the system is out of equilibrium, and at low Reynolds number viscous dissipation dominates over inertia. A theoretical description of such driven dissipative systems remains challenging, and thus experiments and computer simulations are basic tools to study the dynamics of microfluidic droplet ensembles.
When microfluidic droplets are confined between two parallel plates, the geometry is effectively two-dimensional (2D) and the scattered flow has a characteristic dipolar form.11 In this case, the hydrodynamic interactions are marginally long-ranged, i.e., the decay exponent is equal to the dimensionality of the system.12 In contrast to quasi-1D geometries, where the hydrodynamic interactions are strongly screened, the dipolar interactions in quasi-2D geometries lead to complex collective phenomena.10 Dipolar flow fields are also characteristic for some types of self-propelled particles, such as droplets driven by Marangoni flows or by chemical reactions on their surface.13 Some progress has been made in understanding the dynamics of rigid and deformable particles and their hydrodynamic coupling in 2D pressure-driven flow. Pairs of rigid particles in Poiseuille flow were shown to follow either bound or unbound trajectories, depending on the relative position of the particles, their absolute position in a channel, and the strength of confinement.14 Linear arrays of rigid spheres and deformable drops aligned in the flow direction undergo a pairing instability.15 While arrays of spherical particles are also unstable to lateral perturbations, droplet arrays are stabilised by quadrupolar interactions due to deformation.15 Asymmetric particles align with the flow due to self-interactions, and migrate to the centreline of the confining channel.16, 17, 18 For highly asymmetric particles, the time-scales for alignment and focusing separate due to the distinct hydrodynamic mechanisms involved. The focusing of asymmetric particles resembles a damped harmonic oscillator, whereas symmetric particles oscillate between side-walls.16 In 2D ensembles of droplets, the dipolar hydrodynamic interactions give rise to sound and shock waves that are superposed on droplet diffusion. The waves are due to a density-velocity coupling and can be described by a 1D Burgers equation.19, 10
A particular feature arises in regular arrays of droplets, so called microfluidic crystals, where the flowing droplets have a spatial order with a well-defined spacing. These crystals can exhibit collective oscillations with a dispersion relation akin to solid state phonons.20, 21 These microfluidic phonon modes are neither growing nor decaying, and are thus a realisation of marginally stable oscillatory modes in a dissipative system made possible by the imposed symmetry-breaking flow. Practically, however, the possibility to observe these modes is limited by non-linear instabilities 10, 22 and the strong dependence on initial conditions. Only recently, an experimental technique was proposed to systematically excite microfluidic phonons, and the observed modes revealed a coupling mechanism, induced by lateral confinement, between longitudinal and transverse modes that was confirmed by computer simulations.23 The ability to control the dynamic properties by tuning the flow characteristics opens interesting perspectives regarding dynamically programmable metamaterials which could be produced by modulating the refractive index of droplet crystals.24, 25, 26
Here we investigate collective modes in dense microfluidic crystals under confinement both experimentally and by computer simulations. We show that distinct oscillatory behaviour can be systematically excited by varying the initial conditions through the introduction of specific ‘defect’ patterns. The observed modes are analysed and characterised, and reveal several interesting dynamic features, such as cascades of laterally offset pairs and mode coupling. The results from experiments and computer simulations agree quantitatively. The long-time behaviour is investigated in computer simulations and used to identify possible instabilities and their underlying mechanisms. Our approach demonstrates the rich dynamics that emerges from hydrodynamic interactions in confined microfluidic droplet ensembles. The results show good agreement with a linearised far-field theory 10 even in the dense droplet regime. This makes it very promising to apply the techniques to other crowded microfluidic systems, such as self-propelled particles.13
The remainder of the article is organised as follows: In section 2, we review the hydrodynamics of quasi-2D systems and the linearised far-field theory for microfluidic phonons. Section 3 describes the experimental techniques and the simulation approach we used to study microfluidic droplet systems. In section 4, we present excitation mechanisms for collective waves and analyse the observed oscillations and instabilities. A concluding discussion is given in section 5.
2 Microdroplet trains in quasi-2D flow

We consider droplets that are confined between two parallel plates and thus move in a quasi-2D geometry, cf. figure 1. The flow and the hydrodynamic interactions in this geometry differ qualitatively from the bulk case due to momentum absorption at the confining plates which leads to screening of the far-field. The fluid flow satisfies no-slip boundary conditions on the channel walls, and since the height of the channel is small compared to the lateral width , the velocity gradient in the -direction is much larger than in the planar directions. In the Darcy approximation , , the solution of the Stokes equation has a quasi-2D Hele-Shaw form 27
| (1) |
At low Reynolds number, the flow is incompressible and Eq. (1) can be written as a Laplace equation
| (2) | ||||
| (3) |
where the effective potential is defined through the pressure with the dynamic viscosity of the fluid.
We briefly review here the theoretical description presented in Refs.21, 10 When a droplet is moving through the fluid with a velocity relative to the externally imposed flow , it acts as a momentum monopole whose flux scales as . However, due to the absorption of momentum at the top and bottom plates the flux is not conserved. The absorbed flux scales as , therefore the flow field of the momentum monopole decays exponentially.11 Thus, unlike in the bulk case, the leading contribution is the mass dipole created by the droplet. The moving droplet pushes fluid out at the upstream edge and draws fluid in at the downstream edge, giving rise to a characteristic dipolar flow field. Formally, the flow perturbation at a distance from a droplet is obtained by solving the Laplace equation with boundary conditions of zero mass flux (zero perpendicular velocity) through the droplet interface.28 This gives the dipolar potential and scattered velocity field around a droplet of radius
| (4) | ||||
| (5) |
The 2D potential flow can also be described by a complex potential where the imaginary part is the stream function . The flow velocity is then given by with . For an imposed flow in the -direction the complex dipolar potential is then
| (6) |
A droplet moving in the imposed flow experiences a hydrodynamic drag that can be written as
| (7) |
where the drag coefficient is introduced. The second term arises from the self-interaction of the droplet with its dipole.10
If the size of the droplets exceeds the channel height , they are flattened and experience a friction with the top and bottom plates which can be modelled as
| (8) |
Since inertial effects can be neglected at low Reynolds number, we can use force balance to obtain the equation of motion for the droplet
| (9) |
where is the mobility of the droplet in the imposed flow.
In the presence of lateral side-walls, i.e., in a microfluidic channel, additional boundary conditions have to be satisfied. The simple dipole potential (6) has a non-vanishing flux at the side-walls which can be eliminated by placing image dipoles inside the wall.29, 30 These dipoles form an infinite array perpendicular to the flow direction. The flow potential of a single droplet is obtained by summing over the infinite dipole array, and then rescaling by a compressibility factor to account for the finite size of the droplets.29, 10 The result is 21
| (10) |
where
| (11) |
The equation of motion for a confined droplet can be obtained as above and keeps the form if the mobility is replaced by
| (12) |
In an ensemble of droplets, the solution of the Laplace equation is considerably more complicated because the boundary conditions have to be satisfied additionally on all droplet surfaces. Although this is in principle possible using the method of images, the large number of reflections that arise makes it unreasonably intricate in practice. One therefore resorts to the leading-order approximation where the drag force is given by a superposition of the flow fields created by the other droplets. For the -th droplet in an ensemble, the equation of motion thus is 10
| (13) |
This approximation is valid if the inter-droplet distance is larger than the droplet size , and we will see below that the predictions based on Eq. (13) work well even for dense droplet trains.
For a regular train of droplets flowing with an ‘equilibrium’ spacing in the centre of the channel, the displacements are assumed to be small and the derivative of the potential (10) can be expanded. To first order, the equations of motion are then given by 10, 23
| (14) |
with prefactor . These equations describe waves, and by plugging in a plane-wave solution, we arrive at the dispersion relations
| (15) |
3 Experimental and computational droplet microfluidics
Having discussed the flow fields and the forces acting on a single droplet, we discuss the experimental realisation as well as computer simulations of flowing droplets in a straight microfluidic channel.
3.1 Microchip fabrication and droplet production
Microfluidic devices were fabricated in Sylgard 184 (Dow Corning) using standard soft lithographic protocols,31, 32 and the flow rates were volume-controlled by syringe pumps. Mono-disperse water droplets were generated in n-hexadecane (, ) with 2 wt% of the surfactant Span 80 using a step geometry,33, 32. The microchannel has uniform height and width of . Typical flow velocities are for the droplet, and for the continuous oil phase. The corresponding Reynolds and Peclet number are and , respectively.
3.2 Simulation approach: Multi-particle collision dynamics
In order to investigate the origin of our experimental observations and the validity of the approximations in the theoretical description, we conduct computer simulations using multi-particle collision dynamics (MPC). MPC is a mesoscopic simulation method that is capable of reproducing the full hydrodynamics of a fluid.34, 35, 36 Since it does not rely on the assumption of a specific flow perturbation, it is well suited to test the accuracy of the semi-analytical theory based on dipolar flow fields to describe the droplet interactions in a dense and confined system. The fluid is modelled explicitly by idealised point-like particles of mass . The fluid dynamics emerges from local mass, momentum and energy conservation in the particle ensemble, whose equation of state is that of an ideal gas. The update of particle positions and momenta mimics the underlying kinetics and is split into successive streaming and collision steps. During the streaming step the particle moves ballistically,
| (16) |
where is the time interval between collisions. In the collision step, the particles are sorted into cubic collision cells of size . In each cell, the particles then exchange momentum while the momentum of the collision cell is conserved. Various collision rules have been proposed in the literature and in this work, we employ a collision rule that also conserves angular momentum of the cell.37 The collisions are augmented with an Anderson-like thermostat to control the temperature. The overall update of particle velocities is
| (17) |
where is the centre of mass velocity of the collision cell containing particles, is the moment of inertia tensor of the particles, is the relative particle position, and is a random velocity drawn from a Maxwell-Boltzmann distribution. This collision operator is denoted as MPC-AT+ in the nomenclature of Ref. 38. In addition, the cell grid is shifted randomly before each collision step to restore Galilean invariance of the system.39 The dynamic viscosity of the MPC-AT+ fluid for large number density (particles per cell) is then given by
| (18) |
where is the imposed temperature and is the dimensionality of the system.
Since the droplets hardly deform in the experiment, we model them as rigid discs of radius that are coupled to the fluid by a no-slip boundary condition, i.e., where is the boundary velocity. It is to be noted that this is effectively a different boundary condition than the one used in deriving Eq. (4), however, we have found in practice that this can be accounted for by the calibration procedure described below and does not lead to a relevant difference in the measurements. To apply the collision rule in the cells that are partly or fully occupied by the rigid discs, the corresponding volume is filled with virtual particles that are distributed randomly within a layer of width and whose velocities are distributed according to a Maxwell-Boltzmann distribution around the boundary velocity .37 The momentum change of the fluid particles during streaming and collisions is accumulated and leads to the boundary force that moves the discs.40
On very short distances, hydrodynamics are not resolved and hence we add steric droplet-droplet and droplet-wall interactions by means of Weeks-Chandler-Anderson (WCA) potentials
| (19) |
where for droplet-droplet interactions, and for droplet-wall interactions. is the distance of the droplet centres, or the distance of the droplet centre from the wall surface, respectively. To account for the friction at the top and bottom of the Hele-Shaw cell, cf. Eq. (8), we apply a friction force to the discs where is the velocity of the droplet relative to the microchannel. The overall flow is driven by an external force corresponding to a constant pressure gradient across the channel.
The parameters of the MPC simulations are as follows. The size of a collision cell is and the time step is , where the time scale is , and is the mass of one MPC particle. The fluid density, the driving force and the friction are , , and . These parameters correspond to a fluid viscosity . The mass of the droplets is given by . The parameters for the WCA potential are and . We varied the channel width , the droplet spacing , and the initial configuration including the initial wavelength for simulating droplet trains in a channel.
In order to compare the simulation results to the experiments quantitatively, we determined the value from independent simulation runs with a single droplet under the same confinement. For a channel width of we obtained a value of which is on the order of the experimental parameters. The oil velocity is in the range , such that the typical Reynolds and Peclet number of the simulations are and , respectively. Note that the Peclet number is significantly lower than in the experiments. On the one hand, this leads to more pronounced fluctuations, but on the other hand, it allows us to observe in the simulations the onset of instabilities on accessible time scales, cf. section 4.4.
4 Controlled excitation and analysis of collective oscillations
Arrays of droplets flowing in a straight microchannel self-organise into two parallel trains of droplets with alternating lateral positions.41 For all neighbours of a droplet in this zigzag order, there exists a droplet such that the positions relative to satisfy and . Therefore, the flow fields of droplets and cancel at the position of droplet and no force is exerted due to the symmetry of the arrangement. The zigzag order is thus stable, and for a collective oscillation to emerge the symmetry of the droplet arrangement has to be broken. In the following, we describe ways to excite oscillations in an array of droplets and analyse quantitatively the collective modes observed in experiments and reproduced by computer simulations using MPC as described in section 3.2. The results demonstrate the rich dynamics that emerge from hydrodynamic interactions in confined microfluidic droplet ensembles.
4.1 Longitudinal oscillations


In simulations, one way to perturb the symmetry of a droplet train is to vary the spacing by introducing ‘gaps’ between the incoming droplets in regular intervals. The resulting arrangement for the case of an alternating sequence of two different distances between subsequent droplets is illustrated in figure 2. The droplet crystal now consists of pairs of laterally displaced droplets. For an isolated pair of spherical droplets, the hydrodynamic forces do not lead to relative particle motion,15 owing to the time reversibility in the Stokes regime. In an ensemble, however, the pairs are also affected by the neighbouring pairs. In the perturbed zigzag arrangement, the pairs are separated by a larger distance than the droplets in the pair, and due to these gaps the configuration of the ensemble to the right of any droplet is different from the configuration on its left. Consequently, the flowing droplets can experience a net hydrodynamic force and undergo relative motion.
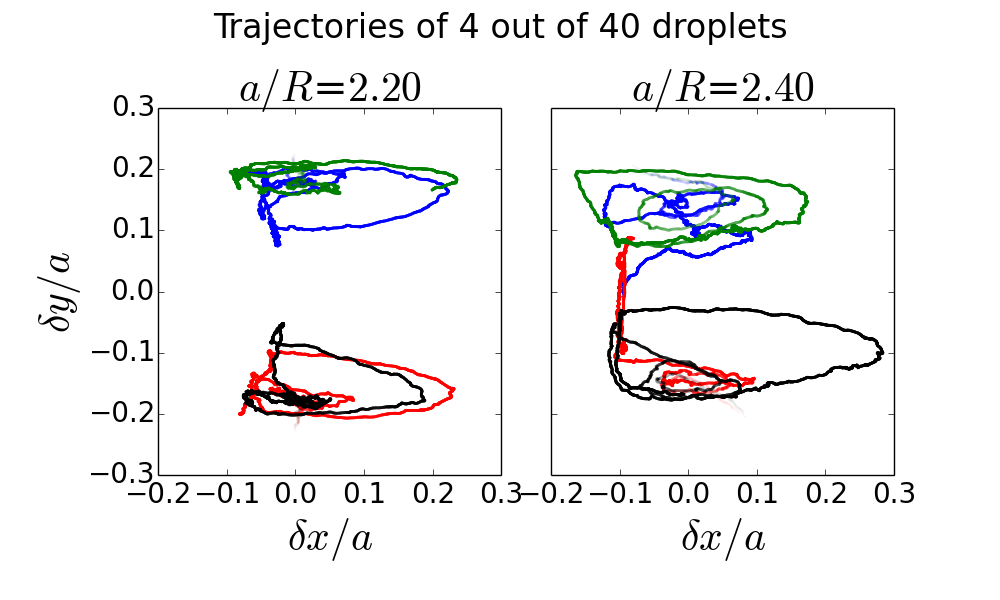
We observe that the leading droplet of the pair moves faster than the trailing droplet. It separates and catches up with the trailing droplet of the pair ahead of the original one, thus forming a new pair. This process repeats with the new pairs and creates a longitudinal oscillation of the droplet distances in the train, where adjacent droplets are in anti-phase.† Figure 3 shows the motion pattern for this droplet arrangement in the co-moving frame of reference. The behaviour shows some similarity to the pairing cascades observed in finite droplet trains 15, however, in an infinite crystal the pairs cannot separate and keep interacting such that the oscillatory motion ensues. This is also reminiscent of the behaviour of colloidal particles driven by a constant external pulling force to move on a ring.42 The motion patterns further reveal that in the initial stage, the transverse amplitude is small and the droplets stay on one or the other side of the channel. In this phase, the configuration space trajectory of the droplets has a circular pattern. Over time, however, the transverse amplitude is growing and the droplets eventually cross the centre-line of the channel, as can be seen in figure 3 for .
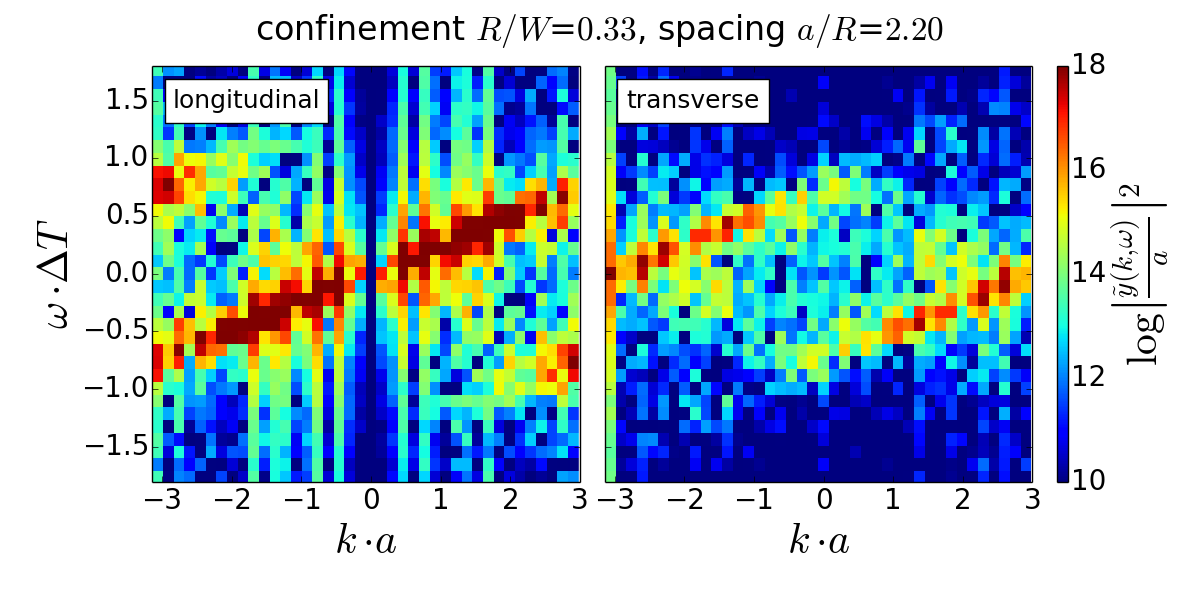
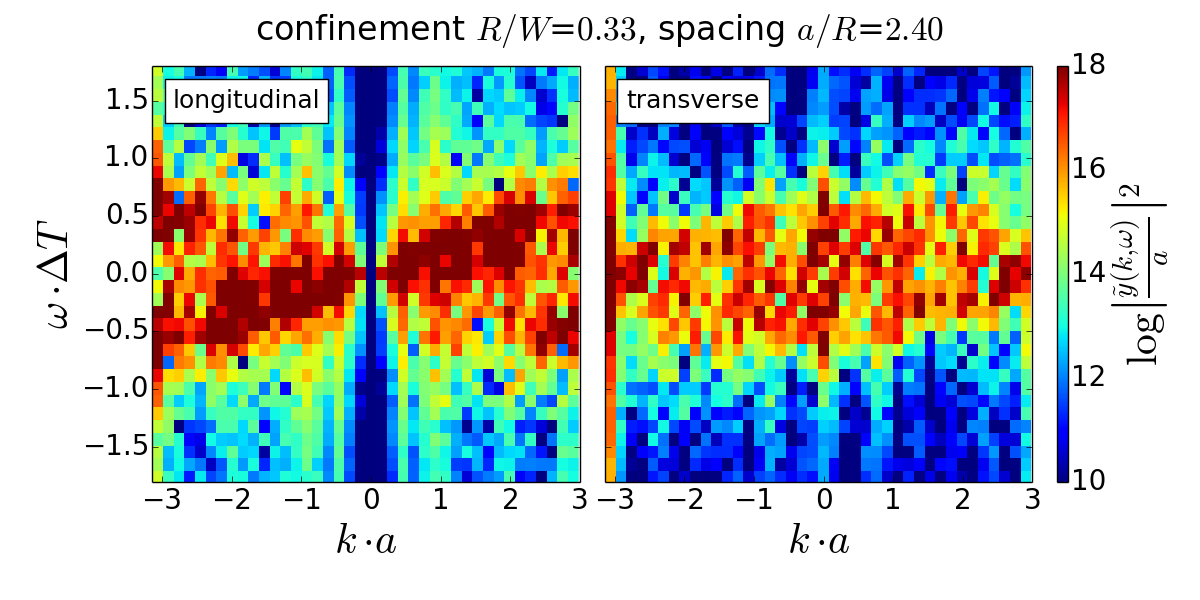
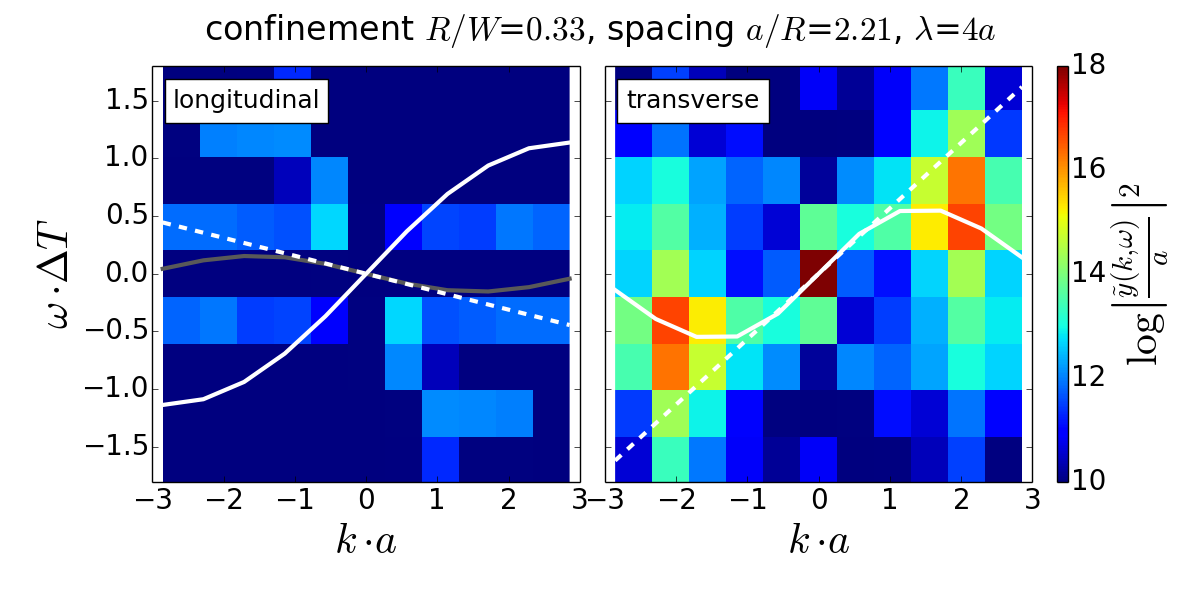
The longitudinal and transverse power spectra of the droplet oscillations observed in simulations are shown in figure 4. For the smaller spacing , a clear signature of longitudinal oscillations is observed. The accompanying transverse oscillations are from droplets moving towards the centre of the channel and back without crossing the channel. For larger spacing the power spectra show more scattered features without a clear signature indicating the limited stability the gap modes. The longitudinal spectrum has a strong signature which is due to fluctuations, but there are also distinct signals at indicating a zigzag wave.
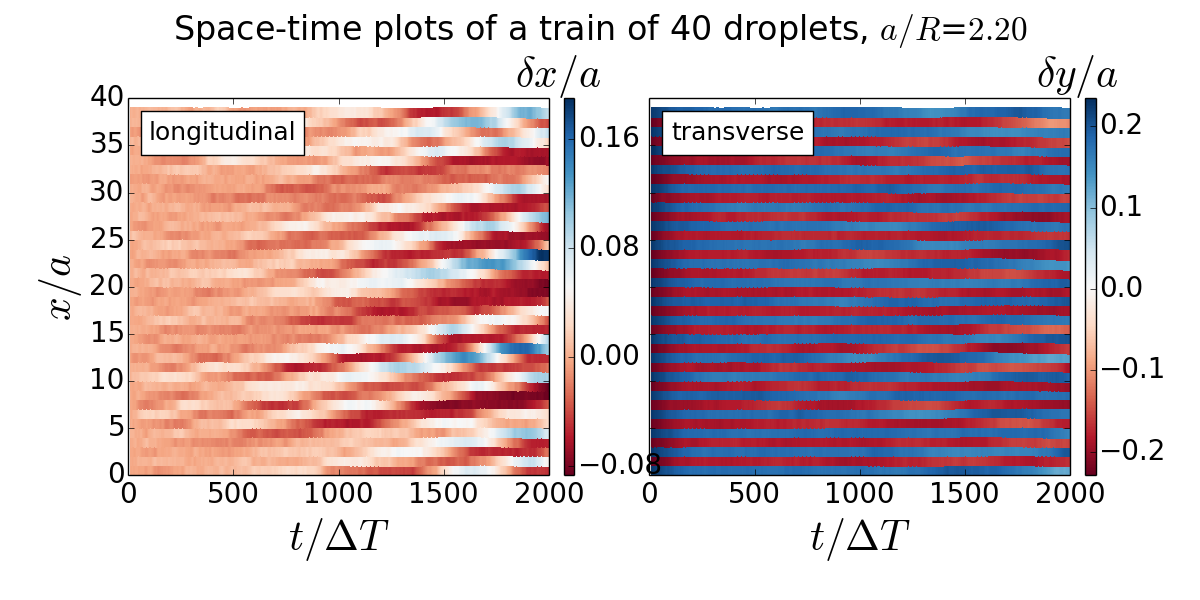
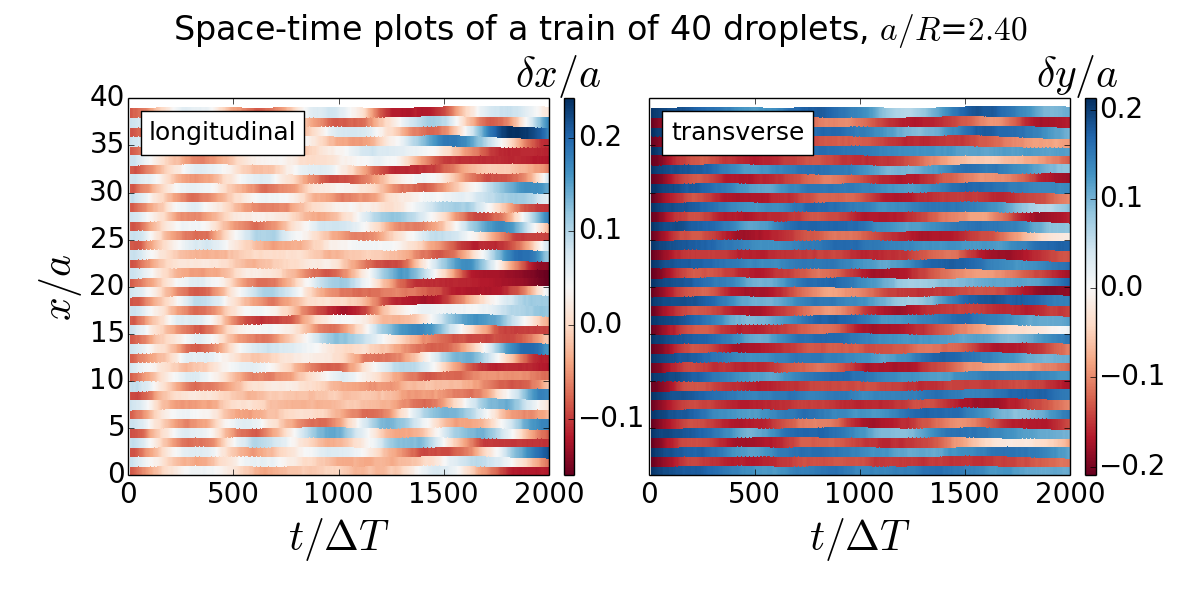
The space-time plot of the droplet distance in figure 5 shows for small times a pattern of horizontal stripes in the both the longitudinal and transverse displacements, which indicates that in the co-moving frame, the excited mode is initially a standing wave. For longer times, the pattern changes as a travelling wave seems to develop. These results suggest that the stability of the longitudinal pairing wave is limited, as we discuss in more detail below.
4.2 Transverse oscillations

Another protocol to excite waves in the microfluidic crystal is to exchange the positions of a pair of droplets. Such ‘defects’ can be created experimentally by guiding the zigzag arrangement of droplets around a rectangular microfluidic bend, see figure 6 a). At the bend, the two droplets of a pair exchange their longitudinal position as depicted. During this process, the passing droplet creates an accelerated flow at its trailing edge which prevents the following pair from exchanging positions. Under suitable conditions, every second pair undergoes a positional reordering such that the translational symmetry of the droplet train is broken. Hence, in the resulting droplet arrangement after the bend the droplets experience a net hydrodynamic force. For certain droplet respectively channel dimensions, the bend allows to systematically create such defects in the translational symmetry of the crystal, and if defects are created periodically a global oscillation patterns emerge. The collective oscillations are very stable and could be observed for channel lengths up to 10 cm, i.e. after travel distances which are four orders of magnitude larger than a typical droplet radius. The wavelength in longitudinal direction depends on both the droplet size and the droplet spacing. By a variation of these parameters, various initial wavelengths can be excited.


Within a certain parameter range, we can achieve accurate control of the amplitude of the transverse oscillations by tuning the droplet radius , since the amplitude of the transverse oscillations is equal to , where is the channel width. Figure 7 shows three examples of structures with variable wavelength and amplitude. They were obtained from zigzag structures with equal droplet spacing but with different droplet radii , , and which represent the case of the largest, intermediate, and smallest wavelength producible. The first structure presents droplets, the second droplets, and the last structure droplets per wavelength. From the microscopy time series we extract the trajectories and from the trajectories we could extract the transverse phonon spectra, see figure 8, which reveal the presence of two peaks for the transverse oscillations. These peaks indicate that the excitations have distinctive wavelengths for both longitudinal and transverse modes.
The same type of droplet wave also emerges in computer simulations when a triangle wave is used as initial condition, see figure 9. Various wavelengths can be excited which are found to behave qualitatively the same. In the following, we analyse results obtained for wavelengths and , corresponding to five and six droplets within one wavelength, respectively. Figure 10 shows the trajectories of the droplets in the co-moving frame of reference. We find that both the longitudinal and transverse coordinates oscillate around the equilibrium position. The configuration-space trajectory of each droplet describes a figure-eight pattern. While for the figure-eight pattern is almost symmetric, it is clearly antisymmetric for . This is a consequence of an antisymmetric initial arrangement of droplets at the top and bottom walls where two neighbouring droplets are close to the top walls, while a single droplet is close to the bottom wall. The trajectories in figure 10 suggest that this asymmetry is maintained in the oscillatory motion.† The trajectories are reminiscent of the bound-state motion pattern of an isolated pair of rigid discs in two-dimensional Poiseuille flow 14. Quantitatively, however, the state diagrams in Ref. 14 seem to predict cross-swapping trajectories for the relatively large displacements ( and ) in the wave configurations considered here. We conclude that here the ensemble arrangement stabilises the oscillatory states, as already observed for the pairing waves as discussed in section 4.1 for the cascade of droplet pairing.


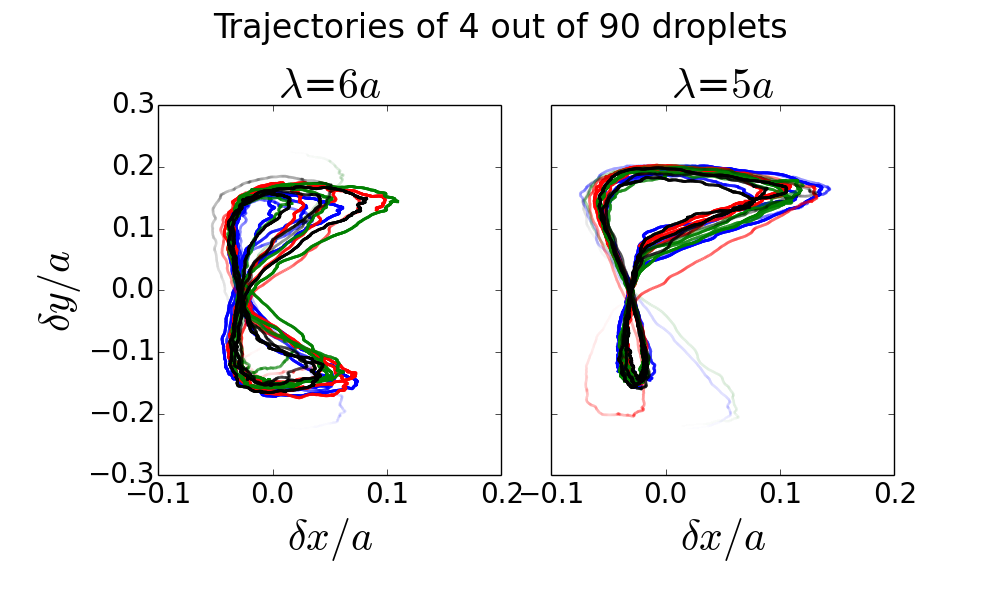
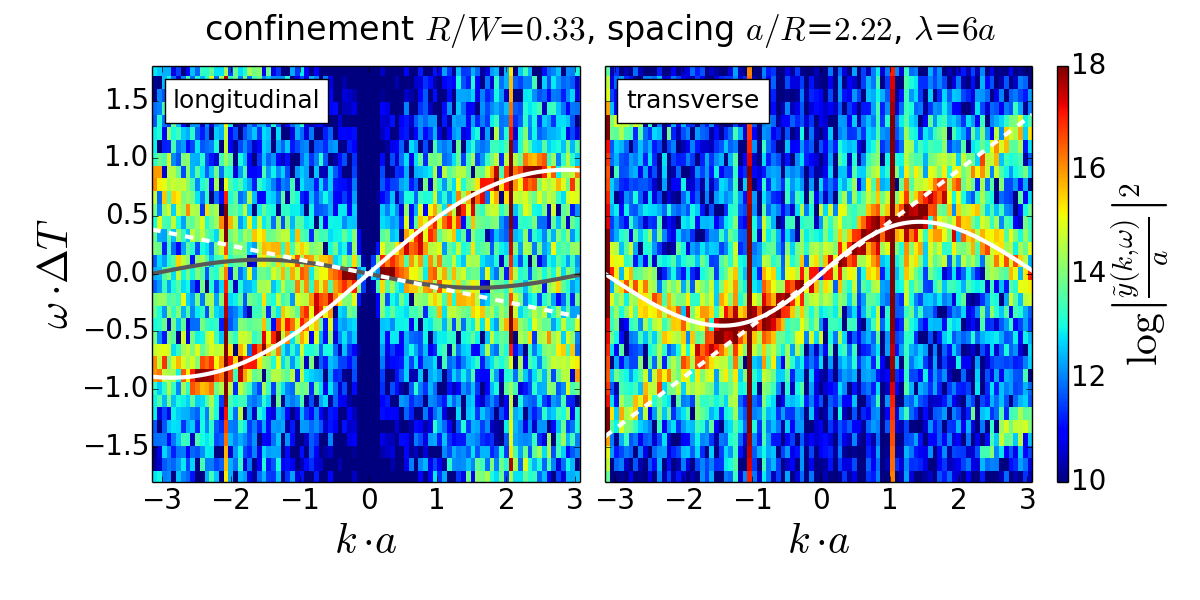
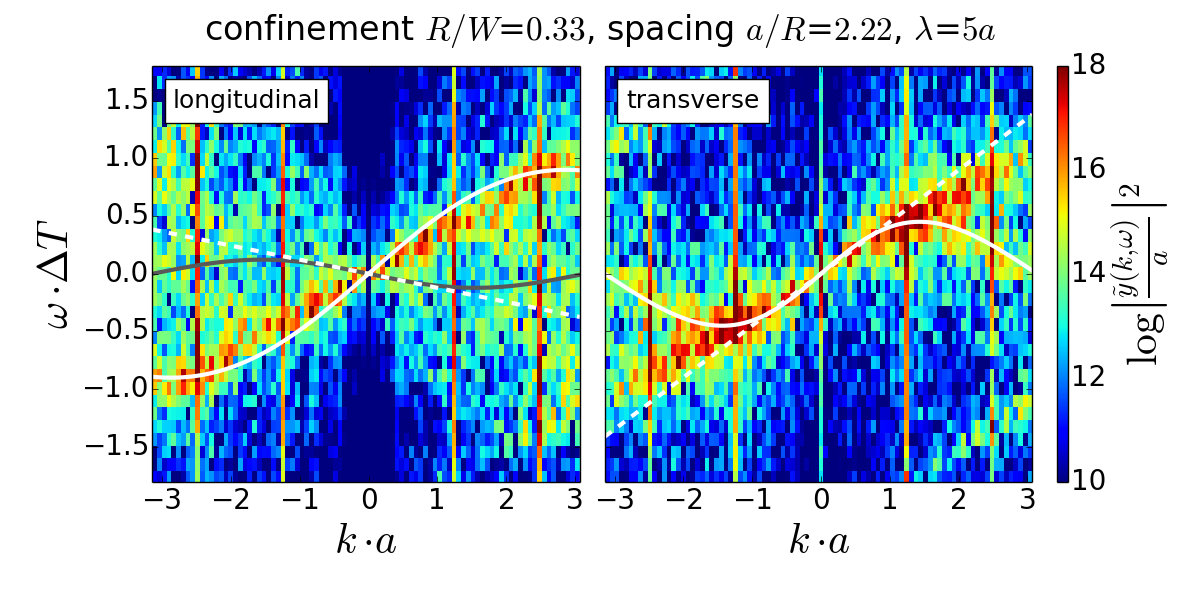
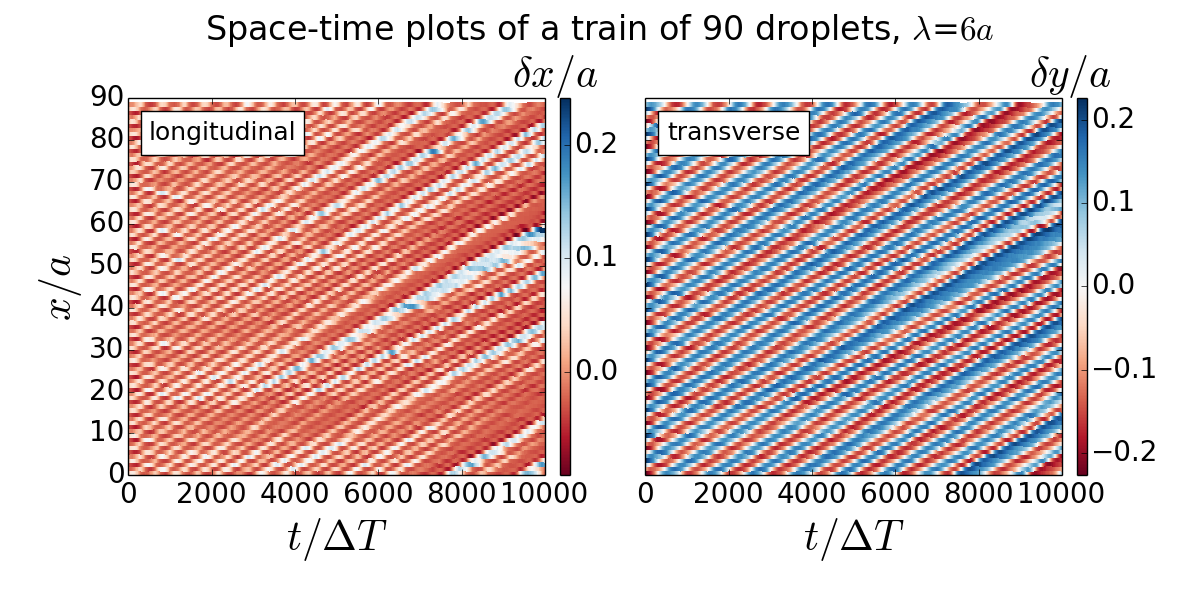
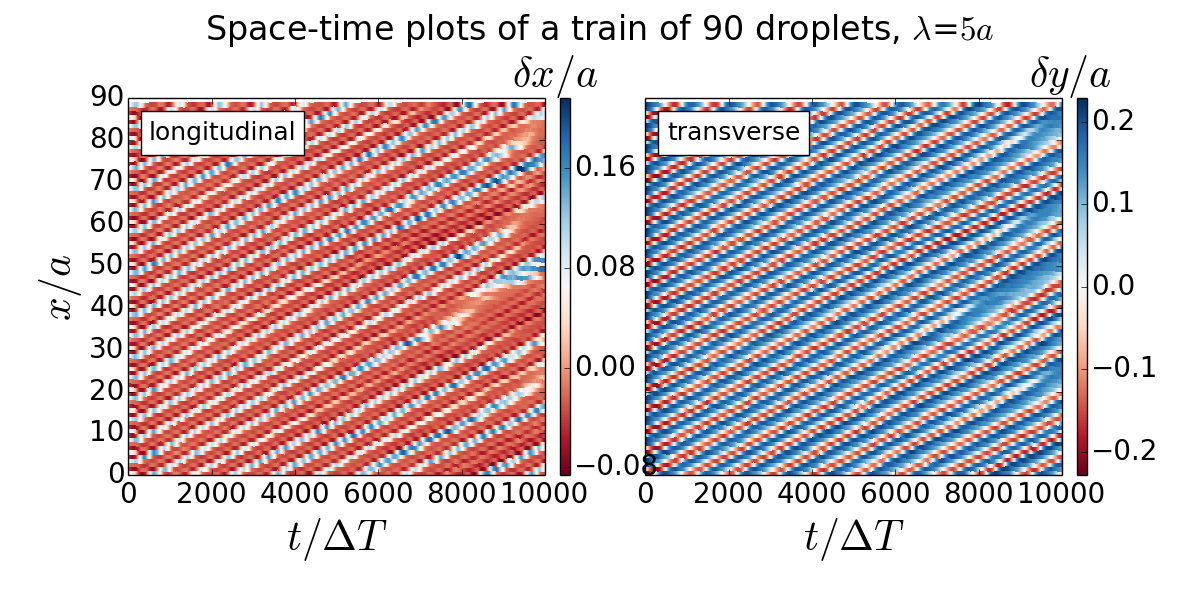
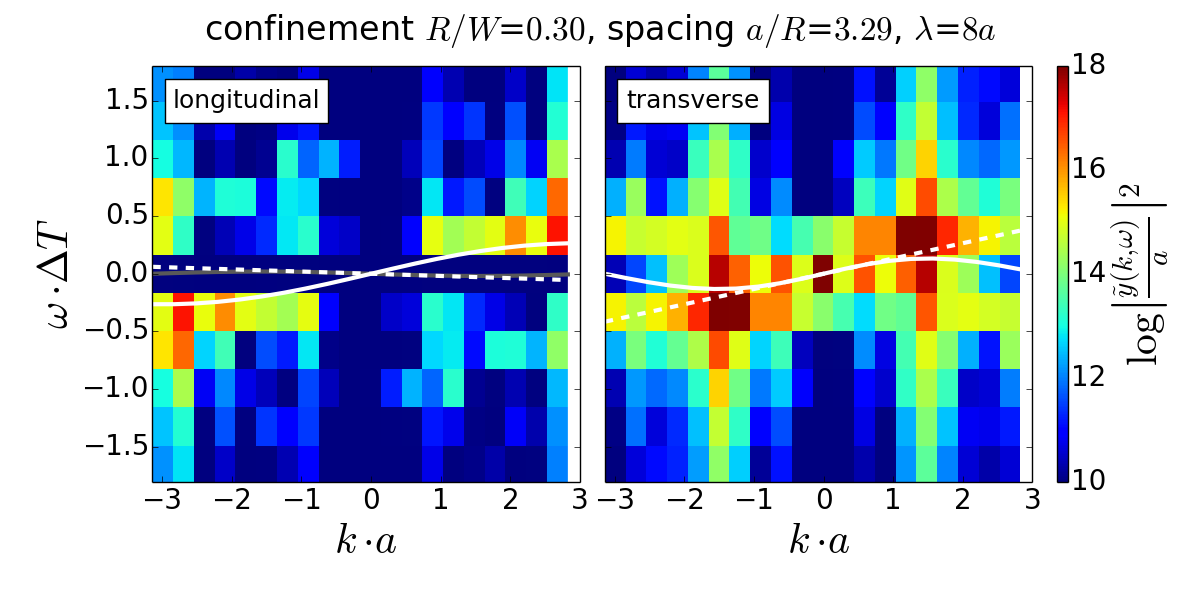
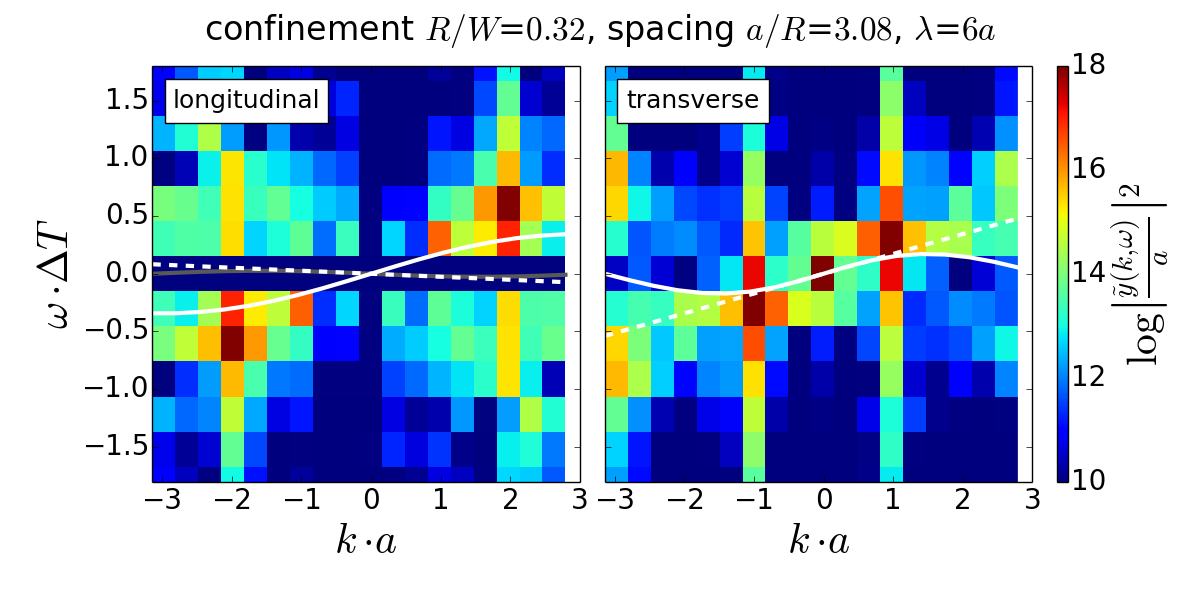
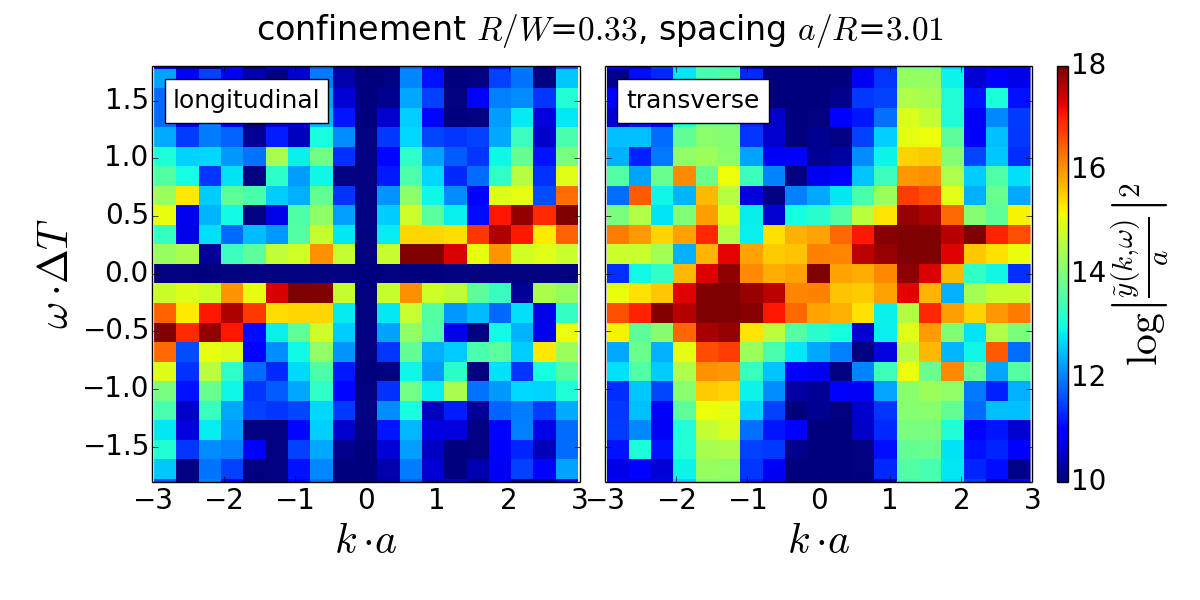
Figure 11 shows the longitudinal and transverse power spectra of the waves depicted in figure 9. The transverse power spectrum from simulations shows a continuous signature where the dependence of the frequency on the wave-vector has a sine-like shape. Such a dispersion relation is reminiscent of microfluidic phonons.21, 10 The dispersion relation predicted by the linearised far-field theory for confined microfluidic phonons,19, 10 cf. section 2, is plotted on top of the spectra and shows excellent quantitative agreement. It is worthwhile to note that the calibration procedure described in section 3.2 fixes all parameters such that no fitting is needed. The space-time plot of the droplet distance in figure 12 confirms that the wave is travelling in the flow direction along the droplet crystal, and is considerably more stable than the longitudinal waves discussed above. At long times, gaps start forming and the crystal breaks up into smaller sub-units. These results show that the excited transverse wave is an acoustic microfluidic phonon, and our experimental approach enables us to specifically excite such modes with a large amplitude. The power spectra also show a clear signature of longitudinal oscillations which is explained in detail in the following subsection.
Here it is also possible to increase experimentally the amplitude of the longitudinal waves by increasing the distance between the droplets. A droplet train with such ‘gaps’ is shown in figure 13 along with the corresponding longitudinal and transverse power spectra. Compared to the sine-like waves without gaps, cf. figure 8, the transverse modes here exhibit a broader signal around the main wavelength. Moreover, the longitudinal signature extends over a whole range of wavelength, similar to the longitudinal modes observed in computer simulations, cf. figure 4. This indicates that a range of wavelengths have been excited longitudinally by increasing the droplet spacing, while the transverse sine-like wave is still predominant. From the optofluidic point of view, these heterogeneous structures are the most interesting. When the droplet distance approaches the hydrodynamic screening length, more heterogeneous structures are observed in line with the results from computer simulations in section 4.1.

4.3 Coupling of longitudinal and transverse oscillations
The experimental and numerical power spectra in figure 8 and 11 also show a clear signature of longitudinal oscillations, in particular for the simulation results. The dominant frequencies from experimental measurements agree quantitatively with the simulation results. However, the dispersion relation of the longitudinal modes is qualitatively different from the prediction of the linearised theory. The frequency curve for acoustic phonons, c.f. Eq. (15), is plotted as a grey line in figure 11 and describes waves that propagate upstream, whereas the observed frequencies indicate a positive group velocity. The shape of the measured frequency curve resembles instead the shape of the transverse dispersion relation , yet the maximum appears shifted towards the edge of the Brillouin zone and has a higher frequency than the maximum of .
The anomalous properties of the longitudinal modes are also apparent in the correlation strength
| (20) |
between longitudinal and transverse modes
| (21) |
The correlation strength for the transversely excited oscillations is shown in figure 14 and indicates that longitudinal and transverse modes strongly correlate if and have the same sign. This is in contrast to correlations that are expected for purely acoustic phonons, where the matching condition is expected.22 Furthermore, by employing the frequencies for correlated wave-vectors in the observed dispersion relations (figure 11), we find that the matching waves approximately obey . These observations indicate a strong coupling of the longitudinal modes to the transverse oscillation which is beyond a linearised far-field theory. This coupling is induced by the relatively large amplitude of the transverse waves which brings the droplets close to the wall where the imposed flow is not uniform but decays due to no-slip boundary conditions.23 The droplets are slowed down at both channel walls which leads to the figure-eight trajectories seen in figure 10. In the co-moving frame, the droplets move backwards when they are close to the wall, and forward when they cross the channel. During one transverse cycle, two wall approaches take place such that
in agreement with the matching condition found above. Inspection of the spatial wave patterns reveals that a full longitudinal wave extends over each crest or trough of the transverse wave, hence
Combining these conditions leads to the dispersion relation
| (22) |
This relation is also plotted in figure 11 and is in remarkable quantitative agreement with the signature of the longitudinal oscillations.
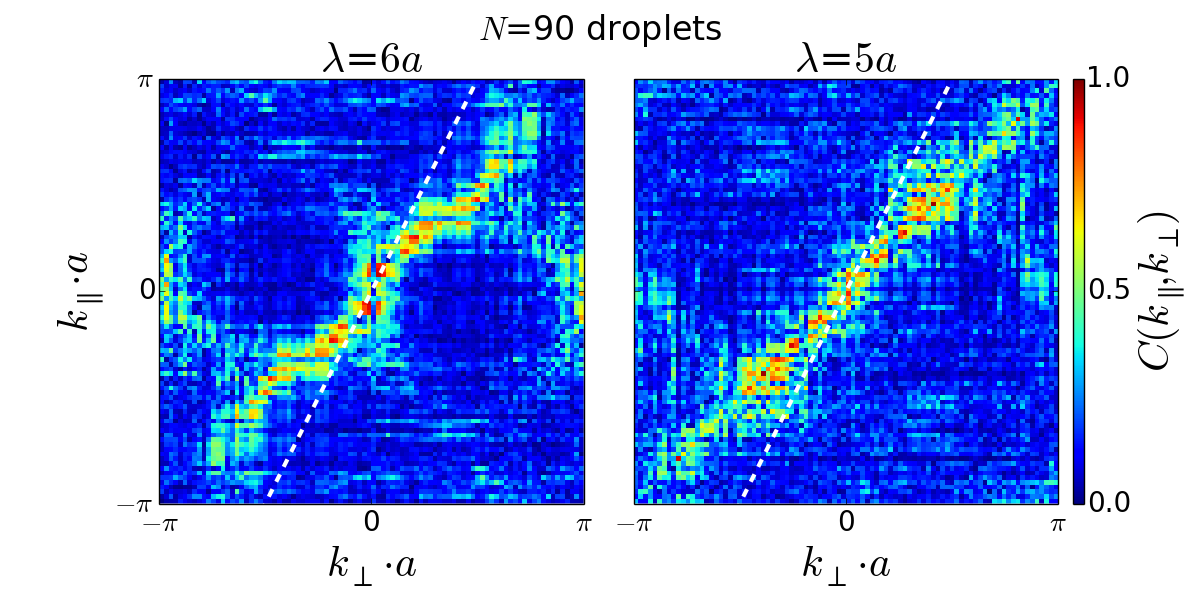
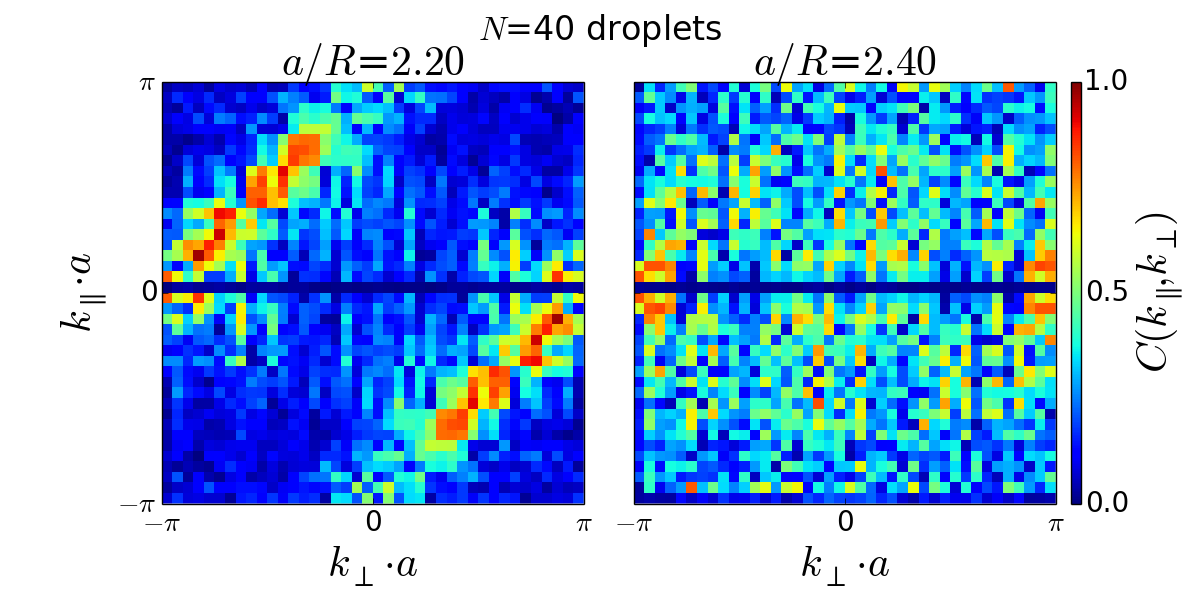
The correlation strength for the longitudinal pairing waves discussed in section 4.1 is shown in figure 15. Here, the oscillations seem to be highly correlated in a region where . However, this pattern was only found if the gaps between pairs were small, and since the pairing waves are considerably less stable, it is difficult to clearly identify the origin.
We conclude that the lateral confinement in connection with the considerable amplitude of the transverse excitations leads to a strong interaction of longitudinal and transverse waves in confined microfluidic crystals. It is interesting to note that for the excitation mechanism studied here, this coupling does not seem to lead to an instability. A possible explanation is that in the dense droplet crystal, longitudinal oscillations cannot grow due to steric constraints between the droplets.
4.4 Long-time behaviour and stability
While the transverse waves excited by positional exchange appear to be relatively stable, the pairing waves excited by the introduction of gaps in the droplet train persist only for much shorter times. This is evident in the space-time plot of the longitudinal droplet distance in figure 16, which extends the time scale of figure 5 by 5 five times and shows that the initial order disappears and other patterns emerge. One feature that is visible for a range of initial gap widths is the formation of subregions with small longitudinal droplet distances (dark red regions in the space-time plot). Inspection of configuration snapshots reveals that in these subregions, the droplets arrange in a dense zigzag order without oscillations. We hypothesise that the formation of these ordered regions as observed in simulations is similar to flow-induced crystallisation.43 The ‘frozen’ parts of the droplet train propagate with a velocity that depends on the size of the subregion, and due to different velocities some zigzag clusters catch up and merge with others. Simulation trajectories reveal that the droplets crystallise at the leading edge and melt at the trailing edge of the subregions. In between the ordered regions, the droplet train is disordered. In some instances, we observe a phonon-like transverse wave that develops in these regions.† One simulation snapshot of a droplet train that simultaneously exhibits an ordered zigzag region and a transverse phonon wave is shown in figure 17.
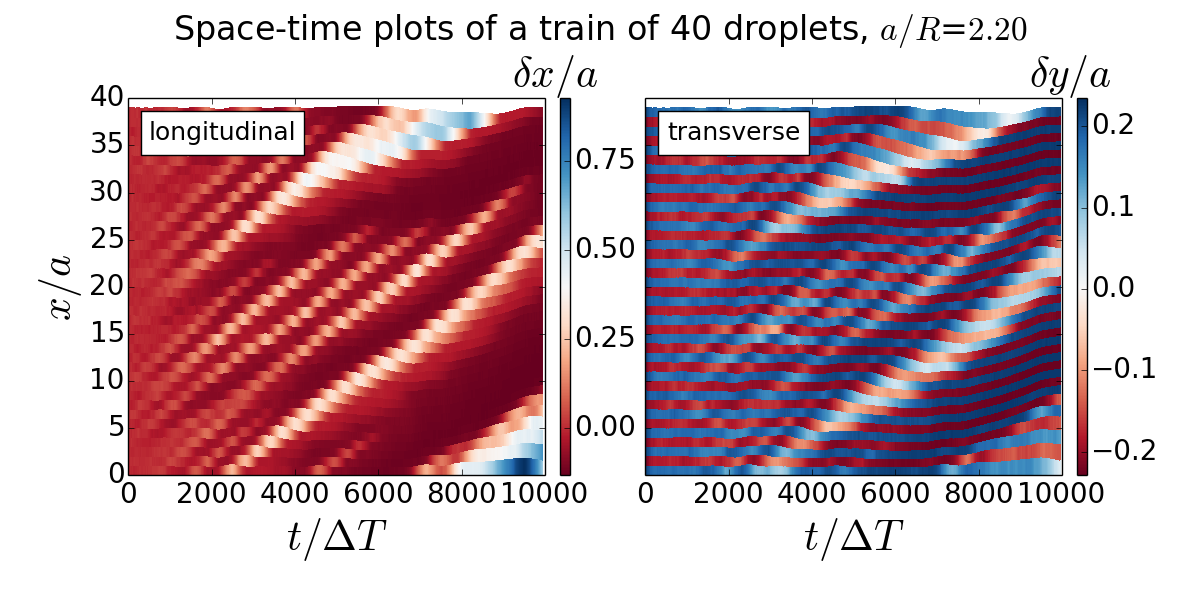
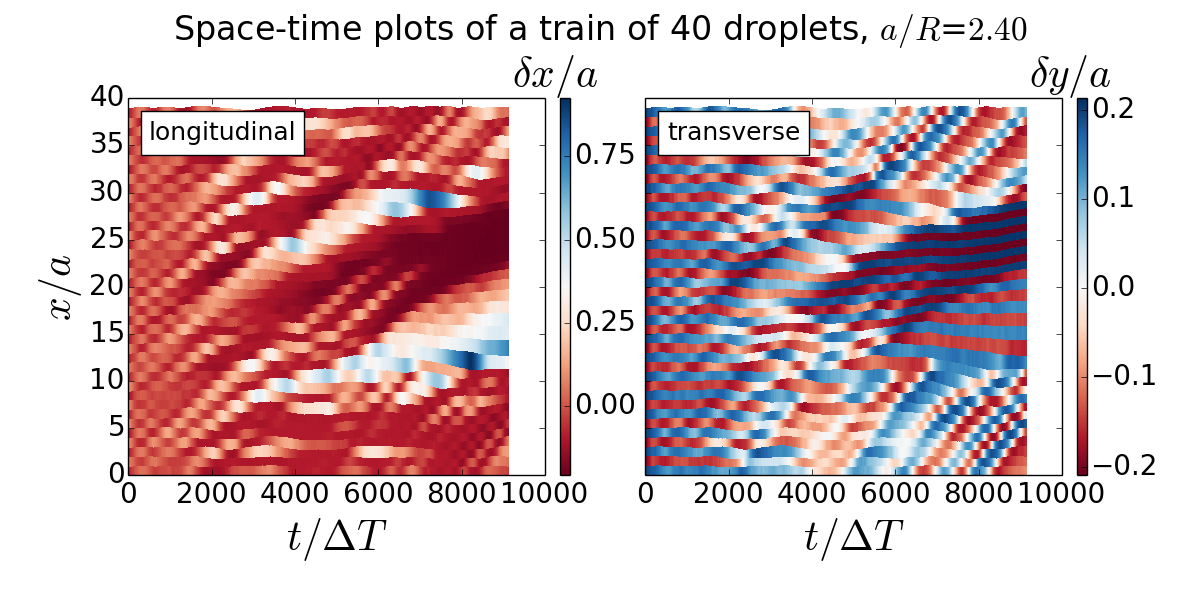
In the simulations, the long-time behaviour is significantly affected by thermal fluctuations, which tend to lead to a disordered droplet ensemble where the crystal structure disappears. When the droplets move away from their regular crystal positions, they can be regarded as a continuous ensemble, and the finite-differences in the equation of motion are to be replaced by a continuum approximation 44, 45 for small
| (23) |
Using this continuum approximation to derive the equations of motion and the dispersion relation as in section 2, we obtain
| (24) |
These relations are plotted as dashed lines on the power spectra in figure 11. The longitudinal pairing waves clearly show a dispersion branch that is linear in , and the spectra of the transverse waves also have a signal that agrees with a linear dispersion relation. We find that this part of the spectrum becomes more pronounced at longer simulation times, which supports our hypothesis that the droplet train becomes disordered due to fluctuations. Overall our analysis sheds some light on the long-time behaviour of oscillations in microfluidic crystals, however, more data will be needed to study the onset and growth of instabilities further.

5 Summary and discussion
Excitation mechanisms for collective waves in microfluidic crystals have been investigated. We have demonstrated that both longitudinal and transverse waves can be systematically excited by creating specific defect patterns. Experimental results were confirmed by computer simulations, and our results reveal instabilities and mode coupling that originate from the underlying hydrodynamics.
The excited longitudinal modes show cascades of pairs of laterally displaced droplets. Due to the pairing instability, the pairing cascade is rather short-lived, and over time other modes are observed. Since the constraints prevent the dense crystal from becoming completely disordered, some parts ‘freeze’ into a zigzag arrangement while others exhibit transverse oscillation. This is a possible indication of flow-induced crystallisation, and it will be interesting to further investigate the dynamic formation of the inhomogeneous regions.
The transverse waves show the dispersion relation of a microfluidic phonon. Comparison with the analytical prediction demonstrates that a linearised far-field theory works well even in a dense droplet crystal. A possible reason is the relatively strong lateral confinement, which may screen the higher-order reflections of the dipolar interactions. The power spectra of the oscillations exhibit a correlation that arises from a coupling of longitudinal to transverse modes. This coupling is induced by the boundary conditions at the confining channel walls. At large amplitudes, the inhomogeneity of the imposed flow affects the dynamics of the droplets and leads to novel collective modes. Our results thus shed light on the mechanisms underlying non-linear mode coupling in microfluidic crystals.
Experimentally, the excited waves are highly stable and do not undergo instabilities. This raises the question whether some of the instabilities observed in microfluidic crystals 10, 15 are suppressed in the dense droplet ensembles studied here. Large displacements are inhibited by steric interactions between the droplets which may have a stabilising effect, e.g., on the pairing cascades. A detailed study of the impact of geometric constraints on the stability of the collective modes is a topic for future research. In the simulations, the smaller Peclet number leads to a more pronounced influence of thermal fluctuations. This opens up the possibility for fluctuation-induced instabilities and our simulation approach may thus be used to investigate instabilities in microfluidic devices.
The good agreement of the experimental and numerical results with the linearised far-field prediction suggests that the dynamics of dense and confined microfluidic droplets is accessible theoretically and leads to novel insights into the origin of instabilities and mode coupling effects. Furthermore, it seems promising to apply the experimental and numerical techniques to other microfluidic systems, such as dense droplet systems in 2D, crowded particle systems, or self-propelled particles. Finally, the experimental techniques may be used to control particle flows in microfluidic applications such as flow cytometry or high-throughput assays using microchips.
Acknowledgements
The authors would like to thank Tsevi Beatus, Itamar Shani, Roy Bar-Ziv and Roland G. Winkler for valuable discussions. R.S. and J.-B.F. gratefully acknowledge financial support by the DFG grant SE 1118/4.
References
- Huebner et al. 2008 A. Huebner, L. F. Olguin, D. Bratton, G. Whyte, W. T. S. Huck, A. J. de Mello, J. B. Edel, C. Abell and F. Hollfelder, Anal. Chem., 2008, 80, 3890–3896.
- Köster et al. 2008 S. Köster, F. E. Angile, H. Duan, J. J. Agresti, A. Wintner, C. Schmitz, A. C. Rowat, C. A. Merten, D. Pisignano, A. D. Griffiths and D. A. Weitz, Lab Chip, 2008, 8, 1110–1115.
- Stone et al. 2004 H. Stone, A. Stroock and A. Ajdari, Annu. Rev. Fluid Mech., 2004, 36, 381–411.
- Mao et al. 2009 X. Mao, S.-C. S. Lin, C. Dong and T. J. Huang, Lab Chip, 2009, 9, 1583–1589.
- Squires and Quake 2005 T. M. Squires and S. R. Quake, Rev. Mod. Phys., 2005, 77, 977–1026.
- Baron et al. 2008 M. Baron, J. Bławzdziewicz and E. Wajnryb, Phys. Rev. Lett., 2008, 100, 174502.
- Baroud et al. 2010 C. N. Baroud, F. Gallaire and R. Dangla, Lab Chip, 2010, 10, 2032–2045.
- Theberge et al. 2010 A. B. Theberge, F. Courtois, Y. Schaerli, M. Fischlechner, C. Abell, F. Hollfelder and W. T. S. Huck, Angew. Chem. Int. Ed., 2010, 49, 5846–5868.
- Seemann et al. 2012 R. Seemann, M. Brinkmann, T. Pfohl and S. Herminghaus, Rep. Prog. Phys., 2012, 75, 016601.
- Beatus et al. 2012 T. Beatus, R. Bar-Ziv and T. Tlusty, Phys. Rep., 2012, 516, 103–145.
- Diamant 2009 H. Diamant, J. Phys. Soc. Jpn., 2009, 78, 041002.
- Campa et al. 2009 A. Campa, T. Dauxois and S. Ruffo, Phys. Rep., 2009, 480, 57–159.
- Thutupalli et al. 2014 S. Thutupalli, J.-B. Fleury, U. D. Schiller, G. Gompper, S. Herminghaus and R. Seemann, in Engineering of Chemical Complexity II, ed. A. S. Mikhailov and G. Ertl, World Scientific, 2014, ch. 8, pp. 125–148.
- Reddig and Stark 2013 S. Reddig and H. Stark, J. Chem. Phys., 2013, 138, 234902.
- Janssen et al. 2012 P. J. A. Janssen, M. D. Baron, P. D. Anderson, J. Blawzdziewicz, M. Loewenberg and E. Wajnryb, Soft Matter, 2012, 8, 7495–7506.
- Uspal et al. 2013 W. E. Uspal, H. Burak Eral and P. S. Doyle, Nat. Commun., 2013, 4, 2666.
- Adler 1981 P. Adler, J. Colloid Interf. Sci., 1981, 84, 461–473.
- Ekiel-Jeżewska and Wajnryb 2009 M. L. Ekiel-Jeżewska and E. Wajnryb, J. Phys. Cond. Matt., 2009, 21, 204102.
- Beatus et al. 2009 T. Beatus, T. Tlusty and R. Bar-Ziv, Phys. Rev. Lett., 2009, 103, 114502.
- Beatus et al. 2006 T. Beatus, T. Tlusty and R. Bar-Ziv, Nature Phys., 2006, 2, 743–748.
- Beatus et al. 2007 T. Beatus, R. Bar-Ziv and T. Tlusty, Phys. Rev. Lett., 2007, 99, 124502.
- Liu et al. 2012 B. Liu, J. Goree and Y. Feng, Phys. Rev. E, 2012, 86, 046309.
- Fleury et al. 2014 J.-B. Fleury, U. D. Schiller, S. Thutupalli, G. Gompper and R. Seemann, New J. Phys., 2014, 16, 063029.
- Hashimoto et al. 2006 M. Hashimoto, B. Mayers, P. Garstecki and G. Whitesides, Small, 2006, 2, 1292–1298.
- Chen et al. 2012 Z. Chen, Z. Yong, C. W. Leung, X. Zhang, Y. Chen, H. L. W. Chan, and Y. Wang, Optics Express, 2012, 20, 24330–24341.
- Uspal and Doyle 2014 W. E. Uspal and P. S. Doyle, Soft Matter, 2014, 10, 5177.
- Bensimon et al. 1986 D. Bensimon, L. P. Kadanoff, S. Liang, B. I. Shraiman and C. Tang, Rev. Mod. Phys., 1986, 58, 977–999.
- Tlusty 2006 T. Tlusty, Macromolecules, 2006, 39, 3927–3930.
- Lamb 1932 H. Lamb, Hydrodynamics, Dover, 1932.
- Milne-Thomson 1962 L. Milne-Thomson, Theoretical Hydrodynamics, McMillan, 1962.
- Duffy et al. 1998 D. C. Duffy, J. C. McDonald, O. J. A. Schueller and G. M. Whitesides, Anal. Chem., 1998, 70, 4974–4984.
- Chokkalingam et al. 2008 V. Chokkalingam, S. Herminghaus and R. Seemann, Appl. Phys. Lett., 2008, 93, 254101–3.
- Priest et al. 2006 C. Priest, S. Herminghaus and R. Seemann, Appl. Phys. Lett., 2006, 88, 024106–3.
- Malevanets and Kapral 1999 A. Malevanets and R. Kapral, J. Chem. Phys., 1999, 110, 8605–8613.
- Kapral 2008 R. Kapral, Adv. Chem. Phys., 2008, 140, 89.
- Gompper et al. 2009 G. Gompper, T. Ihle, D. M. Kroll and R. G. Winkler, Adv. Poly. Sci., 2009, 221, 1–87.
- Götze et al. 2007 I. O. Götze, H. Noguchi and G. Gompper, Phys. Rev. E, 2007, 76, 046705.
- Noguchi and Gompper 2008 H. Noguchi and G. Gompper, Phys. Rev. E, 2008, 78, 016706.
- Ihle and Kroll 2001 T. Ihle and D. M. Kroll, Phys. Rev. E, 2001, 63, 020201.
- Götze and Gompper 2011 I. O. Götze and G. Gompper, Phys. Rev. E, 2011, 84, 031404.
- Thorsen et al. 2001 T. Thorsen, R. W. Roberts, F. H. Arnold and S. R. Quake, Phys. Rev. Lett., 2001, 86, 4163–4166.
- Lutz et al. 2006 C. Lutz, M. Reichert, H. Stark and C. Bechinger, Europhys. Lett., 2006, 74, 719.
- Vermant and Solomon 2005 J. Vermant and M. J. Solomon, J. Phys. Cond. Matt., 2005, 17, R187.
- Rosenau 1986 P. Rosenau, Phys. Lett. A, 1986, 118, 222–227.
- Wattis 2000 J. A. D. Wattis, J. Phys. A, 2000, 33, 5925.