[]RCR and EX are joint first authors who contributed equally to this work
[]RCR and EX are joint first authors who contributed equally to this work
Pathways to dewetting in hydrophobic confinement
Abstract
Liquid water can become metastable with respect to its vapor in hydrophobic confinement. The resulting dewetting transitions are often impeded by large kinetic barriers. According to macroscopic theory, such barriers arise from the free energy required to nucleate a critical vapor tube that spans the region between two hydrophobic surfaces – tubes with smaller radii collapse, whereas larger ones grow to dry the entire confined region. Using extensive molecular simulations of water between two nanoscopic hydrophobic surfaces, in conjunction with advanced sampling techniques, here we show that for inter-surface separations that thermodynamically favor dewetting, the barrier to dewetting does not correspond to the formation of a (classical) critical vapor tube. Instead, it corresponds to an abrupt transition from an isolated cavity adjacent to one of the confining surfaces to a gap-spanning vapor tube that is already larger than the critical vapor tube anticipated by macroscopic theory. Correspondingly, the barrier to dewetting is also smaller than the classical expectation. We show that the peculiar nature of water density fluctuations adjacent to extended hydrophobic surfaces – namely, the enhanced likelihood of observing low-density fluctuations relative to Gaussian statistics – facilitates this non-classical behavior. By stabilizing isolated cavities relative to vapor tubes, enhanced water density fluctuations thus stabilize novel pathways, which circumvent the classical barriers and offer diminished resistance to dewetting. Our results thus suggest a key role for fluctuations in speeding up the kinetics of numerous phenomena ranging from Cassie-Wenzel transitions on superhydrophobic surfaces, to hydrophobically-driven biomolecular folding and assembly.
The favorable interactions between two extended hydrophobic surfaces drive numerous biomolecular and colloidal assemblies [1, 2, 3, 4, 5], and have been the subject of several theoretical, computational, and experimental inquiries [6, 7, 8, 9, 10, 11, 12, 13, 14, 15, 16, 17, 18, 19, 20, 21, 22]. Examples include the association of small proteins to form multimeric protein complexes, of amphiphlic block copolymers, dendrimers, or proteins to form vesicular suprastructures, and of patchy colloidal particles into complex crystalline lattices [23, 24, 25, 26, 27]. When two such hydrophobic surfaces approach each other, water between them becomes metastable with respect to its vapor at a critical separation, , that can be quite large [8, 9, 28, 29, 30]. For nanometer-sized surfaces at ambient conditions, is proportional to the characteristic size of the hydrophobic object, whereas for micron-sized and larger surfaces, m [29, 30]. However, due to the presence of large kinetic barriers separating the metastable wet and the stable dry states, the system persists in the wet state, and a dewetting transition is triggered only at much smaller separations ( nm) [13, 28, 22, 30].
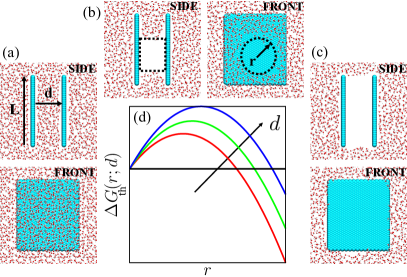
To uncover the mechanism of dewetting, a number of theoretical and simulation studies have focused on the thermodynamics as well as the kinetics of dewetting in the volume between two parallel hydrophobic surfaces that are separated by a fixed distance, [8, 10, 11, 12, 13, 14, 15, 16, 18, 19, 20, 21]. These studies have highlighted that the bottleneck to dewetting is the formation of a roughly cylindrical, critical vapor tube spanning the region between the surfaces [11, 14, 15]. A barrier in the free energetics of vapor tube formation as a function of tube radius is also supported by macroscopic interfacial thermodynamics, wherein the barrier arises primarily from a competition between the favorable solid-vapor and unfavorable liquid-vapor surface energies (Equation 1 and Figure 1). Thus, the classical mechanism for the dewetting transition prescribes that a vapor tube, which spans the volume between the two surfaces must first be nucleated, and if the vapor tube is larger than a certain critical size, it will grow until the entire confined volume is dry [9].
While it has been recognized that water density fluctuations [14, 15] must play a crucial role in nucleating vapor tubes, the precise mechanism by which these tubes are formed is not clear. To understand how vapor tubes are formed and to investigate their role in the dewetting process, here we use molecular simulations in conjunction with enhanced sampling methods [31, 32] to characterize the free energetics of water density fluctuations in the region between two nanoscopic hydrophobic surfaces. Such a characterization of water density fluctuations in bulk water and at interfaces has already provided much insight into the physics of hydrophobic hydration and interactions [33, 34, 13, 5, 35, 36, 37, 31, 38, 39, 40, 41, 32, 42, 43]. In particular, both simulations and theory have shown that the likelihood of observing low density fluctuations adjacent to extended hydrophobic surfaces is enhanced relative to Gaussian statistics [13, 36, 37, 31, 38, 42]. We show that such enhanced water density fluctuations influence the pathways to dewetting in hydrophobic confinement by stabilizing isolated cavities adjacent to one of the confining surfaces with respect to vapor tubes. As the density in the confined region is decreased, the stability of isolated cavities relative to vapor tubes also decreases, and at a particular density, isolated cavities abruptly transition to vapor tubes. Surprisingly, for , that is, separations for which dewetting is thermodynamically favorable, we find that the nascent vapor tubes formed from the isolated cavities are already larger than the corresponding critical vapor tubes predicted by classical theory. Because the newly formed vapor tube is super-critical, it grows spontaneously. Importantly, because the formation of this super-critical vapor tube involves a non-classical pathway that circumvents the critical vapor tube altogether, the process entails a smaller free energetic cost. Our results thus point to smaller kinetic barriers to dewetting than predicted by macroscopic theory.
1 Macroscopic Theory
According to classical interfacial thermodynamics, the free energy for creating a cylindrical vapor tube of radius , which spans the volume between two surfaces separated by a distance , is given by:
| (1) |
where is the difference between the system pressure and the saturation pressure, is the liquid-vapor surface tension, is the contact angle, and is the line tension. For nanoscopic surfaces, the pressure-volume contribution is negligible at ambient conditions [29, 44, 45], whereas the line tension contribution can be important [20, 46]. The term containing is negative for hydrophobic surfaces and favors dewetting, whereas the term corresponding to formation of the vapor-liquid area is unfavorable. The functional form of given in Equation 1 is illustrated in Figure 1d for three -values. In each case, a barrier separates the liquid () and vapor (large ) basins, supporting the notion of dewetting mediated by the nucleation and growth of a vapor tube; both the critical vapor tube radius and the barrier height increase with increasing .
2 Density Dependent Free Energy Profiles Feature a Kink
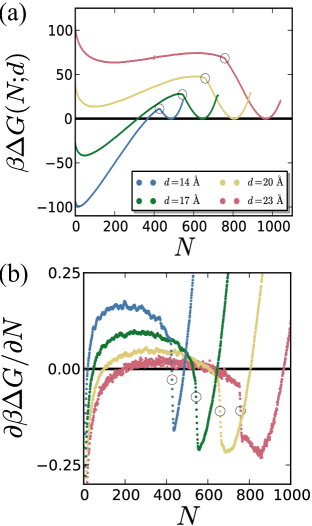
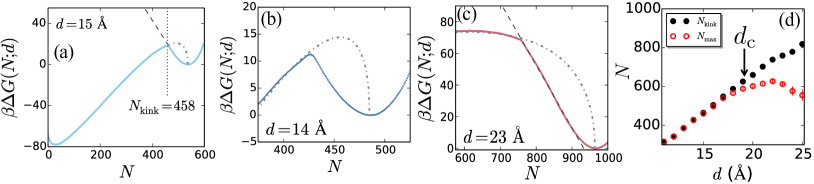
To investigate how water density fluctuations influence the mechanism of dewetting in hydrophobic confinement, here we perform molecular dynamics simulations of water confined between two, roughly square, hydrophobic surfaces of size nm, separated by a distance, , as shown in Figure 1a. Water in the confined region is in equilibrium with a reservoir of water, which in turn is in coexistence with its vapor () [47, 31]. We characterize the statistics of water density fluctuations in the confined volume using Indirect Umbrella Sampling (INDUS) [31, 32], that is, we estimate the free energy, , of observing water molecules in that volume. The free energy, , thus estimated is shown in Figure 2a for a range of separations, , with the free energy of the liquid basin, , being set to zero in each case. Over the entire range of separations considered, the free energy profile displays distinctive liquid (high ) and vapor (low ) basins with barriers separating them. Interestingly, the free energy profiles also feature a kink, that is, an abrupt change in the slope of is observed at a particular value of between the liquid and vapor basins; we refer to this value of as . This discontinuity in slope is seen more clearly in the derivatives of the free energy, shown in Figure 2b. Small errors in are amplified if simple finite differences are used to evaluate the derivatives; we therefore smooth the free energy profiles before evaluating the derivatives. Details of the smoothing procedure as well as the unsmoothed derivatives are shown in the SI.
3 Kink Separates the Vapor Tube and Isolated Cavity Ensembles
To investigate the significance of the kink in the free energy, we characterize configurations corresponding to on either side of . We do so by building upon the instantaneous interface method of Willard and Chandler [48] to identify iso-surfaces that encompass the dewetted regions, that is, the regions from which water is absent. The details of the method are included in the SI. As illustrated in Figure 3a for Å and , characteristic configurations with contain a vapor tube, that is, the dewetted region (in purple) clearly spans the confined volume between the two surfaces (side view, left). Water molecules (not shown for clarity) occupy the entire region between the surfaces not shown in purple and are also present outside the confinement region. In contrast, for configurations with , isolated cavities are observed adjacent to one surface or the other; however, as seen in Figure 3b for , the cavities do not span the region between the surfaces to form vapor tubes. Movies corresponding to the configurations shown in Figures 3a and 3b can be found in the SI.
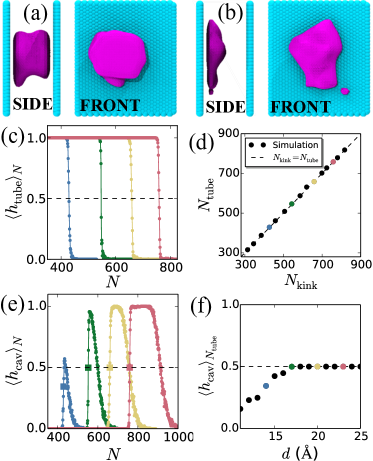
The configurations shown in Figures 3a and 3b suggest that marks the boundary between the vapor tube and isolated cavity ensembles. To put this notion on a quantitative footing, we define indicator functions, and , which are 1 if a given configuration has a vapor tube or an isolated cavity respectively, and 0 otherwise. The average value of the indicator function , subject to the constraint that the number of water molecules in confinement is , is shown in Figure 3c for the entire range of -values, and for several separations, . Because the configurations were generated in the presence of biasing potentials, care must be exercised in evaluating the averages shown in Figure 3c; details of the averaging procedure as well as the criteria employed in the definition of the indicator functions can be found in the SI. For a given separation, , which is the probability of observing a vapor tube conditional on the number of waters in confinement being , is a sigmoidal function of , decreasing sharply from 1 at low to 0 for high . We define to be the value of at which undergoes a sharp transition; in particular, where crosses 0.5. As shown in Figure 3d, for the entire range of -values studied here (), is equal to , formalizing the notion that the kink in demarcates configurations that display vapor tubes and those that do not.
Analogous to , the conditional average quantifies the fraction of configurations with confined waters, which feature isolated cavities. For all separations, displays a sharp increase, followed by a gradual decrease; see Figure 3e. The sharp increase occurs in the vicinity of as vapor tubes give way to isolated cavities, whereas the gradual decrease corresponds to a crossover from isolated cavities to uniform configurations. To specify the location of this crossover, we define to be the value of where crosses 0.5 (with a negative slope). Despite these common features in the functional form of , there are subtle differences in at small and large separations, which nevertheless have interesting consequences. For the largest separations, a well-defined plateau at separates the sharp increase in and its gradual decrease; this plateau demarcates the range of -values, which reliably feature isolated cavities. In contrast, the plateau at is absent for the smaller separations. Instead, the sharp increase in and its gradual decrease overlap in their range of -values. This overlap suggests that configurations corresponding to are not limited to those with vapor tubes or isolated cavities, but could also be uniform. Given that at by definition, a value of would correspond to a non-zero likelihood of observing uniform configurations with . As shown in Figure 3f, that is indeed the case Å, suggesting that while the nucleation of a vapor tube must proceed through the formation of isolated cavities for Å, vapor tubes may be nucleated directly from uniform configurations for smaller separations.
4 Free Energetics of Vapor Tubes and Isolated Cavities
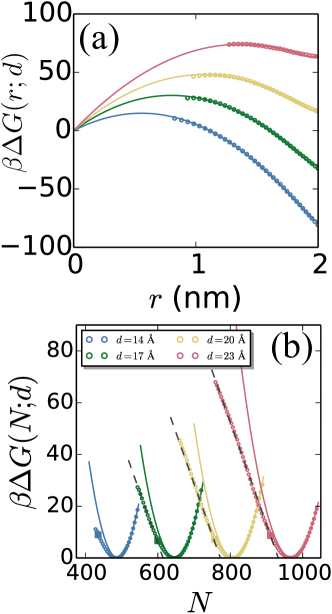
Given the abrupt change in the dewetted morphologies at , we expect the functional form of the free energetics for and to be different. Figures 3c and 3d collectively show that configurations with feature a vapor tube spanning the confined region, consistent with classical arguments. While the vapor tube undergoes extensive shape fluctuations, we find its average shape to be roughly cylindrical. Coarse-grained density maps of select configurations reflecting the average vapor tube shape are included in the SI. To compare the free energetics of the vapor tubes obtained from our simulations to macroscopic theory, we first transform the number of waters in the confined region, , to an approximate vapor tube radius, , using the simple relation, . The values of vapor tube radii thus obtained are consistent with the average radii of the vapor tubes observed in our simulations for , as shown in the SI. Having a one-to-one relation between and allows us to transform the simulated free energies, , into -dependent free energies, in the region ; the corresponding free energies are shown as symbols in Figure 4a. The lines are fits to the -data using the macroscopic expectation, , where the logarithmic term corresponds to the translational entropy of the vapor tube. is fit separately for each -value and yields values of and that are reasonable. Values of are in the range of , comparable to the reported value of for the water model that we employ [49]. Our fits yield in the range, in accord with a recently reported experimental value of pN [46], which yields . These agreements are remarkable considering the simplicity of the model that we employ as well as the assumptions that we make (cylindrical vapor tube shape, constant surface tension independent of vapor tube curvature, etc.), suggesting that the energetics of the vapor tube are well-described by classical macroscopic theory. Further details of our fitting procedure, the values of the fit parameters for each , as well as our attempts to fit the simulation data to other reasonable expressions of can be found in the SI.
To investigate the free energetics of the isolated cavity ensemble, in Figure 4b, we focus on . In the liquid basin, that is, in the vicinity of , the free energy (symbols) is parabolic (solid lines), indicating that the underlying density fluctuations are Gaussian. While remains harmonic for , it crosses over to being roughly linear (dashed lines) for . Such a crossover from parabolic to linear has also been observed adjacent to single extended hydrophobic surfaces [31, 41, 42], and corresponds to the interfacial water undergoing a collective dewetting transition to expel water from a nanometer-sized cavity [13, 38, 42]. Indeed, as shown in Figure 4b, the location of the crossover agrees well with the corresponding -values (squares) discussed in the previous section. Interestingly, the slopes of the linear fat tails are similar for all -values (in the range of ); the dashed lines shown in Figure 4b are linear fits with a slope of per water. Additional details of the fitting procedure and the values of the parameters obtained are provided in the SI. The difference between the values of and the -intercepts of the linear fits is also approximately the same for all -values, and is equal to waters. Thus, the free energy for forming an isolated cavity of a given size (as quantified by the number of waters displaced from the confined region, ), is independent of the separation between the surfaces, that is, the free energetics of isolated cavity formation adjacent to one hydrophobic surface are largely unaffected by the presence of the other confining surface. In contrast, the free energetics of vapor tube formation clearly depend on the inter-surface separation, . As a result, the location of the kink, where isolated cavities become metastable with respect to vapor tubes, also depends on .
5 Non-Classical Dewetting Mechanism Reduces Barriers
Figure 5a summarizes our findings for the dewetting mechanism presented thus far; in addition to the simulated for , it highlights the metastable branches of the vapor tube and isolated cavity ensemble free energies, anticipated from the fits shown in Figure 4. It is clear that the system minimizes its free energy at all times by staying on the branch with the lower free energy; at , where the two free energy profiles intersect, the system jumps from the isolated cavity to the vapor tube ensemble. Importantly, the non-classical path leading up to the formation of nascent vapor tubes () can result in smaller barriers to dewetting than anticipated by classical theory, as shown in Figure 5b. For , the classical barrier (critical vapor tube) appears in the metastable segment of the free energy profile. The system thus circumvents the classical barrier, and instead adopts the path involving isolated cavities, which give way to vapor tubes only at ; these nascent vapor tubes are larger than the critical vapor tube, so their subsequent growth is downhill in energy. Thus, the barrier to dewetting is the free energetic cost for forming these nascent, super-critical vapor tubes, which is clearly smaller than the classical barrier. In Figure 5c, we illustrate that the nascent vapor tubes are not super-critical for all separations; for , the classical barrier appears in the stable segment of the free energy profile. Thus, while the kink in again marks the formation of a vapor tube for , the vapor tube formed is smaller than the critical vapor tube, and must grow further in a process that is uphill in energy, before dewetting can proceed. As a result, the barrier to dewetting coincides with that predicted by macroscopic theory.
To uncover the separation at which the system transitions from a supercritical to a subcritical nascent vapor tube, in Figure 5d, we plot and as a function of . Here, corresponds to the value of between the liquid and vapor basins where the is the highest. For small values of , , indicating that the is the highest at the kink, consistent with the formation of supercritical nascent vapor tubes. For larger values of , there is an additional maximum in at , suggesting that the newly formed vapor tubes are smaller than the corresponding critical vapor tubes. Interestingly, the separation at which the system transitions from non-classical to classical dewetting barriers is close to the separation at which there is coexistence between the liquid and vapor, . Thus, for the separations with a thermodynamically favorable driving force for dewetting, the mechanism for dewetting is manifestly non-classical, corresponding to the formation of super-critical vapor tubes from isolated cavities, and requiring a smaller free energetic barrier than anticipated by macroscopic theory.
6 Discussion and Outlook
Our results highlight that water density fluctuations play a central role in the pathways to dewetting in hydrophobic confinement. Enhanced water density fluctuations in the vicinity of hydrophobic surfaces stabilize isolated cavities relative to vapor tubes for ; the system resides in the classical vapor tube ensemble only for . While the free energetics of both the isolated cavity and vapor tube ensembles are well-described by the number of waters in confinement, , this simple order parameter may not be sufficient to describe the transition from one ensemble to the other. Indeed, represents a projection of a complex free energy landscape onto the single parameter, , and a kink in strongly suggests that the transition from an isolated cavity to a vapor tube involves order parameter(s) that are orthogonal to . While beyond the scope of the present work, it will be interesting to uncover these additional order parameters that define the transition state ensemble. It is conceivable that additional barriers may present themselves in the parameters that are orthogonal to .
Dewetting in nanoscopic hydrophobic confinement plays an important role in biology; ranging from the assembly of multimeric proteins and the collapse of the hydrophobic protein core, to the vapor-lock gating of ion channels and the specific binding of ligands to hydrophobic grooves on their binding partners. In particular, recent work has highlighted the importance of including the solvent coordinate, , in describing the kinetics of hydrophobically-driven collapse and assembly [50, 51, 52, 53]. Our results show that water density fluctuations stabilize non-classical pathways, which reduce the barriers along the -coordinate, and should therefore enhance the kinetics of dewetting-mediated biophysical phenomena.
Dewetting in hydrophobic confinement is also important in a host of non-biological phenomena, ranging from heterogeneous nucleation of vapor bubbles and contact line pinning, to the Cassie-Wenzel transitions on textured surfaces [54]. These phenomena involve intricate confinement geometries, which could result in complex pathways involving one or more transitions between various dewetted morphologies, such as the isolated cavities and vapor tubes that we observe here. Fluctuation-mediated pathways ought to similarly reduce dewetting barriers associated with these diverse phenomena.
7 Materials and Methods
We simulate SPC-E water in confinement between two square hydrophobic surfaces of size nm, for a range of separations, (See Figure 1a), ranging from to , chosen to span the entire range of -values with both liquid and vapor basins. The surfaces are composed of 1008 atoms each, and are arranged on a hexagonal lattice with a spacing of . The surface atoms interact with the water oxygens through the Lennard-Jones potential with the parameters, and kJ/mol; see refs. [21, 20] for further details. These interactions result in a water droplet contact angle on the hydrophobic surface, as shown in the SI. We have chosen the SPC-E model of water [55] since it adequately captures the experimentally known features of water such as surface tension, compressibility, and vapor-liquid equation of state near ambient conditions, which are important in the study of hydrophobic effects [56, 5]. Our simulations contain roughly 10,000 to 15,000 water molecules and were performed in the NVT ensemble, thermostatted at K using the canonical velocity rescaling thermostat [57]. We employ a periodic simulation box with the hydrophobic surfaces of interest fixed at the center of the box, and a buffering liquid-vapor interface nucleated at the top of the box with the help of a wall of purely repulsive particles. The buffering interface ensures that the system is at the saturation pressure of SPC-E water at 300K [47, 31]; free energies obtained with such a construct have been shown to be nearly indistinguishable from those obtained in the NPT ensemble at a pressure of bar [32]. Short-ranged interactions were truncated at 1 nm, whereas long-ranged electrostatic interactions were computed using the particle mesh Ewald method [58]. The bonds in water were constrained using SHAKE [59]. To study the free energetics of dewetting, we select the cuboid shaped () observation volume between the hydrophobic surfaces, and estimate the free energies, , using the indirect umbrella sampling (INDUS) method [31, 32]. Each biased simulation was run for 6 ns and the first 1 ns was discarded for equilibration.
Acknowledgements.
RCR and AJP were supported in part by financial support from the National Science Foundation (NSF) through a Seed Grant from the University of Pennsylvania Materials Research Science and Engineering Center (NSF UPENN MRSEC DMR 11-20901). SG was supported by the NSF (CBET-1159990). PGD gratefully acknowledges support from the NSF (CBET-1263565 and CHE-1213343).References
- [1] Tanford C (1973) The Hydrophobic Effect - Formation of Micelles and Biological Membranes (Wiley Interscience, New York).
- [2] Kauzmann W (1959) Some factors in the interpretation of protein denaturation. Adv. Prot. Chem. 14:1–63.
- [3] Stillinger FH (1973) Structure in aqueous solutions of nonpolar solutes from the standpoint of scaled-particle theory. J. Solution Chem. 2:141–158.
- [4] Israelachvili JN (2011) Intermolecular and surface forces: revised third edition (Academic press).
- [5] Chandler D (2005) Interfaces and the driving force of hydrophobic assembly. Nature 437:640–647.
- [6] Israelachvili J, Pashley R (1982) The hydrophobic interaction is long range, decaying exponentially with distance. Nature 300:341 – 342.
- [7] Christenson HK, Claesson PM (1988) Cavitation and the interaction between macroscopic hydrophobic surfaces. Science 239:390–392.
- [8] Bérard DR, Attard P, Patey GN (1993) Cavitation of a Lennard-Jones fluid between hard walls, and the possible relevance to the attraction measured between hydrophobic surfaces. J. Chem. Phys. 98:7236–7244.
- [9] Parker JL, Claesson PM, Attard P (1994) Bubbles, cavities, and the long-ranged attraction between hydrophobic surfaces. J. Phys. Chem. 98:8468–8480.
- [10] Wallqvist A, Berne BJ (1995) Computer simulation of hydrophobic hydration forces on stacked plates at short range. J. Phys. Chem. 99:2893–2899.
- [11] Lum K, Luzar A (1997) Pathway to surface-induced phase transition of a confined fluid. Phys Rev E 56:R6283.
- [12] Lum K, Chandler D (1998) Phase diagram and free energies of vapor films and tubes for a confined fluid. Intl J Thermophys 19:845–855.
- [13] Lum K, Chandler D, Weeks JD (1999) Hydrophobicity at small and large length scales. J. Phys. Chem. B 103:4570–4577.
- [14] Bolhuis PG, Chandler D (2000) Transition path sampling of cavitation between molecular scale solvophobic surfaces. J. Chem. Phys. 113:8154–8160.
- [15] Leung K, Luzar A, Bratko D (2003) Dynamics of capillary drying in water. Phys. Rev. Lett. 90:065502.
- [16] Huang X, Margulis CJ, Berne BJ (2003) Dewetting-induced collapse of hydrophobic particles. Proc Natl Acad Sci USA 100:11953–11958.
- [17] Urbic T, Vlachy V, Dill KA (2006) Confined water: a mercedes-benz model study. J Phys Chem B 110:4963–4970.
- [18] Choudhury N, Pettitt BM (2007) The dewetting transition and the hydrophobic effect. J. Am. Chem. Soc. 129:4847–4852.
- [19] Xu L, Molinero V (2010) Liquid- vapor oscillations of water nanoconfined between hydrophobic disks: Thermodynamics and kinetics. J Phys Chem B 114:7320–7328.
- [20] Sharma S, Debenedetti PG (2012) Evaporation rate of water in hydrophobic confinement. Proc Natl Acad Sci USA 109:4365–4370.
- [21] Sharma S, Debenedetti PG (2012) Free energy barriers to evaporation of water in hydrophobic confinement. J Phys Chem B 116:13282–13289.
- [22] Mastropietro DJ, Ducker WA (2012) Forces between hydrophobic solids in concentrated aqueous salt solution. Phys. Rev. Lett. 108:106101.
- [23] Yu N, Hagan MF (2012) Simulations of HIV capsid protein dimerization reveal the effect of chemistry and topography on the mechanism of hydrophobic protein association. Biophys J 103:1363–1369.
- [24] Discher BM, et al. (1999) Polymersomes: tough vesicles made from diblock copolymers. Science 284:1143–1146.
- [25] Percec V, et al. (2010) Self-assembly of janus dendrimers into uniform dendrimersomes and other complex architectures. Science 328:1009–1014.
- [26] Chen Q, Yan J, Zhang J, Bae SC, Granick S (2012) Janus and multiblock colloidal particles. Langmuir 28:13555–13561.
- [27] Vargo KB, Parthasarathy R, Hammer DA (2012) Self-assembly of tunable protein suprastructures from recombinant oleosin. Proc Natl Acad Sci USA 109:11657–11662.
- [28] Berne BJ, Weeks JD, Zhou R (2009) Dewetting and hydrophobic interaction in physical and biological systems. Annu Rev Phys Chem 60:85–103.
- [29] Cerdeirina CA, Debenedetti PG, Rossky PJ, Giovambattista N (2011) Evaporation length scales of confined water and some common organic liquids. J. Phys. Chem. Lett. 2:1000–1003.
- [30] Giovambattista N, Rossky P, Debenedetti P (2012) Computational studies of pressure, temperature, and surface effects on the structure and thermodynamics of confined water. Annu Rev Phys Chem 63:179–200.
- [31] Patel AJ, Varilly P, Chandler D (2010) Fluctuations of water near extended hydrophobic and hydrophilic surfaces. J. Phys. Chem. B 114:1632 – 1637.
- [32] Patel AJ, Varilly P, Chandler D, Garde S (2011) Quantifying density fluctuations in volumes of all shapes and sizes using indirect umbrella sampling. J. Stat. Phys. 145:265 – 275.
- [33] Hummer G, Garde S, Garcia AE, Pohorille A, Pratt LR (1996) An information theory model of hydrophobic interactions. Proc Natl Acad Sci USA 93:8951–8955.
- [34] Garde S, Hummer G, Garcia AE, Paulaitis ME, Pratt LR (1996) Origin of entropy convergence in hydrophobic hydration and protein folding. Phys. Rev. Lett. 77:4966–4968.
- [35] Rajamani S, Truskett TM, Garde S (2005) Hydrophobic hydration from small to large lengthscales: Understanding and manipulating the crossover. Proc Natl Acad Sci USA 102:9475–9480.
- [36] Mittal J, Hummer G (2008) Static and dynamic correlations in water at hydrophobic interfaces. Proc Natl Acad Sci USA 105:20130–20135.
- [37] Godawat R, Jamadagni SN, Garde S (2009) Characterizing hydrophobicity of interfaces by using cavity formation, solute binding, and water correlations. Proc Natl Acad Sci USA 106:15119 – 15124.
- [38] Varilly P, Patel AJ, Chandler D (2011) An improved coarse-grained model of solvation and the hydrophobic effect. J. Chem. Phys. 134:074109.
- [39] Jamadagni SN, Godawat R, Garde S (2011) Hydrophobicity of proteins and interfaces: Insights from density fluctuations. Annu Rev Chem Biomol Engg 2:147–171.
- [40] Patel AJ, et al. (2011) Extended surfaces modulate hydrophobic interactions of neighboring solutes. Proc. Natl. Acad. Sci. U.S.A. 108:17678 – 17683.
- [41] Rotenberg B, Patel AJ, Chandler D (2011) Molecular explanation for why talc surfaces can be both hydrophilic and hydrophobic. J. Am. Chem. Soc. 133:20521 – 20527.
- [42] Patel AJ, et al. (2012) Sitting at the edge: How biomolecules use hydrophobicity to tune their interactions and function. J. Phys. Chem. B 116:2498 – 2503.
- [43] Remsing RC, Weeks JD (2013) Dissecting hydrophobic hydration and association. J Phys Chem B 117:15479–15491.
- [44] Ashbaugh HS (2013) Solvent cavitation under solvophobic confinement. J Chem Phys 139:064702.
- [45] Altabet YE, Debenedetti PG (2014) The role of material flexibility on the drying transition of water between hydrophobic objects: A thermodynamic analysis. J. Chem. Phys. 141:18C531.
- [46] Guillemot L, Biben T, Galarneau A, Vigier G, Charlaix É (2012) Activated drying in hydrophobic nanopores and the line tension of water. Proc Natl Acad Sci USA 109:19557–19562.
- [47] Miller T, Vanden-Eijnden E, Chandler D (2007) Solvent coarse-graining and the string method applied to the hydrophobic collapse of a hydrated chain. Proc. Natl. Acad. Sci. U.S.A. 104:14559–14564.
- [48] Willard AP, Chandler D (2010) Instantaneous liquid interfaces. J. Phys. Chem. B 114:1954–1958.
- [49] Vega C, De Miguel E (2007) Surface tension of the most popular models of water by using the test-area simulation method. J Chem Phys 126:154707.
- [50] Mittal J, Hummer G (2012) Pair diffusion, hydrodynamic interactions, and available volume in dense fluids. J Chem Phys 137:034110.
- [51] Li J, Morrone JA, Berne B (2012) Are hydrodynamic interactions important in the kinetics of hydrophobic collapse? J Phys Chem B 116:11537–11544.
- [52] Mondal J, Morrone JA, Berne B (2013) How hydrophobic drying forces impact the kinetics of molecular recognition. Proc Natl Acad Sci USA 110:13277–13282.
- [53] Setny P, Baron R, Michael Kekenes-Huskey P, McCammon JA, Dzubiella J (2013) Solvent fluctuations in hydrophobic cavity–ligand binding kinetics. Proc Natl Acad Sci USA 110:1197–1202.
- [54] Kumar V, Sridhar S, Errington JR (2011) Monte carlo simulation strategies for computing the wetting properties of fluids at geometrically rough surfaces. J Chem Phys 135:184702.
- [55] Berendsen HJC, Grigera JR, Straatsma TP (1987) The missing term in effective pair potentials. J. Phys. Chem. 91:6269–6271.
- [56] Varilly P, Chandler D (2013) Water evaporation: A transition path sampling study. J Phys Chem B 117:1419–1428.
- [57] Bussi G, Donadio D, Parrinello M (2007) Canonical sampling through velocity rescaling. J. Chem. Phys. 126:014101.
- [58] Essmann U, et al. (1995) A smooth particle mesh ewald method. J. Chem. Phys. 103:8577–8593.
- [59] Ryckaert JP, Ciccotti G, Berendsen HJC (1977) Numerical integration of the cartesian equations of motion of a system with constraints: molecular dynamics of n-alkanes. J. Comp. Phys. 23:327 – 341.