UV spectra of iron-doped carbon clusters FeCn = 3–6
published in International Journal of Mass Spectrometry 365–366 (2014) 351–355
Abstract
Electronic transitions of jet-cooled FeCn clusters () were measured between 230 and 300 nm by a mass-resolved 1+1 resonant two-photon ionization technique. Rotational profiles were simulated based on previous calculations of ground state geometries and compared to experimental observations. Reasonable agreement is found for the planar fan-like structure of FeC3. The FeC4 data indicate a shorter distance between the Fe atom and the bent C4 unit of the fan. The transitions are suggested to be 3AB1 for FeC3 and 5AA1 for FeC4. In contrast to the predicted C geometry, non-linear FeC5 is apparently observed. Line width broadening prevents analysis of the FeC6 spectrum.
1 Introduction
The structures and electronic properties of carbonaceous molecules and nanoparticles doped with transition metals have received increasing interest in the past years due to potential applications in nanotechnology. Early 3 and 4 transition metals (M Ti, Zr, V, Nb, Cr, Mo) form metallo-carbohedrenes (met-cars), very stable clusters with the molecular formula M8C12 [1, 2, 3, 4, 5]. Late transition metals (Fe, Co, Ni) act as catalysts in carbon nanotube growth [6], but only iron does also form met-cars, whereby several stable structures have been detected by mass spectrometry, in particular Fe7C8, Fe8C12, Fe12C12 [4].
Iron-carbon compounds might also play an important role in astrochemistry as Fe and C belong to the most abundant refractory elements in the Galaxy. In addition, iron is heavily depleted in the interstellar medium (ISM) [7, 8, 9]. It must be trapped in dust grains or in molecules. So far, FeCN and possibly FeO are the only iron-containing molecules that have been detected in the ISM [10, 11]. In this context, more laboratory spectra, especially for larger species and at optical wavelengths, are needed.
Large iron-carbon clusters ( amu) were investigated by mass spectrometry [4, 12] and density functional theory (DFT) [13, 14, 15, 16]. Smaller molecules ( amu) were studied experimentally by mass spectrometry [17, 18], infrared matrix isolation spectroscopy [19, 20, 21, 22], anion photoelectron spectroscopy [23, 24, 25, 26, 27, 28], and gas phase ion chromatography [29]. High-resolution spectra at optical and mm wavelengths were measured only for FeC [30, 31, 32, 33, 34, 35]. Several small FenCm (, ) species have been the subject of theoretical calculations [36, 37, 38, 39, 40, 41, 42, 43, 44, 45, 46, 47, 48, 49, 50, 51]. The structures and electronic properties of the small clusters are important to understand the growth mechanism of larger compounds, such as met-cars and nanotubes. However, the prediction of the correct ground state geometries is difficult due to the large number of local minima on the potential energy surfaces.
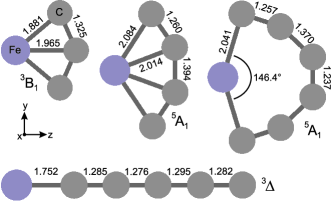
In this article, gas phase spectra of jet-cooled FeCn clusters () between 230 and 300 nm are presented. Conclusions concerning the molecular structures are drawn. The most recent calculations of the ground state geometries of these molecules applied the DFT functional B3LYP in conjunction with the 6-311+G() basis set [49, 51]. It was found that the minimum energy structure is planar fan-like (C) for FeC3 and FeC4, linear (C) for FeC5, and cyclic (C) for FeC6 (Fig. 1). In all these cases, the Cn unit is not disrupted as C–C bonds are much stronger than Fe–C ones. The only experimental data available so far are photoelectron spectra of the FeC3 and FeC4 anions, whereby contradictory information regarding the geometries of the neutrals (C vs. C) was obtained [25, 27].
2 Experimental
The setup used a molecular beam source combined with a linear time-of-flight (TOF) mass spectrometer (MS). The source consists of a pulsed valve coupled with laser vaporization. Ablation of a rotating and translating iron rod was achieved by focusing 532 nm radiation (20 mJ, 5 ns) to 300 m. The iron vapor was co-expanded in a He/2 % C2H2 gas mixture (8 bar backing pressure) and the supersonic jet was skimmed 40 mm downstream to produce a collimated beam. A +300 V potential was applied to the skimmer to remove ions before neutrals entered the ionization region of the TOF-MS. Rotational temperatures of the FeCn species in the molecular beam were below 50 K (Sect. 3); translational temperatures are expected to be K. Vibrational cooling, however, is not very efficient in supersonic jet expansions. The corresponding temperatures can exceed 500 K.

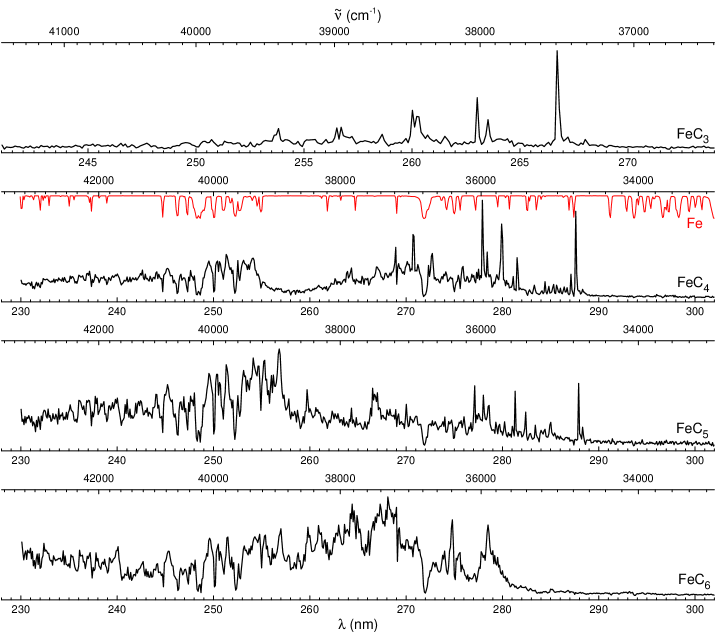
Spectral scans applying a 1+1 resonant two-photon ionization (R2PI) scheme were realized by counter-propagating the laser radiation into the molecular beam. Two different laser sources were used. Broad range scans between 230 and 400 nm were conducted with an optical parametric laser ( ns, 20 Hz, 0.1 nm bandwidth). The frequency-doubled output of a higher-resolution dye laser ( ns, 10 Hz, 0.001 nm bandwidth) was used for rotational profile scans. The wavelengths were calibrated with observed lines of atomic iron (0.01 nm uncertainty). Rotational profiles were fitted with the PGopher software [52]. The calculated ionization energies of FeCn () are eV [51]. 1+1 R2PI scans are therefore possible for wavelengths below nm. The low-resolution spectra were power-corrected. Negative absorption lines can be noticed at 272 and between 244 and 256 nm. They are caused by atomic iron, by far the most abundant species in the molecular beam, absorbing most of the laser power.
3 Results and Discussion
An integrated TOF mass spectrum as observed during the higher-resolution scan between 267.62 and 267.27 nm is displayed in Fig. 2. It can be seen that the cluster source produces Fe, benzene, FeCn (), and FeCnH2 (). The relative mass peak intensities are not only determined by the species’ abundance, but also by the integrated R2PI signal, hence the anomalously high intensity of the FeC6 peak.
Figures 3 and 4 present the measured electronic spectra of the FeCn species. The wavelengths of the stronger bands (their maxima) as indicated by arrows in Fig. 4 are given in Table 1.

| FeCn | (nm) | (cm-1) |
|---|---|---|
| 266.75 | 37477 | |
| 287.61 | 34760 | |
| 287.87 | 34728 | |
| 278.43 | 35906 |
3.1 FeC3
The strongest band is located at 266.75 nm and appears to be the origin band of the transition due to the Franck-Condon intensity distribution. Several bands at higher energy correspond to the excitation of a vibrational mode ( cm-1) in the upper electronic state.
Density functional theory (DFT) and time-dependent DFT (TDDFT), implemented in the Gaussian09 software package [53], were applied to predict the vibrations in the ground state and the excited electronic state energies of the previously optimized C structure at the B3LYP/6-311+G() level of theory. A vibrational mode in the ground state of a1 symmetry was calculated at 444 cm-1 (unscaled value), which agrees reasonably well with the observed vibrational progression in the excited state. The TDDFT computations predict two electronic transitions with notable oscillator strength in the observed wavelength region. A ) transition () was calculated at 263.3 nm and a ) transition () at 260.6 nm. Further transitions are to be expected at longer wavelengths. However, the applied one-colour technique allows the detection of electronic transitions only down to 273.7 nm because the calculated vertical ionization energy is 9.06 eV. One finds similar results with calculations using the larger basis set aug-cc-pvqz: ) at 266.5 nm with and ) at 261.5 nm with .
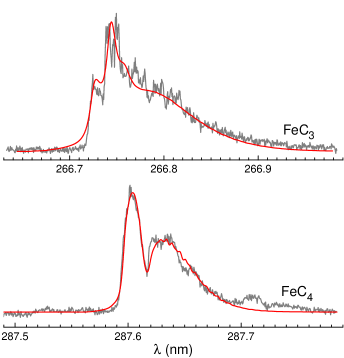
The theoretical ground state geometry corresponds to rotational constants cm-1, cm-1, and cm-1. The rotational profile of the absorption band at 266.75 nm can be simulated by a C asymmetric top molecule. The best fit to the observed profile is achieved for a transition (Fig. 5). The noise in the high-intensity part of the experimental profile is caused by instabilities of the laser vaporization source. A rotational temperature of 45(15) K is indicated from the fit and the ground state rotational constants are 0.479(0.010) cm-1, 0.286(0.010) cm-1, and 0.179(0.010) cm-1, in good agreement with theory. The rotational constants in the excited state are lower by less than 10 %. In view of these results, the observed band system is suggested to be the 3AB1 transition of FeC3 with planar fan-like structure shown in Fig. 1.
3.2 FeC4
The first strong band in the FeC4 electronic spectrum appears at 287.61 nm. TDDFT calculations at the B3LYP/6-311+G() level of theory predict a 5AA1 transition at 287.0 nm (). Additional transitions with reasonable oscillator strengths are calculated at 262.9 nm (5AA1; ), 261.5 nm (5BA1; ), 256.0 nm (5AA1; ), and 229.7 nm (5BA1; ), as well as at wavelengths longer than 300 nm inaccessible with the applied 1+1 R2PI used in this work.
The rotational constants of the calculated ground state structure are cm-1, cm-1, and cm-1. Profile fits, assuming an asymmetric top, can be obtained for any of the three possible transition types, , , and . The best fit is achieved for an transition (Fig. 5). The inferred parameters for the different transition types are listed in Table 2. In all the three cases, the constant in the ground state is bigger than the theoretical value. This suggests a shorter distance between the Fe atom and the center of the bent C4 unit than predicted by B3LYP/6-311+G().
| transition | (cm-1) | (cm-1) | (cm-1) | (K) |
|---|---|---|---|---|
| 0.2500.298 | 0.1670.176 | 0.1600.170 | 18 | |
| 0.2080.246 | 0.1770.187 | 0.2010.216 | 23 | |
| 0.2040.243 | 0.2230.241 | 0.2120.229 | 24 |
The observed band at 287.61 nm is thus tentatively assigned as the origin band of a 5AA1 transition. The other bands at shorter wavelengths can be vibrational excitation in the upper state or belong to another electronic transition.
3.3 FeC5
In contrast to FeC3 and FeC4, a linear ground state geometry was calculated for FeC5 [49, 51], which yields a rotational constant of 0.023 cm-1. Using this constant for the ground state and a variable one for the excited state, it was not possible to simulate the entire rotational profile of the band at 287.87 nm. A fit could perhaps be obtained by using the right combination of constants for spin-orbit coupling, spin-spin coupling, and doubling. However, in comparison with the observed absorption profile of FeC4 at 287.61 nm, it seems more likely that a non-linear molecule is observed. It should be noted that three non-linear geometries with C or close to C symmetry and with different electronic ground states (5B1, 3A’, and 5A1) are predicted by theory to be within 40 kJ/mol of the linear structure [49, 51].
3.4 FeC6
The first strong feature in the measured spectrum of FeC6 appears at 278.43 nm. It is very broad ( cm-1) and has an almost perfect Lorentzian shape. Assuming lifetime broadening to be responsible for the observed width, a lower limit of about 0.1 ps for the lifetime of the excited electronic state is deduced.
4 Conclusions
Iron-containing carbonaceous molecules with FeCn () stoichiometry, which have been predicted only by theory so far, were produced under laboratory conditions. Their electronic spectra were measured between 230 and 300 nm by a mass-resolved 1+1 resonant two-photon ionization technique. Higher-resolution scans of the first strong bands were compared with simulated rotational profiles using ground state structures previously calculated at the B3LYP/6-311+G() level [49, 51]. Observed and predicted profiles agree reasonably well for a fan structure of FeC3. The transition with origin band at 266.75 nm is assigned as 3AB1. The distance between the bent carbon chain and the Fe atom in the FeC4 fan seems to be shorter than calculated. A band measured at 287.61 nm is probably the origin band of a 5AA1 transition. The measured profile of FeC5 indicates that a non-linear molecule was observed, in contrast to the predicted linear geometry. No conclusions can be drawn from the FeC6 electronic spectrum due to line-width broadening.
The measurements presented here do not prove conclusively certain molecular structures. The possible presence of other isomers has not been evaluated yet due to the complexity of the UV spectra. Additional spectroscopic studies are needed to further explore the structural properties and the low-lying electronic states.
Acknowledgements
This work has been funded by the Swiss National Science Foundation (Project 200020-140316/1).
References
- [1] A. W. Castleman, B. C. Guo, S. Wei, Z. Y. Chen, Plasma Phys. Control. Fusion 34 (1992) 2047.
- [2] S. Wei, B. C. Guo, J. Purnell, S. Buzza, A. W. Castleman, J. Phys. Chem. 96 (1992) 4166.
- [3] S. Wei, B. C. Guo, J. Purnell, S. Buzza, A. W. Castleman, Science 256 (1992) 818.
- [4] J. S. Pilgrim, M. A. Duncan, J. Am. Chem. Soc. 115 (1993) 6958.
- [5] H. T. Deng, B. C. Guo, K. P. Kerns, A. W. Castleman, J. Phys. Chem. 98 (1994) 13373.
- [6] M. Kumar, Y. Ando, J. Nanosci. Nanotechnol. 10 (2010) 3739.
- [7] H. Olthof, S. R. Pottasch, Astron. & Astrophys. 43 (1975) 291.
- [8] K. S. de Boer, H. J. G. L. M. Lamers, Astron. & Astrophys. 69 (1978) 327.
- [9] B. D. Savage, R. C. Bohlin, Astrophys. J. 229 (1979) 136.
- [10] L. N. Zack, D. T. Halfen, L. M. Ziurys, Astrophys. J. Lett. 733 (2011) L36.
- [11] C. M. Walmsley, R. Bachiller, G. P. des Forêts, P. Schilke, Astrophys. J. Lett. 566 (2002) L109.
- [12] F. Huisken, B. Kohn, R. Alexandrescu, I. Morjan, J. Chem. Phys. 113 (2000) 6579.
- [13] L. C. Cune, M. Apostol, Chem. Phys. Lett. 344 (2001) 287.
- [14] H. H. Harris, I. G. Dance, Polyhedron 26 (2007) 250.
- [15] G. L. Gutsev, C. A. Weatherford, P. Jena, E. Johnson, B. R. Ramachandran, J. Phys. Chem. C 116 (2012) 7050.
- [16] M. V. Ryzhkov, B. Delley, Theor. Chem. Account. 131 (2012) 1144.
- [17] C. B. Lebrilla, T. Drewello, H. Schwarz, Organometallics 6 (1987) 2268.
- [18] T. Drewello, H. Schwarz, Chem. Phys. Lett. 171 (1990) 5.
- [19] Z. H. Kafafi, R. H. Hauge, J. L. Margrave, J. Am. Chem. Soc. 107 (1985) 7550.
- [20] E. S. Kline, Z. H. Kafafi, R. H. Hauge, J. L. Margrave, J. Am. Chem. Soc. 107 (1985) 7559.
- [21] D. W. Ball, R. G. S. Pong, Z. H. Kafafi, J. Am. Chem. Soc. 115 (1993) 2864.
- [22] C. J. Chu, Z. H. Kafafi, J. L. Margrave, R. H. Hauge, W. E. Billups, Organometallics 19 (2000) 39.
- [23] J. Fan, L.-S. Wang, J. Phys. Chem. 98 (1994) 11814.
- [24] G. Drechsler, C. Bäßmann, U. Boesl, E. W. Schlag, J. Mol. Struct. 348 (1995) 337.
- [25] J. W. Fan, L. Lou, L. S. Wang, J. Chem. Phys. 102 (1995) 2701.
- [26] X. Li, L. S. Wang, J. Chem. Phys. 111 (1999) 8389.
- [27] L. S. Wang, X. Li, J. Chem. Phys. 112 (2000) 3602.
- [28] G. Drechsler, U. Boesl, Int. J. Mass Spectrom. 228 (2003) 1067.
- [29] G. von Helden, N. G. Gotts, P. Maitre, M. T. Bowers, Chem. Phys. Lett. 227 (1994) 601.
- [30] W. J. Balfour, J. Cao, C. V. V. Prasad, C. X. W. Qian, J. Chem. Phys. 103 (1995) 4046.
- [31] M. D. Allen, T. C. Pesch, L. M. Ziurys, Astroph. J. Lett. 472 (1996) L57.
- [32] D. J. Brugh, M. D. Morse, J. Chem. Phys. 107 (1997) 9772.
- [33] M. Fujitake, A. Toba, M. Mori, F. Miyazawa, N. Ohashi, K. Aiuchi, K. Shibuyay, J. Mol. Spec. 208 (2001) 253.
- [34] K. Aiuchi, K. Shibuya, J. Mol. Spec. 209 (2001) 92.
- [35] T. C. Steimle, W. L. Virgo, D. A. Hostutler, J. Chem. Phys. 117 (2002) 1511.
- [36] Z. Cao, J. Mol. Struct. 365 (1996) 211.
- [37] B. K. Nash, B. K. Rao, P. Jena, J. Chem. Phys. 105 (1996) 11020.
- [38] A. V. Arbuznikov, M. Hendrickx, L. G. Vanquickenborne, Chem. Phys. Lett. 310 (1999) 515.
- [39] D. Tzeli, A. Mavridis, J. Chem. Phys. 116 (2002) 4901.
- [40] G. L. Gutsev, C. W. Bauschlicher, Chem. Phys. 291 (2003) 27.
- [41] E. G. Noya, R. C. Longo, L. J. Gallego, J. Chem. Phys. 119 (2003) 11130.
- [42] M. F. A. Hendrickx, S. Clima, Chem. Phys. Lett. 388 (2004) 290.
- [43] M. V. Ryzhkov, A. L. Ivanovskii, B. T. Delley, Chem. Phys. Lett. 404 (2005) 400.
- [44] V. M. Rayón, P. Redondo, C. Barrientos, A. Largo, Chem. Eur. J. 12 (2006) 6963.
- [45] Y.-B. Yuan, K.-M. Deng, Y.-Z. Liu, C.-M. Tang, Chin. Phys. Lett. 23 (2006) 1761.
- [46] Q.-M. Ma, Z. Xie, J. Wang, Y. Liu, Y.-C. Li, Phys. Rev. B 76 (2007) 035412.
- [47] M. V. Ryzhkov, A. L. Ivanovskii, B. Delley, Theor. Chem. Account. 119 (2008) 313.
- [48] M.-Y. Sun, C.-L. Yang, M.-S. Wang, Y.-B. Gong, Y.-T. Zhu, W. Liu, J. Phys. Chem. A 112 (2008) 4556.
- [49] L. Largo, C. Barrientos, P. Redondo, J. Chem. Phys. 130 (2003) 134304.
- [50] P. Redondo, L. Largo, C. Barrientos, Chem. Phys. 364 (2009) 1.
- [51] W. Zhu, G. Li, Int. J. Mass Spectrom. 281 (2009) 63.
- [52] C. M. Western, Pgopher, version 7.1.108, Tech. rep., University of Bristol, http://pgopher.chm.bris.ac.uk (2010).
- [53] M. J. Frisch, G. W. Trucks, H. B. Schlegel, G. E. Scuseria, M. A. Robb, J. R. Cheeseman, G. Scalmani, V. Barone, B. Mennucci, G. A. Petersson, H. Nakatsuji, M. Caricato, X. Li, H. P. Hratchian, A. F. Izmaylov, J. Bloino, G. Zheng, J. L. Sonnenberg, M. Hada, M. Ehara, K. Toyota, R. Fukuda, J. Hasegawa, M. Ishida, T. Nakajima, Y. Honda, O. K. H. Nakai, T. Vreven, J. A. M. Jr., J. E. Peralta, F. Ogliaro, M. Bearpark, J. J. Heyd, E. Brothers, K. N. Kudin, V. N. Staroverov, T. Keith, R. Kobayashi, J. Normand, K. Raghavachari, A. Rendell, J. C. Burant, S. S. Iyengar, J. Tomasi, M. Cossi, N. Rega, J. M. Millam, M. Klene, J. E. Knox, J. B. Cross, V. Bakken, C. Adamo, J. Jaramillo, R. Gomperts, R. E. Stratmann, O. Yazyev, A. J. Austin, R. Cammi, C. Pomelli, J. W. Ochterski, R. L. Martin, K. Morokuma, V. G. Zakrzewski, G. A. Voth, P. Salvador, J. J. Dannenberg, S. Dapprich, A. D. Daniels, O. Farkas, J. B. Foresman, J. V. Ortiz, J. Cioslowski, D. J. Fox, Gaussian 09, revision d.01, Tech. rep., Wallingford, CT: Gaussian, Inc. (2013).