Chandra Identification of Two AGN Discovered by INTEGRAL
Abstract
Here, we report on observations of two hard X-ray sources that were originally discovered with the INTEGRAL satellite: IGR J04059+5416 and IGR J08297–4250. We use the Chandra X-ray Observatory to localize the sources and then archival near-IR images to identify the counterparts. Both sources have counterparts in the catalog of extended 2 Micron All-Sky Survey sources, and the counterpart to IGR J04059+5416 has been previously identified as a galaxy. Thus, we place IGR J04059+5416 in the class of Active Galactic Nuclei (AGN), and we suggest that IGR J08297–4250 is also an AGN. If this identification is correct, the near-IR images suggest that the host galaxy of IGR J08297–4250 may be merging with a smaller nearby galaxy. For IGR J04059+5416, the 0.3–86 keV spectrum from Chandra and INTEGRAL is consistent with an absorbed power-law with a column density of cm-2 and a photon index of , and we suggest that it is a Seyfert galaxy. For IGR J08297–4250, the photon index is similar, , but the source is highly absorbed ( cm-2).
keywords:
X-rays: general, X-rays: galaxies, galaxies: active, galaxies: Seyfert, stars: individual(IGR J04059+5416, IGR J08297–4250)1 Introduction
The hard X-ray imaging by the INTErnational Gamma-Ray Astrophysics Laboratory (INTEGRAL) satellite (Winkler et al., 2003) has led to the discovery of a large number of new or previously poorly studied “IGR” sources. The most recent published catalogs of 20–100 keV sources detected by the Imager on-Board the INTEGRAL Satellite (IBIS; Ubertini et al., 2003) include more than 700 sources for the whole sky (Bird et al., 2010) and 402 sources within of the Galactic plane111see http://hea.iki.rssi.ru/integral (Krivonos et al., 2012). The current INTEGRAL source catalog222see http://isdc.unige.ch/integral/catalog/38/catalog.html includes 954 sources detected by IBIS. The nature of 200 of the IGR sources is still unknown according to the most up-to-date list333see http://irfu.cea.fr/Sap/IGR-Sources/.
While INTEGRAL has found many new sources, it only localizes them to –, which is not nearly adequate for finding optical/IR counterparts. Short exposures of IGR sources with the Chandra X-ray Observatory allow for a major advance in understanding the nature of these sources by providing sub-arcsecond positions, leading to unique optical/IR counterparts, as well as 0.3–10 keV spectra that can be used to measure column densities and continuum shapes (see Tomsick et al., 2006, 2008, 2009, 2012; Bodaghee et al., 2012, for examples of our previous work on Chandra follow-up of IGR sources). Other groups have been carrying out similar investigations (e.g., Fiocchi et al., 2010; Ratti et al., 2010; Paizis et al., 2011, 2012; Nowak et al., 2012; Karasev et al., 2012).
Prior to this study, little was known about IGR J04059+5416 and IGR J08297–4250. They were discovered in the Krivonos et al. (2012) hard X-ray survey, which includes 9-years of INTEGRAL data. They are listed as being unidentified in the Krivonos et al. (2012) catalog, and there have not been any more publications on these sources. A search of the SIMBAD database does not suggest any likely counterparts. The Chandra observations that we made to identify the sources are described in Section 2. Then, the results are presented in Section 3, including Chandra localizations, near-IR identifications, and an analysis of the Chandra and INTEGRAL energy spectra. Section 4 includes a discussion of the results and the conclusions.
2 Observations and Data Reduction
IGR J04059+5416 and IGR J08297–4250 were both observed with Chandra for 4.9 ks in late-2013 (see Table 1). We used the Advanced CCD Imaging Spectrometer (ACIS, Garmire et al., 2003) instrument, which has a 0.3–10 keV bandpass, and includes two arrays of CCDs: ACIS-I and ACIS-S. Our observations used ACIS-I, giving a arcmin2 field-of-view (FOV), which easily covers the INTEGRAL error circles. We obtained the data from the Chandra X-ray Center and processed it using the Chandra Interactive Analysis of Observations (CIAO) v4.6 software and the Calibration Data Base (CALDB) v4.6.2. We used chandra_repro to produce event lists that were used for further analysis.
3 Results
3.1 Chandra Counterpart Identifications
We searched for Chandra sources by running wavdetect (Freeman et al., 2002) on the ACIS-I images. We used the same method described in Tomsick et al. (2012), including binning the images to four different pixel sizes. In addition, we applied wavdetect to images in three different energy bands: 0.3–10 keV, 0.3–2 keV, and 2–10 keV. Considering the different binnings and different energy bands, we obtained 12 source lists, which we merged into a single list for each observation. We considered all sources detected at a significance level of 2- or greater.
For IGR J04059+5416, we detect 12 sources in the ACIS-I field, and they are listed in Table 2. The ACIS counts are determined using circular extraction regions with radii increasing with off-axis angle () in the same manner as described in Tomsick et al. (2012). For the position uncertainties, we add the systematic and statistical errors in quadrature. For all sources, the systematic pointing error is at 90% confidence and at 99% confidence (Weisskopf, 2005). The statistical uncertainty depends on the number of counts and the off-axis angle, and we use Equation 5 from Hong et al. (2005) to calculate this quantity. The Hong et al. (2005) equation gives a 95% confidence error, but we assume a normal distribution and convert it to a 90% confidence error before adding it in quadrature with the 90% confidence systematic error. Table 2 also includes an estimate of the hardness of each source. As detailed in Table 2 and Tomsick et al. (2012), it is defined so that the maximum hardness is 1.0 (all the counts in the 2–10 keV bin) and the minimum hardness is –1.0 (all the counts in the 0.3–2 keV bin).
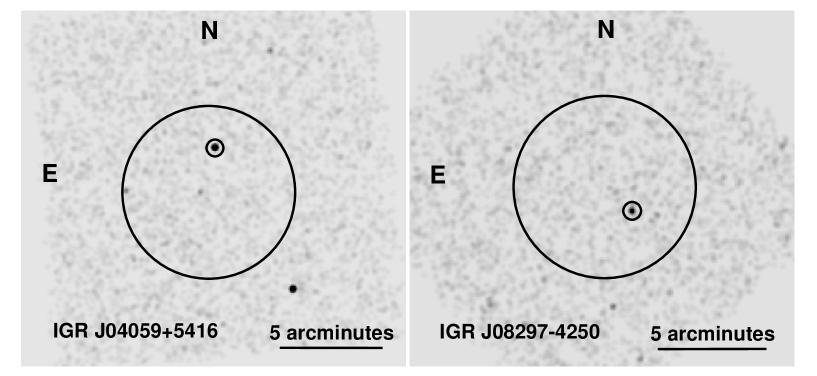
Source #2 has the highest count rate, is only from the INTEGRAL position of IGR J04056+5416, and has a hard spectrum. Source #1 is closer to the INTEGRAL position, but Source #2 is well within the 2- INTEGRAL error circle (see Figure 1). Considering that the count rate for Source #1 is an order of magnitude lower, we argue that Source #2 is a much more likely counterpart. The 2–10 keV image shown in Figure 1 also shows a relatively bright and hard source to the southwest of the INTEGRAL position. This is Source #7, and its count rate and hardness are only slightly lower than Source #2. Although Source #7 was not previously known to be an X-ray source, a catalog search shows that it is positionally coincident with a known radio source, 4C 54.04. However, it is away from the INTEGRAL position, which is well outside the 2- error circle and close to the 3- error circle. Overall, CXOU J040557.6+541845 (Source #2) is, by far, the most likely counterpart to IGR J04059+5416, and its Chandra position is given in Table 2. The 0.3–10 keV ACIS-I count rate for CXOU J040557.6+541845 is s-1 (92.6 counts during the 4910 s observation).
We produced a source list for the IGR J08297–4250 field in the same manner as described above, and we find 18 sources detected by ACIS-I (see Table 3). Although Source #5 has the highest 0.3–10 keV count rate, it is a very soft source with a hardness of – (1- error). This is inconsistent with the hard spectrum required to explain the hard X-ray flux measured by INTEGRAL. Source #2 is closer to the center of the INTEGRAL error circle for IGR J08297–4250, and it is a much harder source with a hardness of 0.6. In fact, of the 22.2 detected photons for Source #2, only one is in the 0.3–2 keV band. Other than Source #5, there are no sources with more than 20 counts, and the other sources with more than 5 counts listed in Table 3 are farther from the INTEGRAL position. The fact that CXOU J082941.0–425158 (Source #2) is the most likely counterpart for IGR J08297–4250 is illustrated in Figure 1 since it is clearly the brightest 2–10 keV source in the field. Its Chandra position is given in Table 3, and the 0.3–10 keV ACIS-I count rate for CXOU J082941.0–425158 is s-1 (22.2 counts during the 4909 s observation). Below, we also discuss one of the fainter sources (Source #1 with 4.2 counts), CXOU J082940.7–425143, which is from CXOU J082941.0–425158.
3.2 Near-IR identifications
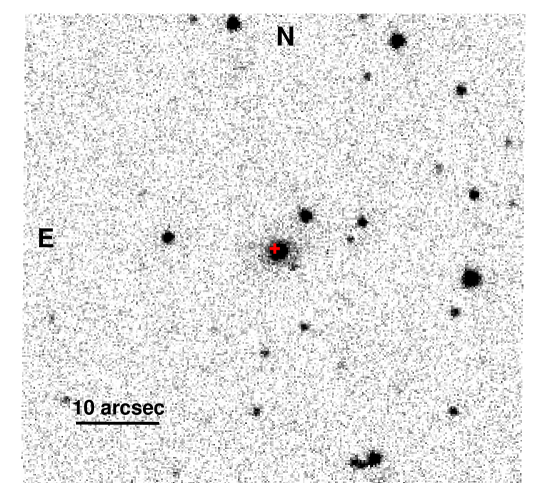
We searched the VizieR database for counterparts to the Chandra sources at other wavelengths. Here, we only discuss the matches that led to conclusions about the nature of the sources. CXOU J040557.6+541845 (=IGR J04059+5416) is within of 2MASX J04055765+5418446, which is from the catalog of extended sources found in the 2MASS survey (Skrutskie et al., 2006). The magnitudes are , , and . Figure 2 shows the UKIDSS -band image for IGR J04059+5416, and the extended emission around 2MASX J04055765+5418446 is visible. The fact that this is an extended near-IR source provides evidence that it is an AGN. In addition, the source is present in the Sloan Digitized Sky Survey, SDSS J040557.62+541844.8, and is identified as a galaxy. A third identification is with WISE J040557.61+541844.9, which shows that the source is bright in the mid-IR with a 22.1 m magnitude of . The WISE source has IR colors [3.4m]-[4.6m]=0.8 and [4.6m]-[12m]=2.8. These are typical colors of Flat Spectrum Radio Quasars (FSRQs) and Seyfert galaxies (see, e.g., Massaro et al., 2011). FSRQs have in general a bright radio emission. This source does not have any associated counterpart in the NRAO VLA Sky Survey (Condon et al., 1998). The lack of strong radio emission favors the Seyfert interpretation.
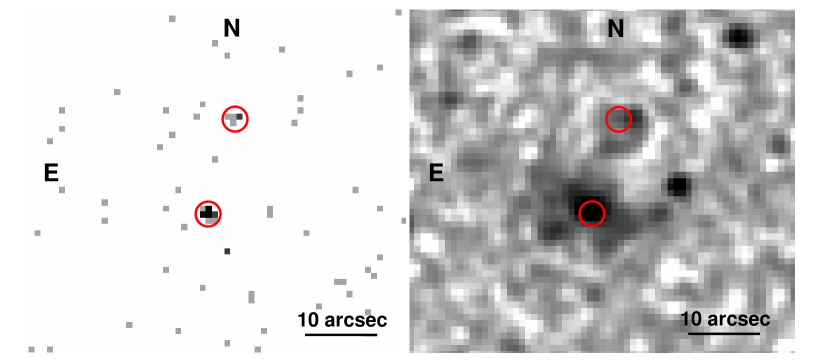
CXOU J082941.0–425158 (=IGR J08297–4250) is also present in the 2MASS catalog of extended sources being from 2MASX J08294112–4251582. Its magnitudes are , , and . Figure 3 shows extended -band emission out to 10′′. We also identify this source with WISE J082941.14-425157.8, which has a 22.1 m magnitude of . The identification of IGR J08297–4250 with an extended near-IR source disfavors or rules out hard X-ray emitting Galactic populations. A High-Mass X-ray Binary (HMXB) might be as bright in the near-IR as 2MASX J08294112–4251582, but HMXBs do not show extended near-IR emission. Another type of source to consider is the class of Pulsar Wind Nebulae (PWNe), which harbor rotation-powered pulsars. These sources have extended X-ray and radio emission, but they are extremely faint in the optical and near-IR. Out of 1800 rotation-powered pulsars, only 12 have UV, optical, or near-IR counterparts, and, with the exception of the Crab Nebula, they are all fainter than 22nd magnitude (Mignani, 2011). Near-IR counterparts have also not been detected in observations of some of the brighter INTEGRAL PWNe (Curran et al., 2011). Thus, an AGN identification is very likely for IGR J08297–4250.
There is a second near-IR source about to the North that also appears to be extended. It does not appear in the extended 2MASS catalog, but it is 2MASS J08294046–4251430 with magnitudes and . We suggest a possible identification of this source with CXOU J082940.7–425143. The Chandra position falls within the extended emission, but it is from the brightest part of the extended near-IR emission. The 2MASS astrometry is good to , indicating that the Chandra source position is clearly inconsistent with the brightest part of the near-IR emission. Whether the Chandra/2MASS association is valid or not, if 2MASS J08294046–4251430 is a galaxy, then it is possible that it is interacting with 2MASX J08294112–4251582. Thus, we consider these sources to potentially be a pair of merging galaxies.
3.3 Energy Spectra
We produced 0.3–10 keV Chandra source and background energy spectra and response files using the CIAO script specextract. We used a circular source extraction region with a radius of 5 pixels () and obtained a background spectrum from a nearby source-free region. For part of our analysis, we also use 17–86 keV energy spectra from INTEGRAL/IBIS. The INTEGRAL spectra are data products obtained as part of the Krivonos et al. (2012) study, and they represent average spectra over a 9-year period. For IGR J04059+5416 and IGR J08297–4250, the INTEGRAL spectra include exposure times of 1.3 Ms and 5.6 Ms, respectively. In the following, we first perform spectral fitting for the two IGR sources with Chandra only, and then we jointly fit the Chandra and INTEGRAL spectra. Some caution is necessary regarding the joint fits since we are combining a single Chandra snapshot with INTEGRAL’s 9-year average. All spectral fitting is done with XSPEC v12.8.2.
3.3.1 IGR J04059+5416
Due to the low number of counts, we fit the Chandra spectra by minimizing the Cash statistic (Cash, 1979). Although this statistic does not require binning of the data, we made a spectrum with a signal-to-noise ratio of at least 3 in each bin (except for the highest energy bin where the signal-to-noise ratio is 2.8) in order to look for any significant features in the residuals and to use the value as a representative determination of the quality of the fit. A simple absorbed power-law model provides an acceptable fit with a Cash statistic of 2.0 and a reduced- of 0.35 for 5 degrees of freedom (dof). As shown in Table 4, the column density, which is calculated using Wilms et al. (2000) abundances and Verner et al. (1996) cross sections, is cm-2 (90% confidence errors are given here and throughout the paper). This is significantly higher than the Galactic value along the IGR J04059+5416 line of sight, cm-2 (Kalberla et al., 2005), indicating that some of the absorption is from the AGN’s host galaxy. The photon index from the Chandra-only fit is .
We also performed spectral fits to the Chandra+INTEGRAL joint spectrum (see Table 4 and Figure 4). We used minimization due to the high level of background for INTEGRAL. As before, we fit with an absorbed power-law model, and we also included a constant parameter, which allows for different overall normalizations for the two spectra (due to, e.g., possible source variability). For the joint fit, there is very little change to the and parameters. With a value of , the INTEGRAL normalization relative to Chandra does not allow us to draw conclusions on the source variability (1.0 indicating no variability). The constant source case would imply a harder spectrum (see Table 4). For all the IGR J04059+5416 fits, we only included the three lowest energy INTEGRAL bins in the fit because the source was not detected in the highest energy bin. The 2- upper limit on the flux in the the 57–86 keV bin is somewhat lower than the power-law (see Figure 4), which could be the sign of a cutoff.
3.3.2 IGR J08297–4250
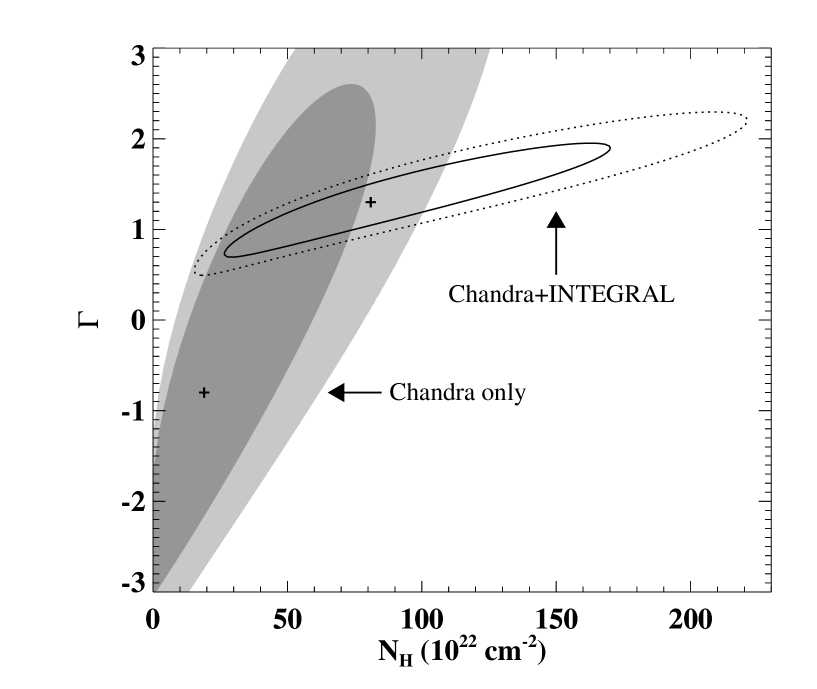
Here, we also began by fitting just the Chandra spectrum with an absorbed power-law model and minimizing the Cash statistic. This provides an acceptable fit with a Cash statistic of 6.4 and a reduced- of 0.65 for 5 dof. For binning, we used a signal-to-noise ratio requirement of at least 1.25 per bin. The best fit spectral parameters are cm-2 and = –0.8, but they are both very poorly constrained since the spectrum only has 22 counts. We produced error contours for and , and these are shown in Figure 5. The two parameters are highly-degenerate, and it is unclear if the spectrum is intrinsically very hard or if the column density is very high.
As shown in Figure 4, the spectrum shows a high point at keV, and this could be interpreted as a noise fluctuation or a redshifted Fe K emission line. When a narrow Gaussian is added, the Cash statistic drops from 6.4 to 0.4. To determine if the Gaussian is required by the data, we used simftest to make 1000 simulated spectra with the absorbed power-law model as the parent distribution. For the significance test, we used a spectrum with 21 bins to lessen any bias due to binning. With the actual data, the Cash statistic decreases from 16.7 to 10.1 for 17 dof. When the simulated spectra are fit with and without a narrow Gaussian in the 5–7 keV range, they show improvements by at least as much as the actual data 5% of the time, and we conclude that the significance of the line is 2.0-. We consider this to be a marginal detection of a redshifted Fe K line.
Fitting the INTEGRAL spectrum jointly with Chandra greatly improves the constraints on the spectral parameters (Table 5). A very large column density of cm-2 is required, and while Chandra alone allowed for the possibility of a very hard power-law spectrum, we find , which is typical for AGN. The column density is very much in excess of the Galactic value along the line of sight. While the INTEGRAL normalization relative to Chandra allows for significant variability, the parameters do not change significantly for the constant source case, and the error contours for these parameters are shown in Figure 5. The addition of the INTEGRAL data allows us to rule out the low-/hard- solution that was a possibility with Chandra alone.
Figure 4 shows that the simple absorbed power-law fit results in a mismatch between the model and the lowest energy bin in the Chandra spectrum. Although the descrepancy is only 1-, the addition of absorption with partial covering provides a good explanation, and the ratio residual for this bin goes from being off-scale in Figure 4e (actually, the value of the ratio is ) to being very close to 1.0 (). While it is likely that there is partial covering absoprtion for this source, it does not provide a large enough improvement in the fit to be formally required, and the statistical quality of the spectrum is not sufficient to constrain the parameters.
4 Discussion and Conclusions
For our larger Chandra study in 2013–2014, we chose ten unidentified INTEGRAL sources from the Krivonos et al. (2012) catalog. While analysis of the data is still on-going (and one observation has not yet occurred), the observations that we report on here have yielded an identification of one AGN (IGR J04059+5416) and one likely AGN (IGR J08297–4250). Of the 402 sources in the Krivonos et al. (2012) catalog, 112 were identified as AGN or AGN candidates (with 104 being confirmed AGN). Although we selected sources within of the Galactic plane (compared to the full catalog, which goes out to ), and IGR J04059+5416 and IGR J08297–4250 have Galactic latitudes of and = –, respectively, it is still not extremely surprising for 20% of our sample to be composed of AGN. In our previous studies, we have identified several INTEGRAL sources near the Galactic Plane as AGN (Chaty et al., 2008; Zurita Heras et al., 2009; Tomsick et al., 2012).
The 112 AGN or AGN candidates in the Krivonos et al. (2012) catalog have 17–60 keV fluxes ranging from 0.37 mCrab to 12 mCrab with a median flux of 0.98 mCrab. In the Krivonos et al. (2012) catalog, the 17–60 keV fluxes of IGR J04059+5416 and IGR J08297–4250 are 0.86 and 0.35 mCrab, respectively. Thus, IGR J04059+5416 is close to the median flux, and IGR J08297–4250 is slightly fainter than the faintest source identified as an AGN in the catalog.
For IGR J04059+5416, the optical and near-IR information provides the strongest evidence that it is an AGN, but the type of AGN is not immediately clear. The Chandra+INTEGRAL spectral fit for the gives a very hard spectrum (), which might argue that the source is a blazar. However, the non-detection in the 57–86 keV band would require a sharp spectral cutoff, and this would not be expected for a blazar at this energy. It is more likely that the source is moderately variable and that it is a Seyfert galaxy. The 9-year 17–60 keV IBIS light curve444see http://www.mpa-garching.mpg.de/integral/nine-years-galactic-survey/index.php?srcid=837 does not show statistically significant variability, but the errors on individual flux measurements are large, and we calculate that the light curve allows for year-to-year flux changes by as much as a factor of two or three. Thus, it is possible that the Chandra observation occurred when the flux was relatively low.
For IGR J08297–4250, the Chandra+INTEGRAL fits indicate a power-law with an index consistent with what would be expected for a Seyfert galaxy, and the high absorption may indicate a Seyfert 2 classification. Although the 6.0 keV emission line is only significant at the 2- level, if its rest-frame energy is 6.4 keV (neutral iron K), then the redshift is . For an unabsorbed 0.3–10 keV flux of erg cm-2 s-1, the corresponding luminosity would be erg s-1, which is typical for hard X-ray selected Seyfert 2 AGN (Ajello et al., 2012).
Koss et al. (2010) estimated that up to 25% of the AGN detected above 15 keV by Swift/BAT are found in hosts in an apparent state of merging with a nearby (30 kpc) galaxy. This, together with the fact that AGN luminosity increases for decreasing separation of the galaxy pair (Koss et al., 2012), highlights the role that merging has in triggering AGN activity. It is thus not unlikely to find an AGN hosted in a merging pair while following up on newly detected INTEGRAL sources. The majority of INTEGRAL Seyfert-like AGN are detected at z0.1, implying that the separation between CXOU J082941.0–425158 and CXOU J082940.7–425143 (assuming they are a merging pair of galaxies) is 30 kpc. Koss et al. (2012) found that systems with a close companion (e.g. 30 kpc) often display AGN activity in both hosts, similarly to what we find here. Moreover, some of the hosts of close merging pairs present a disrupted morphology (Koss et al., 2012), which might explain the offset of CXOU J082940.7–425143 from the brightest part of the extended near-IR emission. We thus believe that, on the basis of the evidence gathered so far, IGR J08297–4250 is an AGN that might possibly be hosted in a merging pair. However, final confirmation will have to await higher resolution near-IR imaging and optical spectroscopy.

| Target | (deg.) | (deg.) | ObsID | Start Time (UT) | End Time (UT) | Exposure Time (s) |
|---|---|---|---|---|---|---|
| IGR J04059+5416 | 148.93 | +1.54 | 15792 | 2013 Nov 22, 18.7 h | 2013 Nov 22, 20.9 h | 4910 |
| IGR J08297–4250 | 261.08 | –2.21 | 15793 | 2013 Dec 4, 20.3 h | 2013 Dec 4, 22.1 h | 4909 |
| Source | 555The angular distance between the center of the INTEGRAL error circle, which is also the approximate Chandra aimpoint, and the source. | Chandra R.A. | Chandra Decl. | ACIS | Position | |
|---|---|---|---|---|---|---|
| Number | (arcminutes) | (J2000) | (J2000) | Counts666The number of ACIS-I counts detected (after background subtraction) in the 0.3–10 keV band. | Uncertainty777The 90% confidence uncertainty on the position, including statistical and systematic contributions. | Hardness888The hardness is given by , where is the number of counts in the 2–10 keV band and is the number of counts in the 0.3–2 keV band. |
| 1 | 0.40 | + | 8.6 | +0.1 | ||
| 2 | 2.21 | + | 92.6 | + | ||
| 3 | 2.72 | + | 8.6 | –0.2 | ||
| 4 | 3.64 | + | 6.6 | + | ||
| 5 | 4.04 | + | 14.3 | + | ||
| 6 | 5.60 | + | 7.3 | + | ||
| 7 | 6.22 | + | 84.3 | + | ||
| 8 | 6.44 | + | 6.3 | –0.3 | ||
| 9 | 7.20 | + | 8.2 | 0.0 | ||
| 10 | 7.51 | + | 15.2 | + | ||
| 11 | 7.64 | + | 7.2 | +0.3 | ||
| 12 | 8.25 | + | 5.2 | +0.2 |
| Source | 999The angular distance between the center of the INTEGRAL error circle, which is also the approximate Chandra aimpoint, and the source. | Chandra R.A. | Chandra Decl. | ACIS | Position | |
|---|---|---|---|---|---|---|
| Number | (arcminutes) | (J2000) | (J2000) | Counts101010The number of ACIS-I counts detected (after background subtraction) in the 0.3–10 keV band. | Uncertainty111111The 90% confidence uncertainty on the position, including statistical and systematic contributions. | Hardness121212The hardness is given by , where is the number of counts in the 2–10 keV band and is the number of counts in the 0.3–2 keV band. |
| 1 | 1.58 | – | 4.2 | –0.4 | ||
| 2 | 1.67 | – | 22.2 | +0.6 | ||
| 3 | 1.79 | – | 3.2 | –0.7 | ||
| 4 | 2.42 | – | 3.2 | — | ||
| 5 | 2.77 | – | 40.2 | – | ||
| 6 | 3.59 | – | 8.2 | – | ||
| 7 | 4.70 | – | 5.8 | –0.2 | ||
| 8 | 5.55 | – | 13.8 | + | ||
| 9 | 5.69 | – | 5.8 | +0.2 | ||
| 10 | 6.68 | – | 10.8 | –0.4 | ||
| 11 | 6.87 | – | 2.8 | — | ||
| 12 | 7.21 | – | 2.9 | — | ||
| 13 | 7.31 | – | 4.9 | –0.9 | ||
| 14 | 7.32 | – | 7.9 | +0.1 | ||
| 15 | 7.51 | – | 16.9 | + | ||
| 16 | 8.11 | – | 4.9 | — | ||
| 17 | 8.42 | – | 11.9 | +0.1 | ||
| 18 | 10.25 | – | 4.9 | — |
| Parameter131313The errors on the parameters are 90% confidence. | Units | Chandra-only | Chandra+INTEGRAL | |
|---|---|---|---|---|
| 141414The column density is calculated assuming Wilms et al. (2000) abundances and Verner et al. (1996) cross sections. Along this line of sight, the Galactic value is cm-2 (Kalberla et al., 2005). | cm-2 | |||
| – | ||||
| Unabs. Flux (0.3–10 keV) | erg cm-2 s-1 | |||
| Abs. Flux (0.3–10 keV) | erg cm-2 s-1 | |||
| 151515The INTEGRAL normalization relative to Chandra. | – | – | 1.0161616Fixed. | |
| Parameter171717The errors on the parameters are 90% confidence. | Units | Chandra+INTEGRAL | |
|---|---|---|---|
| 181818The column density is calculated assuming Wilms et al. (2000) abundances and Verner et al. (1996) cross sections. Along this line of sight, the Galactic value is cm-2 (Kalberla et al., 2005). | cm-2 | ||
| – | |||
| Unabs. Flux (0.3–10 keV) | erg cm-2 s-1 | ||
| Abs. Flux (0.3–10 keV) | erg cm-2 s-1 | ||
| 191919The INTEGRAL normalization relative to Chandra. | – | 1.0202020Fixed. | |
Acknowledgments
Support for this work was provided by the National Aeronautics and Space Administration (NASA) through Chandra Award Number GO4-15044X issued by the Chandra X-ray Observatory Center, which is operated by the Smithsonian Astrophysical Observatory for and on behalf of NASA under contract NAS8-03060. This publication makes use of data products from the Two Micron All Sky Survey, which is a joint project of the University of Massachusetts and the Infrared Processing and Analysis Center/California Institute of Technology, funded by the NASA and the National Science Foundation. This research has made use of the VizieR catalogue access tool, the SIMBAD database (CDS, Strasbourg, France), and the IGR Sources page maintained by J. Rodriguez & A. Bodaghee.
References
- Ajello et al. (2012) Ajello M., Alexander D. M., Greiner J., Madejski G. M., Gehrels N., Burlon D., 2012, ApJ, 749, 21
- Bird et al. (2010) Bird A. J. et al., 2010, ApJS, 186, 1
- Bodaghee et al. (2012) Bodaghee A., Rahoui F., Tomsick J. A., Rodriguez J., 2012, ApJ, 751, 113
- Cash (1979) Cash W., 1979, ApJ, 228, 939
- Chaty et al. (2008) Chaty S., Rahoui F., Foellmi C., Tomsick J. A., Rodriguez J., Walter R., 2008, A&A, 484, 783
- Condon et al. (1998) Condon J. J., Cotton W. D., Greisen E. W., Yin Q. F., Perley R. A., Taylor G. B., Broderick J. J., 1998, AJ, 115, 1693
- Curran et al. (2011) Curran P. A., Chaty S., Zurita Heras J. A., Coleiro A., 2011, A&A, 534, A48
- Fiocchi et al. (2010) Fiocchi M., Bassani L., Bazzano A., Ubertini P., Landi R., Capitanio F., Bird A. J., 2010, ApJ, 720, 987
- Freeman et al. (2002) Freeman P. E., Kashyap V., Rosner R., Lamb D. Q., 2002, ApJS, 138, 185
- Garmire et al. (2003) Garmire G. P., Bautz M. W., Ford P. G., Nousek J. A., Ricker G. R., 2003, in X-Ray and Gamma-Ray Telescopes and Instruments for Astronomy. Edited by Joachim E. Truemper, Harvey D. Tananbaum. Proceedings of the SPIE, 4851, 28
- Hong et al. (2005) Hong J., van den Berg M., Schlegel E. M., Grindlay J. E., Koenig X., Laycock S., Zhao P., 2005, ApJ, 635, 907
- Kalberla et al. (2005) Kalberla P. M. W., Burton W. B., Hartmann D., Arnal E. M., Bajaja E., Morras R., Pöppel W. G. L., 2005, A&A, 440, 775
- Karasev et al. (2012) Karasev D. I., Lutovinov A. A., Revnivtsev M. G., Krivonos R. A., 2012, Astronomy Letters, 38, 629
- Koss et al. (2012) Koss M., Mushotzky R., Treister E., Veilleux S., Vasudevan R., Trippe M., 2012, ApJ, 746, L22
- Koss et al. (2010) Koss M., Mushotzky R., Veilleux S., Winter L., 2010, ApJ, 716, L125
- Krivonos et al. (2012) Krivonos R., Tsygankov S., Lutovinov A., Revnivtsev M., Churazov E., Sunyaev R., 2012, A&A, 545, A27
- Massaro et al. (2011) Massaro F., D’Abrusco R., Ajello M., Grindlay J. E., Smith H. A., 2011, ApJ, 740, L48
- Mignani (2011) Mignani R. P., 2011, Advances in Space Research, 47, 1281
- Nowak et al. (2012) Nowak M. A. et al., 2012, ApJ, 757, 143
- Paizis et al. (2012) Paizis A., Nowak M. A., Rodriguez J., Wilms J., Chaty S., Del Santo M., Ubertini P., 2012, ApJ, 755, 52
- Paizis et al. (2011) Paizis A. et al., 2011, ApJ, 738, 183
- Ratti et al. (2010) Ratti E. M., Bassa C. G., Torres M. A. P., Kuiper L., Miller-Jones J. C. A., Jonker P. G., 2010, MNRAS, 408, 1866
- Skrutskie et al. (2006) Skrutskie M. F. et al., 2006, AJ, 131, 1163
- Tomsick et al. (2012) Tomsick J. A., Bodaghee A., Chaty S., Rodriguez J., Rahoui F., Halpern J., Kalemci E., Özbey Arabaci M., 2012, ApJ, 754, 145
- Tomsick et al. (2006) Tomsick J. A., Chaty S., Rodriguez J., Foschini L., Walter R., Kaaret P., 2006, ApJ, 647, 1309
- Tomsick et al. (2009) Tomsick J. A., Chaty S., Rodriguez J., Walter R., Kaaret P., 2009, ApJ, 701, 811
- Tomsick et al. (2008) Tomsick J. A. et al., 2008, ApJ, 680, 593
- Ubertini et al. (2003) Ubertini P. et al., 2003, A&A, 411, L131
- Verner et al. (1996) Verner D. A., Ferland G. J., Korista K. T., Yakovlev D. G., 1996, ApJ, 465, 487
- Weisskopf (2005) Weisskopf M. C., 2005, arXiv:astro-ph/0503091
- Wilms et al. (2000) Wilms J., Allen A., McCray R., 2000, ApJ, 542, 914
- Winkler et al. (2003) Winkler C. et al., 2003, A&A, 411, L1
- Zurita Heras et al. (2009) Zurita Heras J. A., Chaty S., Tomsick J. A., 2009, A&A, 502, 787