xx
Interaction of Cygnus A with its environment
Abstract
Cygnus A, the nearest truly powerful radio galaxy, resides at the centre of a massive galaxy cluster. Chandra X-ray observations reveal its cocoon shocks, radio lobe cavities and an X-ray jet, which are discussed here. It is argued that X-ray emission from the outer regions of the cocoon shocks is nonthermal. The X-ray jets are best interpreted as synchrotron emission, suggesting that they, rather than the radio jets, are the path of energy flow from the nucleus to the hotspots. In that case, a model shows that the jet flow is non-relativistic and carries in excess of one solar mass per year.
keywords:
radio continuum: galaxies, X-rays: galaxies: clusters, galaxies: individual (Cygnus A)1 Introduction
At a redshift of 0.056, the Fanaroff-Riley class II radio galaxy Cygnus A is the nearest of the truly powerful radio galaxies, much closer than any comparable sources ([Carilli & Barthel 1996]). As a result, it the archetype of powerful radio galaxies. The galaxy that hosts Cygnus A is also the central galaxy of a massive galaxy cluster, so that interactions between the expanding radio lobes of Cygnus A and the surrounding gas can be observed in the X-ray (\eg[Carilli et al. 1994], [Smith et al. 2002]). Here we discuss some properties of Cygnus A determined from Chandra X-ray observations.
2 The lobes and shocks
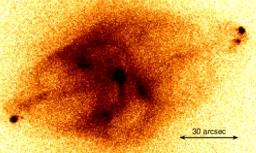
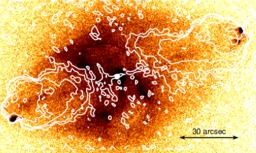
The 0.5 – 7 keV image of Cygnus A in Fig. 1 was made from 246 ksec of cleaned Chandra data obtained between 2000 and 2005. The physical scale is . A cocoon shock appears as an X-ray edge surrounding the radio lobes and hot spots, which extends from arcsec north of the AGN at the centre to arcsec to the west. There is a great deal of internal structure, much of which is due to thermal emission from gas within the shock. In contrast to the majority of nearby, low power radio sources at cluster centres, there are no X-ray deficits over the radio lobes of Cygnus A. However, comparing the upper and lower images in Fig. 1, we see that the X-ray emission is brighter in regions between the edge of the radio lobes and the cocoon shocks than it is in adjacent regions over the lobes. This is as we should expect. The gas displaced by the radio lobes must be compressed into the spaces between the expanding lobes and the shock fronts, making it brighter than the undisturbed gas and producing a net excess of X-ray emission over the radio cocoon. The excess is greatest where our sight lines through the layer of compressed gas outside the radio lobes are longest. The detailed correspondence between the edges of the radio lobes and enhanced X-ray emission adds weight to the argument that there are indeed X-ray cavities corresponding to the radio lobes of Cygnus A, as in lower power sources. In addition, [Chon et al. (2012)] have noted that the X-ray deficit to the south of the AGN corresponds to emission in the 250 MHz LOFAR map ([McKean et al. 2011] and these proceedings), arguing that this is older radio plasma. The deep X-ray image shows that this central cavity extends about half as far to the north as it does to the south. To the north and west of the AGN the edge of this cavity is remarkably sharp. This puts tight constraints on either the physical properties of the gas and radio plasma, or on the dynamics of formation of these cavities (\eg[Reynolds et al. 2005], [Pizzolato & Soker 2006]).

3 Mean jet power
The cocoon shocks provide an excellent means for estimating the average power of Cygnus A during its current outburst. We have fitted the X-ray surface brightness profile of the shock front in a 50 degree wedge to the southwest of the AGN with a shock model. A spherical, numerical hydrodynamic model was used to compute surface brightness profiles of shocks due to point explosions at the centre of an initially isothermal, hydrostatic atmosphere (\eg[Nulsen et al. 2005]). For the best fitting model, the density in the unperturbed gas varies as , the radius of the shock is 40 kpc, its Mach number is 1.37, its age is 16 Myr and its mean power is . The Chandra surface brightness profile of the shock is very insensitive to the gas temperature, so that the temperature profile provides an independent test of the model. Our assumption that the unshocked gas is isothermal is only roughly correct. Nevertheless, the model predicts that the projected temperature should peak arcsec behind the shock, keV above the preshock temperature. Allowing for the preexisting temperature gradient and smearing due to spherical averaging, the shock model is consistent with the observed profile of projected temperature (Fig. 2). The spherical model underestimates the shocked volume, hence the total energy required to drive the shocks. A more realistic model would also have continuous energy injection, which leaves a greater fraction of the injected energy in cavities, increasing the energy required to produce a given shock strength. Thus, we have underestimated the total outburst energy. On the other hand, the point explosion model maximizes the shock speed at early times, causing the shock age to be underestimated and increasing the power estimate. The net result is probably to underestimate the average jet power, but not by more than a factor of about two.
4 Particle acceleration in the shock
[Croston et al. (2009)] found that X-ray emission from the inner portions of the shock surrounding the southwest lobe of Centaurus A is thermal, while that from more remote parts of the shock is nonthermal. The thermal emission fades out before the nonthermal emission appears, creating a gap in the X-ray shock front. There is a similar gap in the Cygnus A shock front, seen most clearly in the region 15 – 20 arcsec inside the western hotspots in Fig. 1. Is this also due to a changeover from thermal to nonthermal X-ray emission? The existing X-ray data are unable to distinguish between thermal and nonthermal models for the shocks near the hotspots. However, it is noteworthy that the 6 cm radio emission, which is confined within the layer of shock compressed gas in the inner regions of the radio lobe, extends right out to the X-ray shock beyond the gap, in the regions around the hotspots. This radio emission must arise in the shocked intracluster medium, rather than within the radio lobes, providing clear evidence for particle acceleration in the outer parts of the cocoon shocks. Since the shock fronts near the hotspots are furthest from the AGN, they must travel fastest. Allowing for the shape of the fronts and projection, we estimate that shocks near the hotspots have Mach numbers of no more than 3. While the compression is greater in a Mach 3 shock, this is more than offset by the lower preshock gas density and the smaller radius of curvature of the front near the hotspots. We estimate that thermal emission from the shocks near the hotspots should be no more than of that at the southwest front. Thus it appears that the X-ray emission from the shock near the hotspots is too bright to be thermal.
5 X-ray jet
The region of enhanced emission running along the axis of the radio cocoon, roughly between the two sets of hotspots, is called the X-ray jet. It does not coincide with the radio jet, being considerably wider, arcsec or kpc, and straighter. The eastern X-ray jet is at least as bright as the western X-ray jet, the approaching side of the radio jet, making it unlikely that Doppler boosting plays a role in its X-ray emission. [Steenbrugge et al. (2008)] argued that the X-ray jet is inverse Compton emission from relatively low energy electrons left behind after passage of the radio jet at earlier times. An X-ray spectrum extracted from a rectangular region near its eastern end, with flanking background regions, is equally well fitted by thermal and nonthermal models, but it is hard to conceive of a physically reasonable thermal model for the jet emission. The power law fit gives a photon index of (90% confidence). Assuming this emission is inverse Compton scattered cosmic microwave background radiation (ICCMB), the population of electrons required to produce it, with a power law distribution (to match the slope of the X-ray spectrum) for Lorentz factors in the range , alone would have a pressure more than an order of magnitude larger than the surrounding gas. Lorentz factors of are required to produce 1 keV X-ray photons by scattering the CMB, so it is difficult to get a lower pressure from a realistic model. Magnetic fields and cosmic rays would add to the total pressure, so an ICCMB model is largely ruled out. Optical and ultraviolet radiation from the active nucleus of Cygnus A, or radio photons from the hotspots might also provide seed photons for inverse Compton scattering, but in either case we would expect the jet to brighten significantly towards the photon source, which is not observed.
Alternatively, the X-ray jet could be due to synchrotron emission. For a magnetic field strength of , roughly the equipartition field in the lobes, electrons with are required to produce 1 keV synchrotron photons. For a power law electron distribution like that of the ICCMB model, the required pressure would be smaller. However, the synchrotron lifetimes of the electrons would be only yr, so a synchrotron model requires in situ electron acceleration (the smallest distance resolvable by Chandra in Cygnus A is light years). This is much like the Centaurus A jet, but there the case for X-ray synchrotron emission is strong (\eg[Goodger et al. 2010]). The main issue for Cygnus A is that an active power source is required to maintain the population of highly relativistic electrons. This problem would be solved if the X-ray jet reveals the actual path of energy flow from the AGN to the hotspots. Further supporting this, the width of the X-ray jet is similar to that of the brighter hotspots, which would naturally explain their sizes. The hotspots are highly overpressured and likely dominated by relativistic plasma. To keep a hotspot confined by the “dentist drill” effect, a narrow jet must wander over the whole inward facing surface of the hotspot in a time that is small compared to the sound crossing time of the hotspot. This is incredibly challenging. It suggests that we should observe the path of a narrow jet to wobble side-to-side, on a scale comparable to the width of the hotspot, over distances along the jet (times) of comparable dimension (or smaller), but this is not seen. Of course, if the X-ray jet is the main path of energy flow, the puzzle is then the origin of the radio jets.
6 A jet flow model


We use a steady, one-dimensional flow model, like that of [Laing & Bridle (2002)], to estimate flow parameters for Cygnus A. The flow rate of rest mass through the jet is
| (1) |
where , is the corresponding Lorentz factor, is the proper density of rest mass in the jet and is its cross-sectional area. The jet power is
| (2) |
where the enthalpy per unit volume is and we will assume , where is the pressure and is constant. Lastly, the jet momentum flux is
| (3) |
The pressure in a hotspot must be close to the ram pressure of the jet that runs into it, so we assume . Eliminating between the equations (2) and (3) gives
| (4) |
which determines the jet speed, since we have estimates for all the other quantities. Synchrotron-self-Compton models give hotspot magnetic field strengths in the range 150 – 250 ([Harris et al. 1994, Wilson et al. 2000]), so that, if the total pressure scales with the magnetic pressure, – 20. Using the shock speeds and external pressures gives lower values, closer to . We assume that the jet is cylindrical with a radius of 3 kpc and a pressure of . From section 3, the power of a single jet is or somewhat larger. Fig. 3 shows solutions for and vs jet power over its plausible range and for , 10 and 20. For reasonable flow solutions, the velocity in the outer part of the jet is non-relativistic, while the mass flux probably exceeds . It seems likely that most of this mass is entrained by the jet, rather than flowing all the way from the AGN.
7 Conclusions
The radio lobe cavities and cocoon shocks of Cygnus A have much in common with lower power radio sources in galaxy clusters. The mean power of the current outburst in Cygnus A is , or somewhat larger. Near to its hotspots, the cocoon shocks of Cygnus A accelerate electrons, at least to energies sufficient to produce 6 cm radio synchrotron emission and quite possibly also keV X-rays. The X-ray jet of Cygnus A is best explained as synchrotron emission, which suggests that the X-ray jet, rather than the radio jet, is the main route of power from the AGN to the hotspots. Under this assumption, we find that the outer parts of the jets have flow speeds and the mass flow rate through the jets is significant.
PEJN was partly supported by NASA contract NAS8-03060.
References
- [Carilli & Barthel 1996] Carilli, C.L., & Barthel, P.D. 1996, A&A Rev., 7, 1
- [Carilli et al. 1994] Carilli, C.L., Perley, R.A., & Harris, D. E. 1994, MNRAS, 270, 173
- [Chon et al. (2012)] Chon, G., Böhringer, H., Krause, M., & Trümper, J. 2012, A&A, 545, LL3
- [Croston et al. (2009)] Croston, J.H., Kraft, R.P., Hardcastle, M.J., et al. 2009, MNRAS, 395, 1999
- [Goodger et al. 2010] Goodger, J.L., Hardcastle, M.J., Croston, J.H., et al. 2010, ApJ, 708, 675
- [Harris et al. 1994] Harris, D.E., Carilli, C.L., & Perley, R.A. 1994, Nature, 367, 713
- [Laing & Bridle (2002)] Laing, R.A., & Bridle, A.H. 2002, MNRAS, 336, 1161
- [McKean et al. 2011] McKean, J., Ker, L., van Weeren, R.J., et al. 2011, arXiv:1106.1041
- [Nulsen et al. 2005] Nulsen, P.E.J., McNamara, B.R., Wise, M.W., & David, L.P. 2005, ApJ, 628, 629
- [Perley et al. (1984] Perley, R.A., Dreher, J.W., & Cowan, J.J. 1984, ApJ, 285, L35
- [Pizzolato & Soker 2006] Pizzolato, F., & Soker, N. 2006, MNRAS, 371, 1835
- [Reynolds et al. 2005] Reynolds, C.S., McKernan, B., Fabian, A.C., et al. 2005, MNRAS, 357, 242
- [Smith et al. 2002] Smith, D.A., Wilson, A.S., Arnaud, K.A., Terashima, Y., & Young, A.J. 2002, ApJ, 565, 195
- [Steenbrugge et al. (2008)] Steenbrugge, K.C., Blundell, K.M., & Duffy, P. 2008, MNRAS, 388, 1465
- [Wilson et al. 2000] Wilson, A.S., Young, A.J., & Shopbell, P.L. 2000, ApJ, 544, L27