Discovery of Gamma-Ray Orbital Modulation in the black widow PSR J13113430
Abstract
We report our discovery of orbitally modulated -ray emission from the black widow system PSR J13113430. We analyze the Fermi Large Area Telescope data during the offpulse phase interval of the pulsar, and find the orbital modulation signal at a 3 confidence level. Further spectral analysis shows no significant differences for the spectra obtained during the bright and faint orbital phase ranges. A simple sinusoid-like function can describe the modulation. Given these properties, we suggest that the intrabinary -ray emission arises from the region close to the companion and the modulation is caused by the occultation of the emitting region by the companion, similar to that is seen in the transitional millisecond pulsar binary (MSP) PSR J1023+0038. Considering the X-ray detection of intrabinary shock emission from eclipsing MSP binaries recently reported, this discovery further suggests the general existence of intrabinary -ray emission from them.
Subject headings:
binaries: close — pulsars: individual (PSR J13113430) — gamma rays: stars1. Introduction
Millisecond pulsars (MSPs) are widely accepted to be old neutron stars that were spun up through mass accretion from the companions when they were at the low-mass X-ray binary phase (Alpar et al., 1982; Radhakrishnan & Srinivasan, 1982). Not surprisingly, 60% known MSPs are in binaries (e.g., Manchester et al. 2005). A sub-class of them, so-called ‘black widow’ pulsar systems (Fruchter et al., 1988), have very low-mass, 0.02 companions. To form isolated MSPs, one possible channel is through ablation of the companions by the pulsar wind. This possibility likely occurs in the black widows since they are eclipsing systems at radio frequencies, indicating the interaction between the pulsar wind and the companions. X-ray observations of them revealed orbital flux variations, also supporting the presence of the intrabinary interaction (Huang et al., 2012; Gentile et al., 2014). In addition, recent extensive studies of the so-called ‘redback’ systems (Roberts, 2013) have provided clear evidence for the interaction. These redbacks are also eclipsing MSP binaries, but contain relative massive, 0.1–0.6 companions. X-ray observations of the prototypical redback PSR J1023+0038 detected significant orbital flux variations (Archibald et al., 2010; Bogdanov et al., 2011), and the variations can be explained by the existence of an intrabinary shock region (Bogdanov et al., 2011). Similar features were also clearly seen in the redback XSS J122704859 (Bogdanov et al. 2014 and references therein).
Owing to its all-sky monitoring and high sensitivity capabilities, the Fermi Gamma-ray Space Telescope, launched in 2008, has greatly improved our studies of pulsars. For MSPs, more than six-fold black widows and redbacks have been discovered with the help of Fermi (e.g., Roberts 2013). At Fermi’s 100 MeV to 300 GeV energy range, marginal evidence for the intrabinary interaction in the eclipsing systems has also been seen. For the first discovered black widow PSR B195720 (Fruchter et al., 1988), an orbital modulation signal was detected at a confidence level (Wu et al., 2012). In addition, possible signals were also reported for XSS J122704859 (Xing & Wang, 2014) and a candidate redback 2FGL J0523.32530 (Xing et al., 2014). Theoretical studies have long predicted the intrabinary interaction and related high-energy emission from black widows (e.g., Arons & Tavani 1993). Studies of the -ray emission from the intrabinary region allow us to explore the detailed physical processes within such a binary (e.g., Roberts et al. 2014). In this paper we report the detection of orbitally modulated -ray emission from a recently discovered black widow PSR J13113430, which thus indicates the intrabinary origin for part of its emission.
PSR J13113430 was initially listed as an unassociated source in the Fermi Large Area Telescope (LAT) source catalog (2FGL J1311.73429; Nolan et al. 2012). It is the only -ray selected MSP with -ray pulsed emission discovered via a direct blind search in the Fermi data (Pletsch et al., 2012). The pulsed radio emission soon was detected too (Ray et al., 2013), but the signal was visible only during 10% of the observation time, suggesting strong variations in the intrabinary medium. Before the discovery, the source was found to have orbital modulation with a short period of 94 minutes through optical imaging and spectroscopy (Romani, 2012; Romani et al., 2012). Considering its properties of weak X-ray emission, sinusoid-like optical modulation and large modulation amplitude, it was already suggested to be a black widow system and the optical modulation is caused by irradiation of the companion by the pulsar wind (Romani, 2012). Marginal modulated X-ray emission possibly related to the intrabinary shock has also been detected (Romani, 2012; Kataoka et al., 2012). The -ray discovery of the 2.56 ms spin signal thus confirmed its black widow nature (Pletsch et al., 2012). Analyzing the Fermi data, we searched and found the orbital modulation signal from the source’s offpulse emission. Below we present the data analysis and results in Section 2. The results are discussed in Section 3.
![[Uncaptioned image]](/html/1502.04783/assets/x1.png)
Folded pulse profile and two-dimensional phaseogram in 32 phase bins obtained for PSR J13113430. The gray scale represents the number of photons in each bin, and the dashed lines mark the onpulse and offpulse phase intervals.
2. Data Analysis and Results
2.1. Fermi LAT data
We selected 0.1–300 GeV LAT events from the Fermi Pass 7 Reprocessed (P7REP) database inside a region centered at the position of PSR J13113430 (Pletsch et al., 2012) during the time period from 2008-08-04 15:43:36 to 2015-01-06 21:19:57 (UTC). Only events with zenith angle less than 100 deg and during good time intervals were kept. The former prevents the Earth’s limb contamination, and for the latter, the quality of the data was not affected by the spacecraft events.
2.2. Timing Analysis
We performed timing analysis to the 0.1–300 GeV LAT data of the PSR J13113430 region to update the -ray ephemeris given in Pletsch et al. (2012). An aperture radius of 10 was used. We determined the pulse time of arrivals (TOAs) by obtaining the pulse profiles of 40 evenly divided segments using the known ephemeris (Pletsch et al., 2012) and cross-correlated them with a template profile created with data during the time period of MJD 54682–56119 (the same time range as that in Pletsch et al. 2012), following the algorithm described in Taylor (1992). We used TEMPO2 (Hobbs et al., 2006; Edwards et al., 2006) to fit the TOAs. Only pulse frequency and frequency derivative were fitted, and the other timing parameters were fixed to their known values. We obtained Hz and s-2, consistent with the values given in Pletsch et al. (2012) within 0.5 and 2.2 uncertainties, respectively. The folded pulse profile and two-dimensional phaseogram are shown in Figure 1. We defined phase 0.16–0.66 and 0.66–1.16 as the onpulse and offpulse phase intervals, respectively.
![[Uncaptioned image]](/html/1502.04783/assets/x2.png)
0.2–300 GeV light curve folded at the orbital period using the offpulse data. The bottom (Phase I) and peak (Phase II) ranges of the modulation are marked. Two simple sinusoid fits are displayed as dashed and dotted curves; for the latter, 0.1 phase shift is forced (see the text in Discussion).
2.3. Maximum Likelihood Analysis
We selected LAT events in 0.1–300 GeV energy range for the likelihood analysis, and included all sources within 20 deg in the Fermi third source catalog (The Fermi-LAT Collaboration, 2015) centered at the position of PSR J13113430 to make the source model. The spectral function forms of the sources are provided in the catalog. The spectral parameters of the sources within 5 deg from PSR J13113430 were set free, and all other parameters of the sources were fixed at their catalog values. The -ray counterpart of PSR J13113430 was modeled with an exponentially cutoff power law, characteristic for pulsars (Abdo et al., 2013), and a simple power law for comparison. In addition, we used the spectrum model gll_iem_v05_rev1.fits and the spectrum file iso_source_v05.txt to consider the Galactic and extragalactic diffuse emission, respectively.
Using the LAT science tools software package v9r33p0, we performed standard binned likelihood analysis to the LAT data. The -ray emission during the total pulse phase interval was detected with a Test Statistic (TS) value of 6279, while that during the onpulse and offpulse phase intervals were detected with TS values of 7723 and 499, respectively. The TS value at a specific position is calculated from TS, where and are the maximum likelihood values for a model without and with an additional source respectively, and approximately is the square of the detection significance for the additional source (Abdo et al., 2010). We found during the total pulse phase, onpulse phase, and offpulse phase intervals, the emission is better modeled by an exponentially cutoff power law, with the low energy cutoff detected with 13, 14, and 5 significance (estimated from , where and are the maximum likelihood values for the exponentially cutoff power-law model and power-law model, respectively; Abdo et al. 2013). The resulting exponentially cutoff power-law fits are summarized in Table 1.
2.4. Orbital Variability
We folded the LAT events of the PSR J13113430 region at its orbital period (Pletsch et al. 2012) to study its possible orbital modulations. The source position given in Pletsch et al. (2012) was used for the barycentric corrections to photon arrival times, and photons within Rmax (Rmax ranges from 01–10 with a step of 01) from the position were collected. Different energy ranges (0.1–300, 0.2–300, 0.3–300, 0.5-300, 1–300 GeV) were tested in folding. No significant modulations were detected using the whole data (i.e., during the total pulse phase), as the largest H-test value was 6 (corresponding to 2 detection significance; de Jager et al. 1989). However, a significant orbital signal was best revealed using the offpulse data in the 0.2 GeV energy range within 04 from PSR J13113430. The folded light curve, which has an H-test value of 22 (corresponding to 4 significance and 3 post-trial significance, for the latter where 50 trials on the energy range and aperture radius are considered), is shown in Figure 2.2. The phase zero is at the ascending node of the pulsar (Pletsch et al., 2012). The folded light curve has a brightness peak around the superior conjunction (when the companion is behind the pulsar), the same as the modest X-ray one reported in Romani (2012). The similarity helps strengthen the -ray modulation detection. Using the LAT tool gtexposure, we checked the summed exposures over the 10 orbital phase bins (e.g., Johnson et al. 2015), and they had only 1% differences, too small to cause any artificial orbital modulations.
We performed likelihood analysis to the 0.2 GeV offpulse LAT events during the orbital phase ranges of 0.2–0.5 (named Phase I) and 0.7–1.0 (named Phase II), which were approximately defined for the bottom and peak of the orbital modulation, respectively. We found that the emission during the both phase ranges is better modeled by an exponentially cutoff power law, with low energy cutoff detected with 3 and 2 significance. The exponentially cutoff power-law fits are summarized in Table 1. The TS values during Phase I and II are 120 and 320 (see Figure 1), respectively, which indicate that the source during the latter is more significantly detected than during the former, confirming the detection of orbital modulation from photon folding.
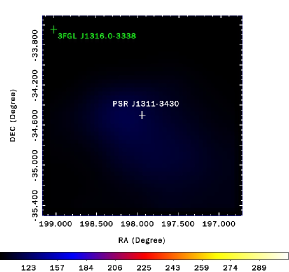
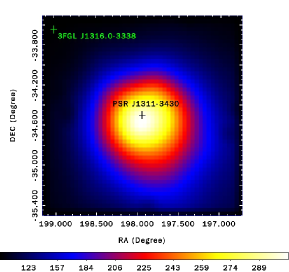
Possible contamination from a nearby catalog source 3FGL J1316.03338, which is identified as the counterpart to the flat spectrum radio quasar (FSRQ) PKS 1313333 (Ackerman et al., 2015), was investigated. This source, being only 12 away from PSR J13113430 and relatively bright (TS625 in the catalog), exhibited flaring events in the past111http://fermi.gsfc.nasa.gov/ssc/data/access/lat/4yr_catalog/ap_lcs.php. Using the offpulse data and performing likelihood analysis, we extracted its 30-day interval light curve, and found that for five time bins (MJD 54863–54923, MJD 55433–55493, MJD 56363-56393), it had fluxes 2 above the value obtained from the total offpulse data. We repeated the analysis by excluding the data of the time bins. We found that the folded light curve is nearly the same, still having an H-test value of 22.
2.5. Spectral Analysis
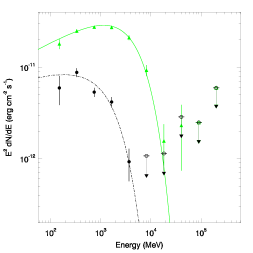
We further investigated the orbital-dependent spectral variability during the offpulse phase interval. Spectra of PSR J13113430 during the whole offpulse phase interval, Phase I, and Phase II were obtained, and the spectrum during the onpulse phase interval was also obtained for comparison. We extracted the spectra by performing maximum likelihood analysis to the LAT data in 10 evenly divided energy bins in logarithm from 0.1–300 GeV, with the emission of the source being modeled with a power law in each energy bin. We only kept spectral points with TS4, and derived the 95% upper limits in other energy bins. The spectra extracted by this method are less model-dependent and provide a detailed description of the -ray emission for the source.
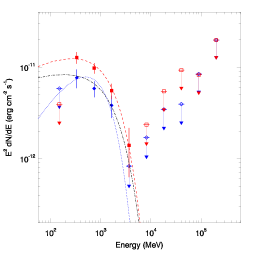
The obtained spectra are shown in Figure 2. The onpulse emission appears to have a 3-times higher cutoff energy than the offpulse one (see also Table 1). In addition, comparing the two offpulse spectra, the source was brighter across the 0.2 GeV energy range during Phase II than during Phase I.
We also repeated the analysis by excluding the data when the nearby source 3FGL J1316.03338 had possible flares (see § 2.4). The obtained spectral parameters of PSR J13113430 during the two orbital-phase ranges are consistent with the values obtained above (within 1 uncertainties). We concluded that the flares do not have any significant effect on our spectral analysis. However, we note that in the lowest energy bin, the two upper limits of the Phase I and II spectra (see the right panel of Figure 2) are lower than the exponentially cutoff power-law fits. This problem might be due to possible contamination from 3FGL J1316.03338 in the low-energy range.
3. Discussion
From our analysis of the Fermi data of PSR J13113430, we have detected its -ray orbital modulation during the offpulse phase interval of the pulsar, where the magnetospheric emission from the pulsar was likely effectively removed. In both optical and X-ray observations, flares were detected (Romani, 2012), indicating the strong interaction between the pulsar wind and the companion. Likely -rays are also produced due to the intrabinary interaction. However, different from that is seen in PSR B195720, which has an extra component above 2.7 GeV at its inferior conjunction (when the companion is in front of the pulsar), the light curve peak is near the superior conjunction for PSR J13113430. The difference suggests that the intrabinary -ray emission model, which explains the extra component as the result from viewing an inverse Compton process as a head-on collision (see also Bednarek (2014)), proposed in Wu et al. (2012) does not apply here.
For PSR J13113430, no significant spectral changes were found from the offpulse orbital-phase–resolved spectra (Figure 2). The source appeared brighter across the 0.2 GeV energy range during the peak range (Phase II) than during the bottom range (Phase I). Although the uncertainties from our fits with the exponentially cutoff power law are relatively large, the two spectra are generally similar to each other. The similarity suggests an geometric origin for the orbital modulation, such as that used to explain the X-ray orbital modulation of PSR J1023+0038 (Bogdanov et al., 2011). The binary likely has an inclination angle of 60°, and the companion has a very small Roche lobe radius (a canonical neutron star mass is assumed). Therefore like in PSR J1023+0038, the intrabinary emission region must be very close to the companion and the companion can thus block part of the region, causing the observed orbital modulation. Here we simply assume that the region is at the inner surface of the companion, and use a function to describe the orbital modulation, where is the orbital phase, is fixed, and and are the modulation amplitude (in units of counts) and constant counts, respectively. Fitting the folded light curve, we found this function can describe the modulation (see Figure 2.2), where the minimum (for 8 degrees of freedom) and , . However, examining the light curve, the minimum and maximum may have a 0.1 phase shift (i.e., they occur at phase 0.35 and 0.85, respectively). If we force such a shift, the results are (for 8 degrees of freedom) and , , indeed slightly better. This shift may suggest that the emission is not isotropic. The constant part may represent the intrabinary emission unblocked by the companion over the whole orbital phase, while emission from the pulsar during its offpulse phase interval could also contribute a small fraction.
It is not clear why PSR J13113430 has an orbital modulation different from that of PSR B1957+20. We note that if the size of the interaction region is proportional to that of a companion, similar fractions of an isotropic pulsar wind (0.0021 vs. 0.0024) would be intercepted for PSR J13113430 and PSR B1957+20 respectively (estimated from ; is the radius of the companion and is the separation distance of the binary). The notable differences are that the spin-down luminosity of PSR J13113430 is approximately 1/3 of PSR B1957+20 and that the companion in PSR J13113430 nearly fills its Roche lobe (Romani et al., 2012). We suspect that because of the latter, an outflow from the companion may still exist, the same as that in PSR J1023+0038 (e.g., Bogdanov et al. 2011). For PSR B1957+20, its companion fills its Roche lobe (Reynolds et al., 2007), and the mass loss from the companion is presumably driven by the pulsar wind (Arons & Tavani 1993 and references therein). The much more messy environment in PSR J13113430, as suggested by the radio observations (Ray et al., 2013), could be evidence for this possibility. Detailed modeling for physical processes in PSR J13113430 would help verify it.
Our discovery of the orbital -ray modulation in PSR J13113430 and the analysis results have provided clear evidence for -ray production due to intrabinary interaction between a pulsar and its companion in a black widow system, and thus have confirmed the general physical picture that has long been proposed theoretically. Since X-ray observations have revealed the general existence of intrabinary shock emission in eclipsing MSP binaries, similar work can be carried out to search and study related -ray emission from these recently identified systems.
References
- Abdo et al. (2010) Abdo, A. A., et al. 2010, ApJS, 188, 405
- Abdo et al. (2013) —. 2013, ApJS, 208, 17
- Ackerman et al. (2015) Ackerman, M., Ajello, M., Atwood, W., et al. 2015, ArXiv:1501.06054
- Alpar et al. (1982) Alpar, M. A., Cheng, A. F., Ruderman, M. A., & Shaham, J. 1982, Nature, 300, 728
- Archibald et al. (2010) Archibald, A. M., Kaspi, V. M., Bogdanov, S., Hessels, J. W. T., Stairs, I. H., Ransom, S. M., & McLaughlin, M. A. 2010, ApJ, 722, 88
- Arons & Tavani (1993) Arons, J., & Tavani, M. 1993, ApJ, 403, 249
- Bednarek (2014) Bednarek, W. 2014, A&A, 561, A116
- Bogdanov et al. (2011) Bogdanov, S., Archibald, A. M., Hessels, J. W. T., Kaspi, V. M., Lorimer, D., McLaughlin, M. A., Ransom, S. M., & Stairs, I. H. 2011, ApJ, 742, 97
- Bogdanov et al. (2014) Bogdanov, S., Patruno, A., Archibald, A. M., Bassa, C., Hessels, J. W. T., Janssen, G. H., & Stappers, B. W. 2014, ApJ, 789, 40
- de Jager et al. (1989) de Jager, O. C., Raubenheimer, B. C., & Swanepoel, J. W. H. 1989, A&A, 221, 180
- Edwards et al. (2006) Edwards, R. T., Hobbs, G. B., & Manchester, R. N. 2006, MNRAS, 372, 1549
- Fruchter et al. (1988) Fruchter, A. S., Stinebring, D. R., & Taylor, J. H. 1988, Nature, 333, 237
- Gentile et al. (2014) Gentile, P. A., et al. 2014, ApJ, 783, 69
- Hobbs et al. (2006) Hobbs, G. B., Edwards, R. T., & Manchester, R. N. 2006, MNRAS, 369, 655
- Huang et al. (2012) Huang, R. H. H., Kong, A. K. H., Takata, J., Hui, C. Y., Lin, L. C. C., & Cheng, K. S. 2012, ApJ, 760, 92
- Kataoka et al. (2012) Kataoka, J., et al. 2012, ApJ, 757, 176
- Manchester et al. (2005) Manchester, R. N., Hobbs, G. B., Teoh, A., & Hobbs, M. 2005, AJ, 129, 1993
- Nolan et al. (2012) Nolan, P. L., et al. 2012, ApJS, 199, 31
- Pletsch et al. (2012) Pletsch, H. J., et al. 2012, Science, 338, 1314
- Radhakrishnan & Srinivasan (1982) Radhakrishnan, V., & Srinivasan, G. 1982, Current Science, 51, 1096
- Ray et al. (2013) Ray, P. S., et al. 2013, ApJ, 763, L13
- Reynolds et al. (2007) Reynolds, M. T., Callanan, P. J., Fruchter, A. S., Torres, M. A. P., Beer, M. E., & Gibbons, R. A. 2007, MNRAS, 379, 1117
- Roberts (2013) Roberts, M. S. E. 2013, in IAU Symposium, Vol. 291, IAU Symposium, ed. J. van Leeuwen, 127–132
- Roberts et al. (2014) Roberts, M. S. E., Mclaughlin, M. A., Gentile, P., Aliu, E., Hessels, J. W. T., Ransom, S. M., & Ray, P. S. 2014, Astronomische Nachrichten, 335, 313
- Romani (2012) Romani, R. W. 2012, ApJ, 754, L25
- Romani et al. (2012) Romani, R. W., Filippenko, A. V., Silverman, J. M., Cenko, S. B., Greiner, J., Rau, A., Elliott, J., & Pletsch, H. J. 2012, ApJ, 760, L36
- Johnson et al. (2015) Johnson, T. J., Ray, P. S., Roy, J., Cheung, C. C., Harding, A. K., Pletsch, H. J., Fort, S., Camilo, F., Deneva, J., Bhattacharyya, B., Stappers, B. W. 2015, ArXiv:1502.06862
- Taylor (1992) Taylor, J. H. 1992, Royal Society of London Philosophical Transactions Series A, 341, 117
- The Fermi-LAT Collaboration (2015) The Fermi-LAT Collaboration. 2015, ArXiv e-prints
- Wu et al. (2012) Wu, E. M. H., Takata, J., Cheng, K. S., Huang, R. H. H., Hui, C. Y., Kong, A. K. H., Tam, P. H. T., & Wu, J. H. K. 2012, ApJ, 761, 181
- Xing & Wang (2014) Xing, Y., & Wang, Z. 2014, ArXiv e-prints
- Xing et al. (2014) Xing, Y., Wang, Z., & Ng, C.-Y. 2014, ApJ, 795, 88
| Data set | 0.1 GeV Flux | Ec | TS | |
|---|---|---|---|---|
| (10-8 photon cm-2 s-1) | (GeV) | |||
| Total data | 8.9 0.4 | 1.80 0.04 | 4.0 0.5 | 6279 |
| Onpulse data | 13.9 0.6 | 1.71 0.04 | 3.9 0.4 | 7723 |
| Offpulse data | 4.6 0.6 | 1.9 0.2 | 1.3 0.4 | 499 |
| Offpulse Phase I | 3 1 | 1.2 0.7 | 0.6 0.3 | 120 |
| Offpulse Phase II | 7 2 | 1.8 0.5 | 1.2 0.9 | 320 |
Note. — Column 3 and 4 list the photon index and cutoff energy of the exponentially cutoff power-law model.