Temporal properties of bright BGO GRBs detected by Fermi
Abstract
We present results of an analysis of a sample of bright Gamma-Ray Bursts (GRBs) detected by Fermi-GBM up to more than 1 MeV, which were collected during six years of Fermi operations. In particular, we focus on the GRB durations over several energy bands of the prompt emission of a subsample of bright GRBs detected up to 10 MeV by GBM and, when possible, up to 1 GeV by Fermi-LAT, thus expanding the Duration–Energy relationship in GRB light curves to high energies for the first time. We find that the relationship for these energetic GRBs is flatter than reported for other samples, suggesting that the high– and low–energy emission mechanisms are closely related.
I Fermi GBM and LAT instruments
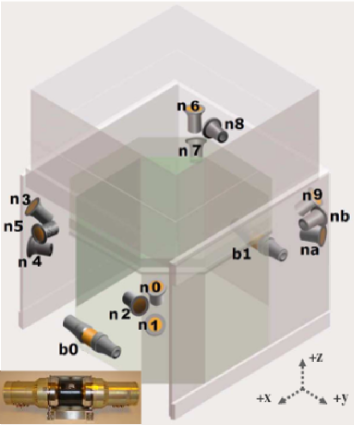
The Fermi satellite has been observing the gamma–ray sky since its launch in June 2008. It carries on–board two instruments: the Gamma-ray Burst Monitor (GBM) and the Large Area Telescope (LAT). GBM consists of 12 Sodium Iodide (NaI, 8–900 keV) and 2 Bismuth Germanate (BGO, 200 keV–40 MeV) scintillation detectors MEE09 . Figure 1 shows the placement and orientation of the detectors on the spacecraft, which allow GBM to have a Field-of-View (FoV) as large as the full unocculted sky. GBM detects 250 GRBs per year VON14 .
The LAT instruments include a Tracker-Converter, a Calorimeter and an Anti–Coincidence Detector ATW09 . The LAT standard analysis covers an energy range of 100 MeV–300 GeV. Thanks to the LAT Low Energy (LLE) technique PEL10 , this coverage is extended down to 10 MeV. 35 GRBs were observed by LAT during the first 3 years of operation ACK13 , but many more are expected to be found thanks to a new analysis algorithm VIA14 and to the newly implemented LAT event reconstruction Pass 8 ATW13 .
 |
 |
 |
 |
|
II Sample selection criteria
We follow the same approach as in RIC96 for the BATSE bright GRBs and in BIS11 for the GBM BGO bright GRBs collected over the first year of operation. Here we extend the previous analysis to six years of GBM data (from August 2008 to July 2014).
The first coarser selection is based on the analysis of the GBM telemetry packets. Bursts showing an increase of more than 80 counts/s over background in at least one BGO detector over the full BGO energy range are selected. The second finer selection is based on the analysis of the count rate excess above background measured by the BGO detector(s) in the 500 keV–1 MeV range during the main burst emission episode. We analyse the GBM TTE files (see MEE09 for GBM data type description) over four different timescales (64, 128, 256, and 512 ms). Bursts with a 4 detection are selected.
The final sample of bright BGO GRBs includes 311 bursts, of which 68 are short and 243 are long ones. We repeat the same procedure on three other BGO energy ranges, namely 1–2 MeV, 2–5 MeV, and 5–10 MeV, and check for the detection significance.
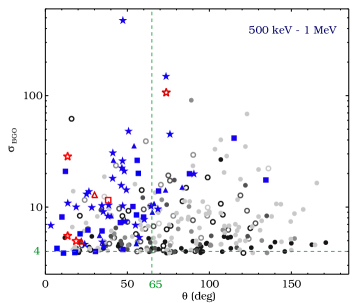
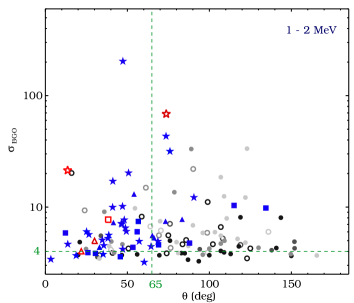
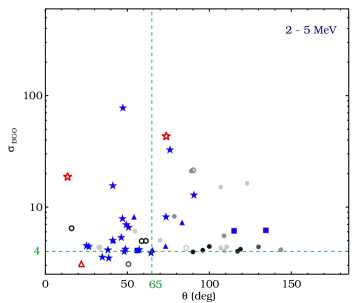
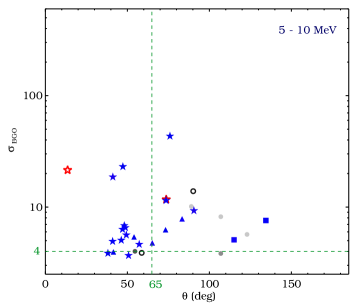
In Figure 4 we plot these significances calculated in the four BGO energy bands as a function of the LAT boresight angle . The dashed vertical line indicates the LAT FoV at . GBM-only detections are marked as gray circles. Filled and empty circles represent long and short GRBs. 69 bursts from our sample are also detected by the LAT PUBtab : 58 GRBs are detected with the standard likelihood analysis above 100 MeV (stars). Out of those, 33 are detected also below 100 MeV with the LLE technique (squares). Moreover, there are 11 bursts which are detected only with LLE analysis (triangles). Long-duration GRBs are plotted with blue symbols and short GRBs are plotted in red.
 |
 |
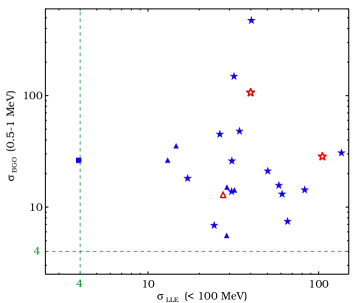
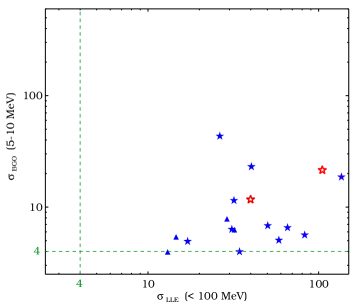
In these proceedings we want to focus only on the brightest events of our sample according to two criteria: (a) the BGO detection significance in the 500–1000 keV energy band, combined with the significance in the 5–10 MeV energy; and (b) the LLE detection significance in the 10 MeV – 1 GeV energy range. The latter is calculated by means of an algorithm presented in Section 3.3.1 of ACK13 and specifically designed for LLE source detection. The LLE data presented in this analysis are produced from Pass 8 data.
If we independently select the 20 brightest events with both criteria, we end up with a subsample of 27 GRBs, which are listed in Table 2. There are 21 long and 6 short GRBs in this new subsample. In the table we specify the GRB name (column 1), the GBM trigger number and trigger time in Mission Elapsed Time (MET, columns 2 and 3), the angle to the LAT boresight (column 4), the GBM duration () calculated in the 50–300 keV energy band and reported by VON14 (column 5), the BGO and NaI detectors used for the temporal analysis (columns 6 and 7), and the detection significances in two BGO (columns 8 and 9) and in the LLE energy range (column 10).
II.1 Energy dispersion analysis
In order to select the best energy bands for the temporal analysis, we first want to study the effect of energy dispersion (E) in NaI and BGO data by means of simulations. We randomly choose 15 GRBs from the latest GBM spectral catalog GRU13 and use the best model to simulate their spectra with XSPECXSPEC . Finally, we compare the model predicted rates with the measured and simulated rates overs several NaI and BGO energy ranges.
| Detector | Energy bands |
|---|---|
| NaI | 8 –50 keV |
| 50–100 keV | |
| 100–150 keV | |
| 150–300 keV | |
| BGO | 0.3 – 1 MeV |
| 1 – 10 MeV | |
| LLE | 10–100 MeV |
| 100–1000 MeV |
We find that BGO data show an excess count rate in most energy bands (30%), worsening towards high energies (60%). NaI data show a smaller excess in count rates with respect to what is seen in BGOs (20%), but in narrow energy bands below 40 keV we see that E 30%. In order to keep E % in NaI detectors and E % in BGO detectors, we decide to selected the energy bands shown in the Table 1. There are four energy bands covered by NaI detectors, two covered by BGO detectors and two covered by the LLE technique, for a total of eight valid spectral bands for the Duration–Energy relationship analysis.
| GRB | GBM | GBM Trigger | GBM T | BGO | NaI | ||||
| Name | Trigger # | Time (MET) | (Deg.) | (s) | det. | det. | 0.5–1 Mev | 5–10 MeV | 100 MeV |
| 080916C | 080916009 | 243216766.614 | 52.0 | 63.0 0.8 | 0 | 3+4+6 | 7.4 | 6.5 | 65.7 |
| 090227B | 090227772 | 257452263.407 | 72.0 | 1.3 1.0 | 0 | 2+1+0 | 106.6 | 11.7 | 39.9 |
| 090228 | 090228204 | 257489602.911 | 16.0 | 0.45 0.14 | 0 | 0+3+1 | 62.0 | 0.0 | 0.0 |
| 090510 | 090510016 | 263607781.971 | 13.0 | 0.96 0.14 | 1 | 6+7+9 | 28.5 | 21.5 | 105.0 |
| 090902B | 090902462 | 273582310.313 | 51.0 | 19.33 0.29 | 0+1 | 1+0+9 | 48.0 | 4.0 | 34.3 |
| 090926A | 090926181 | 275631628.987 | 48.0 | 13.76 0.29 | 1+0 | 7+6+3 | 21.1 | 6.8 | 50.3 |
| 100116A | 100116897 | 285370262.242 | 29.0 | 102.5 1.5 | 0 | 0+3+1 | 13.8 | 0.0 | 30.9 |
| 100724B | 100724029 | 301624927.992 | 52.0 | 114.7 3.2 | 0 | 1+0+2 | 14.3 | 5.6 | 82.8 |
| 100826A | 100826957 | 304556304.898 | 71.0 | 85.0 0.7 | 1 | 7+8+6 | 14.2 | 6.3 | 32.1 |
| 101014A | 101014175 | 308722314.622 | 54.0 | 449.4 1.4 | 1 | 7+6+8 | 35.5 | 5.4 | 14.6 |
| 101123A | 101123952 | 312245496.973 | 86.0 | 103.9 0.7 | 1 | 10+9+11 | 15.1 | 7.8 | 29.0 |
| 110328B | 110328520 | 323008161.194 | 31.0 | 141.3 29.8 | 1 | 9+6+0 | 5.6 | 0.0 | 28.9 |
| 110529A | 110529034 | 328322924.872 | 30.0 | 0.51 0.09 | 1 | 9+7+6 | 12.9 | 0.0 | 27.5 |
| 110721A | 110721200 | 332916465.760 | 43.0 | 21.8 0.6 | 1 | 9+6+7 | 30.6 | 18.6 | 135.9 |
| 110731A | 110731465 | 333803371.954 | 6.0 | 7.5 0.6 | 0+1 | 0+3 | 6.9 | 0.0 | 24.4 |
| 120817B | 120817168 | 366868952.723 | 58.8 | 0.11 0.05 | 1 | 7+6+8 | 14.2 | 4.0 | 0.0 |
| 130305A | 130305486 | 384176354.369 | 41.4 | 25.6 1.6 | 1 | 9+6+0 | 26.4 | 4.0 | 13.0 |
| 130310A | 130310840 | 384638984.503 | 75.9 | 16.0 2.6 | 1 | 10+9+11 | 45.1 | 43.4 | 26.3 |
| 130427A | 130427324 | 388741629.420 | 47.1 | 138.2 3.2 | 1 | 9+10+0 | 472.8 | 23.1 | 40.3 |
| 130504B | 130504314 | 389345526.386 | 61.3 | 0.38 0.18 | 0 | 3+4 | 39.0 | 0.0 | 0.0 |
| 130504C | 130504978 | 389402940.518 | 47.5 | 73.2 2.1 | 1+0 | 9+0+1 | 25.9 | 6.3 | 31.0 |
| 130518A | 130518580 | 390578080.525 | 40.9 | 48.6 0.9 | 0+1 | 3+6+7 | 18.1 | 4.9 | 17.1 |
| 131014A | 131014215 | 403420143.202 | 73.2 | 3.20 0.09 | 1 | 9+10+11 | 148.9 | 11.5 | 31.9 |
| 131108A | 131108862 | 405636118.759 | 24.1 | 18.5 0.4 | 1+0 | 6+3+7 | 13.1 | 0.0 | 61.0 |
| 140206B | 140206275 | 413361375.843 | 46.3 | 116.7 4.2 | 0 | 1+0+3 | 15.7 | 5.0 | 58.4 |
| 140306A | 140306146 | 415769387.951 | 54.7 | 67.3 2.6 | 0 | 3+4+0 | 16.1 | 4.0 | 0.0 |
| 140523A | 140523129 | 422507160.625 | 55.8 | 19.2 0.4 | 0 | 3+4+5 | 26.3 | 0.0 | 4.0 |
| (a) Calculated in the 50–300 keV energy band and reported by VON14 . | |||||||||
III Temporal analysis
We select GBM and LLE TTE data usually binned at 8 ms in case of short GRBs and enhance the binning up to 64 ms in case of long GRBs. GBM NaI and BGO detectors are checked for orientation to the trigger () and blockages from the spacecraft. We then select the three most illuminated NaI detectors and one or both BGO detectors (see columns 8 and 9 of Table 2). The GBM energy ranges for the duration analysis are chosen after the careful check for the detector’s energy dispersion presented in Section II.1. The LLE energy range is split into two intervals, namely 10–100 Mev and 100 MeV–1 GeV. Errors on the various durations are computed following the prescriptions by KOS96 . Moreover, systematic errors were computed through an analysis of three random samples of bursts, weak, medium, and bright ones: in each energy band, we changed the various analysis parameters (i.e. burst background and light curve binning selections) and obtained errors of the order of 10–15% in NaI and 20–30% in BGO data. Finally, systematic errors were add to the statistical ones.
 |
 |
 |
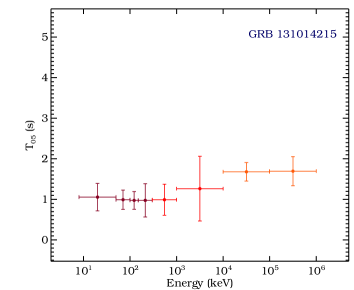 |
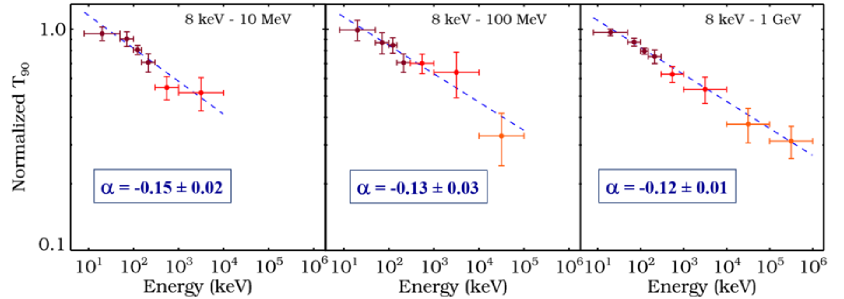
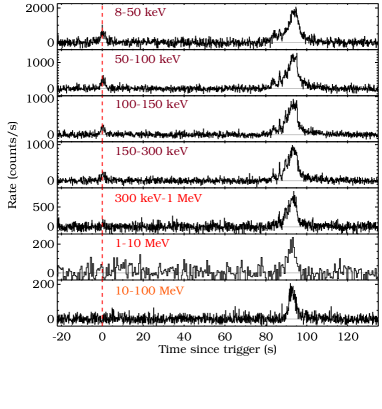
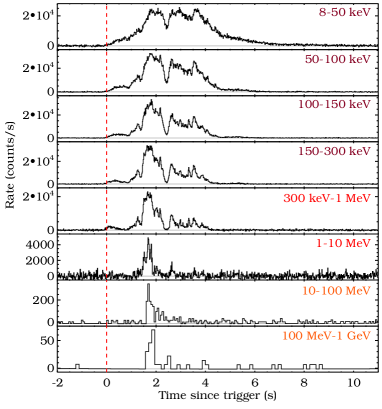
Figure 4 shows two example light curves from GRB 100116A and GRB 131014A. The trigger time is marked with a vertical dashed red line and the energy ranges are labeled in every panel. From the top: the first four panels represent NaI data (dark red labels), the subsequent two panels represent BGO data (red labels) while the last panel(s) represent LLE data (orange labels).
GRB 100116A (left panel) is a rather long GRB, with a two–episode emission, separated by an 80 s long quiescient period. The peak at trigger time disappears at higher energies. GRB 131014A (right panel) is much shorter than GRB 100116A and a delayed start of the high–energy emission is evident. This feature is quite common in LAT-detected bursts (see ACK13 ).
IV Duration–Energy Relation
The burst duration () is calculated by means of IDL–based routines and is defined as 90% of the accumulation time in count space in each energy band. We also calculate , which we define as the beginning of at 5% of counts. Burst durations and values are computed in each energy band previously defined in Table 1.
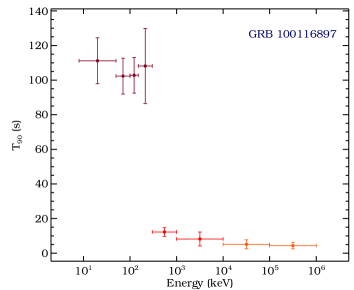
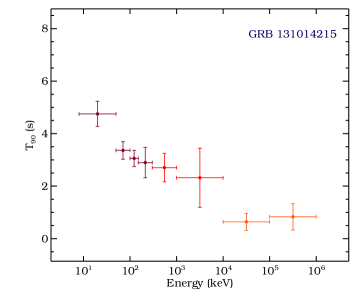
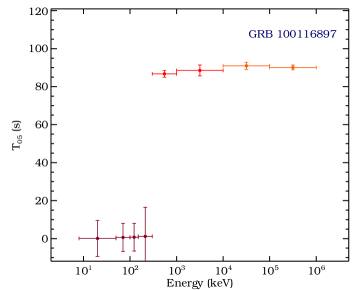
Results for GRB 100116A and GRB 131010A are plotted in Figure 3. The top panels show the Energy–Duration relation, while the bottom panels show the –Energy relation. We adopt different colors for the data points in order to represent the data from different detectors (dark-red: NaI, medium-red: BGO; light-red: LLE) which were used for the analysis in each energy band (as indicated in the labels of Figure 3). In the case of GRB 100116A, the duration drops from s to just few seconds, while GRB 131014A’s duration smoothly decreases from one energy band to the next. This effect is visible also in the vs. Energy plots, where the delayed start of the higher–energy emission in GRB 131014A is clearly visible.
In order to compare and evaluate the whole subsample of 27 bursts, we normalize all measurements and plot them as a function of energy in Figure 6. Again, different colors indicate different detectors used for the temporal analysis. Since not all bursts in the submsample are seen over all energy bands, we plot our results in three panels: 7 GRBs in our subsample are detected only up to 10 MeV, so no LLE duration could be computed (left panel). Other 7 GRBs are detected in LLE but only up to 100 MeV (middle panel), while 13 GRBs are detected all the way up to 1 GeV (right panel).
We fit the data with a simple power law (PL) model (blue dashed lines) in order to compare the slopes of the Duration–Energy relations to what is previously reported in the literature. Results for the PL slope are reported in box in the middle of each panel. RIC96 , using BATSE data from 25 to keV, and more recently BIS11 , using GBM BGO data from 300 keV to 10 MeV, reported values of the PL slope between -0.4 and -0.3. Such values are much steeper then what we find in this analysis. Particularly energetic GRBs showing prompt high–energy emission, i.e. MeV, have a much flatter behavior of the Duration–Energy relation. This possibly indicates that the prompt high–energy emission is closely related to the low–energy one.
V Outlook
Our future analysis steps include (a) The comparison of the PL slope of the Duration–Energy relation deduced from the 27 bright GRBs subsample with the one deduced from the full sample of 311 bright BGO GRBs; The correlation of the Duration–Energy relation parameters with the burst spectral properties; and (c) The study of the temporal properties of pulses using temporally–resolved spectral analysis for the brightest peak of each GRB in the subsample; and (d) The study of the Duration–Energy relation at energies GeV, using the LAT standard analysis. This last step could help determining if the highest–energy emission is in fact afterglow emission shortly following the start of the prompt phase emission as seen at smaller frequencies.
References
- (1) Meegan C., et al., “The Fermi Gamma-Ray Burst Monitor”, ApJ 702, 791M, 2009
- (2) von Kienlin A., et al., “The Second Fermi GBM Gamma-Ray Burst Catalog: The First Four Years”, ApJS 211, 13V, 2014
- (3) Atwood W. B., et al., “The Large Area Telescope on the Fermi Gamma-Ray Space Telescope Mission”, ApJ 697, 1071A, 2009
- (4) Pelassa V., et al., “The LAT Low-Energy technique for Fermi Gamma-Ray Bursts spectral analysis”, Proceedings for the 2009 Fermi Symposium, eConf Proceedings C091122
- (5) Ackermann M., et al., “The First Fermi-LAT Gamma-Ray Burst Catalog”, ApJ 778, 82A, 2013
- (6) Vianello G., Omodei, N., “The First 100 LAT Gamma-Ray Bursts: A New Detection Algorithm and Pass 8”, These Proceedings, eConf C141020.1
- (7) Atwood W. B., et al., “New Fermi-LAT Event Reconstruction Reveals More High-energy Gamma Rays from Gamma-Ray Bursts”, ApJ 774, 76A, 2013
- (8) Richardson G., “Intrinsic dependence of gamma-ray burst durations on energy”, AIPC 384, 87R, 1996
- (9) Bissaldi E., et al., “First-year Results of Broadband Spectroscopy of the Brightest Fermi-GBM Gamma-Ray Bursts”, ApJ 733, 97B, 2011
- (10) Koshut T., et al., “Systematic Effects on Duration Measurements of Gamma-Ray Bursts”, ApJ 463, 570K, 1996
- (11) Fermi LAT GRB Table.
- (12) Gruber D., et al., “The Fermi GBM Gamma-Ray Burst Spectral Catalog: Four Years of Data”, ApJS 211, 12G, 2014
- (13) Arnaud, K. A., 1996, “XSPEC: The First Ten Years”, ASPC 101, 99, 1996