University of Colorado, UCB 389,
Boulder, CO 80309
11email: John.Bally@colorado.edu
\eso ESO Headquarters
Karl-Schwarzschild-Str. 2
85748 Garching bei München, Germany
\msu NSF Astronomy and Astrophysics Postdoctoral Fellow,
Department of Physics and Astronomy,
Michigan State University,
East Lansing, MI 48824
The Orion Fingers: Near-IR Adaptive Optics Imaging of an Explosive Protostellar Outflow
Abstract
Aims. Adaptive optics images are used to test the hypothesis that the explosive BN/KL outflow from the Orion OMC1 cloud core was powered by the dynamical decay of a non-hierarchical system of massive stars.
Methods. Narrow-band , [Fe ii], and broad-band Ks obtained with the Gemini South multi-conjugate adaptive optics (AO) system GeMS and near-infrared imager GSAOI are presented. The images reach resolutions of 0.08 to 0.10″, close to the 0.07″ diffraction limit of the 8-meter telescope at 2.12 . Comparison with previous AO-assisted observations of sub-fields and other ground-based observations enable measurements of proper motions and the investigation of morphological changes in and [Fe ii] features with unprecedented precision. The images are compared with numerical simulations of compact, high-density clumps moving times their own diameter through a lower density medium at Mach .
Results. Several sub-arcsecond features and many [Fe ii] ‘fingertips’ on the projected outskirts of the flow show proper motions of 300 km s-1. High-velocity, sub-arcsecond knots (‘bullets’) are seen as far as 140″ from their suspected ejection site. If these knots propagated through the dense Orion A cloud, their survival sets a lower bound on their densities of order cm-3, consistent with an origin within a few au of a massive star and accelerated by a final multi-body dynamic encounter that ejected the BN object and radio source I from OMC1 about 500 years ago.
Conclusions. Over 120 high-velocity bow-shocks propagating in nearly all directions from the OMC1 cloud core provide evidence for an explosive origin for the BN/KL outflow triggered by the dynamic decay of a non-hierarchical system of massive stars. Such events may be linked to the origin of runaway, massive stars.
Key Words.:
ISM: - molecular clouds – ISM: - shocks, outflows ISM: individual – Orion Nebula, OMC1 stars: formation –1 Introduction
The BN/KL region behind the Orion Nebula, located at a distance of about 414 pc (Menten et al. 2007), contains a spectacular, wide opening-angle, arcminute-scale outflow emerging from the OMC1 cloud core. The flow is traced by the millimeter and sub-millimeter emission lines of molecules such as CO, CS, SO, SO2, and HCN that exhibit broad ( 100 km s-1) emission line wings (Kwan & Scoville 1976; Wiseman & Ho 1996; Furuya & Shinnaga 2009), high-velocity OH, H2O, and SiO maser emission (Genzel et al. 1981; Greenhill et al. 1998), and bright shock-excited ‘fingers’ of and ‘fingertips’ of 1.64 m [Fe ii] emission (Allen & Burton 1993; Colgan et al. 2007; Nissen et al. 2007; Lee & Burton 2000; Bally et al. 2011). The OMC1 outflow has a southeast (red-shifted) to northwest (blue-shifted) axis and contains at least 8 M⊙ of accelerated gas with a median velocity of about 20 km s-1. Interferometric CO images, H2O and the 18 km s-1 SiO masers, and dense-gas tracers such as thermal SiO emission reveal a smaller (8″ long) and younger ( 200 year old) outflow along a northeast-southwest axis emerging from radio source I orthogonal to the arc-minute-scale CO outflow (Beuther & Nissen 2008; Plambeck et al. 2009). The momentum and kinetic energy content of these flows is at least M⊙ km s-1 and ergs (Snell et al. 1984) to ergs (Kwan & Scoville 1976). Zapata et al. (2009) presented a CO J = 2–1 interferometric study and found a dynamic age of about years for the larger OMC1 outflow. They noted that its impulsive nature and its structure is different from accretion-disk powered jets and collimated protostellar outflows, and that it originated several arcseconds north of the OMC1 hot-core.
Radio-frequency astrometry has shown that the three radio-emitting stars in OMC1, sources BN, I, and source n, have proper motions of 25, 13, and 26 km s-1 away from a region less than 500 au in diameter from which they were ejected about 500 years ago (Rodríguez et al. 2005; Gómez et al. 2005, 2008). Although the motions of massive stars BN and source I have been confirmed by many independent measurements of the positions of maser spots and radio continuum emission, the motion of source n has been questioned (Goddi et al. 2011). Determinations of its proper motion may be influenced by intensity variations of its bipolar radio nebula which may shift source n’s emission centroid.
Bally & Zinnecker (2005) proposed that the BN/KL explosion may have been triggered by a massive star merger or the dynamical rearrangement of a nonhierarchical system of massive stars into a hierarchical system that resulted in their ejection from the OMC1 core as high-velocity, runaway stars. In this model, the disruption and ejection of circumstellar disks and envelopes produced the BN/KL outflow. The momentum and kinetic energy of the outflow and ejected stars came from the release of gravitational binding energy of a compact binary formed by the dynamic interaction of three of more stars (Poveda et al. 1967; Gualandris et al. 2004; Perets & Šubr 2012; Reipurth et al. 2010; Reipurth & Mikkola 2012).
Zapata et al. (2009), Bally et al. (2011), and Goddi et al. (2011) found supporting evidence for the dynamical rearrangement model. In this scenario, the final N-body encounter would have resulted in the formation of a compact, au-scale binary, most likely source I , and the ejection of radio source I and BN, and possibly source n. However, it is still possible that additional highly-embedded IR sources will be found in dense cores such as the 1 millimeter source, SMA1 (Beuther & Nissen 2008). Some of these might contain massive stars. After all, radio source I has not yet been directly detected at any infrared wavelength.
Over 30% of massive stars are ejected from their birthplaces at high velocities (Gies & Bolton 1986). A large fraction of such runaway stars are thought to have been produced by the dynamical ejection scenario (Poveda et al. 1967). For example, a dynamical interaction is thought to have ejected the classic runaway stars Columbae and AE Aurigae with velocities of 108 km s-1 and 113 km s-1, respectively, in opposite directions about 2.50.05 Myr ago (Hoogerwerf et al. 2000, 2001; Gualandris et al. 2004). This event left behind the colliding-wind X-ray binary, Orionis, which is the brightest and most massive member of the 5 Myr old NGC 1980 cluster located about 30′ south of the Orion Nebula in the Orion A molecular cloud (Alves & Bouy 2012; Bouy et al. 2014).
Proper motion measurements show that the fastest components in the OMC1 fingers have a dynamic age of about 500 years (Bally et al. 2011). However, Wu et al. (2014) used ALMA observations to argue for a somewhat older dynamic age of 1,300 years for the BN/KL outflow. Bally et al. (2011) found that the and [Fe ii] finger proper motions trace-back to within a few arcseconds of J2000 = 05:35:14.5, 05:22:23 located between the current locations of radio sources I and BN. Gómez et al. (2008) found that in the Orion reference frame, the proper motions of radio sources I, BN, and n intersected within one arcsecond ( 400 au) of J2000 = 05:35:14.360, 05:22:28.70 about 500 years ago, a few arcseconds from the apparent point of outflow origin determined by tracing back the near-infrared proper motions of the fast ejecta.
Tan (2004) proposed an alternative scenario in which the BN object was ejected about 4,000 years ago by a dynamic interaction in the Trapezium cluster located in the center of the Orion Nebula. In this scenario, the OMC1 explosion was triggered by the serendipitous passage of the BN object through the OMC1 core. Although requiring a highly unlikely close encounter of BN with source I in the OMC1 core, Chatterjee & Tan (2012) show that the parameters of the Trapezium and BN are compatible with this scenario.
Though rare, the explosive outflow morphology of the OMC1 BN/KL outflow is not unique; other possible examples include G34.25+0.16 in the inner Galaxy (Cyganowski et al. 2008), source G in W49 (Smith et al. 2009), IRAS 05506+2414 (Sahai et al. 2008), DR21 (Zapata et al. 2013) and possibly the low-luminosity source of the molecular hydrogen outflow MHO 2714 (GGD 34) in NGC 7129 (Eislöffel 2000). However, Orion BN/KL is the nearest and least obscured, and thus most accessible for high-resolution studies. Here, we present 0.08 to 0.1 arc second resolution images of the entire OMC1 outflow complex in the 1.64 m [Fe ii] and 2.12 m narrow-band filters and a broad-band Ks filter obtained with adaptive optics (AO) on the Gemini South 8 meter telescope. This data is combined with older AO-assisted observations obtained on Gemini North and natural seeing-limited images acquired with a variety of other telescope to re-measure proper motions in parts of the BN/KL outflow.
2 Observations
2.1 Gemini South GeMS
The Gemini Multi-conjugate adaptive optics System (GeMS) at the Gemini South telescope on Cerro Pachon is the first and only sodium-based multi-laser guide star (LGS) adaptive optics system (Rigaut et al. 2014, 2012; Neichel et al. 2014, 2013; d’Orgeville et al. 2012). GeMS works with a LGS constellation of 5-spots: 4 of the LGS spots are at the corners of a 60″ square, with the 5-th positioned in the center. The Adaptive Optics (AO) bench called Canopus is mounted on one of the f/16 Cassegrain ports. Gemini South Adaptive Optics Imager (GSAOI) is a wide-field 4096 by 4096 pixel (85″ by 85″ field of view) camera designed to work at the diffraction limit of the 8-meter telescope in the near-infrared. Three 85″ diameter fields were observed in OMC1 between 30 December 2012 and 28 February 2013 using GSAOI. Observations of each field were obtained through 1% bandpass narrow-band filters centered on the 1.644 m [FeII] and 2.122 m H2 emission lines and the broad-band Ks filter. The corrected images have FWHM diameters of 0.08″ to 0.1″, providing the highest angular resolution images of the BN/KL outflow ever obtained in the near-IR.
Each field was imaged in each filter with a 5 point dither pattern to fill-in gaps between the four 2048 by 2048 pixel arrays in GSAOI. Exposure times were 43.4 seconds per exposure for , 43.0 for [Fe II], and 15.0 for Ks. 10 exposures were taken in each filter for a total of 430 seconds on-source in the narrow-band filters and 150 seconds in the continuum filter.
Data were processed with the Gemini GSAOI pipeline. However, additional astrometric corrections were required. Individual exposures were first registered to the Muench et al. (2002) catalog sources to acquire a world coordinate system with RMS pointing error ″. A new catalog of relative star positions was generated from a preliminary aligned and co-added stack of images and used to derive a distortion map for GSAOI. The individual distortion corrected images were re-aligned and co-added to form the final mosaic in each filter.
2.2 Gemini North Altair
Between 2007 and 2009, the Gemini North 8 meter telescope was used to observe the OMC1 region on three occasions using the Altair AO system with the NIRI near-IR camera through 1% narrow-band [Fe ii], , and broad-band Ks filters. NIRI was used in a configuration which delivers a 40″ field of view. In the narrow-band filters, a dithered set of five to ten 30 second exposures were obtained. A similar set of 10 second exposures were acquired in the Ks filter. In 2007, only the ‘ fingers’ region was observed as part of the commissioning of the Altair AO system using the NIRI camera. During 2008 and 2009, we intended to image a 3 4 point grid to cover the full extent of the BN/KL outflow. However, only 5 and 8 fields were actually observed in 2008 and 2009, respectively. Only the ‘ fingers’ field was observed during each of the three years. A summary of the observations is given in Table 1. The angular resolution of the NIRI images ranges from 0.1 to 0.2″.
In the analysis presented here, the NIRI images were registered to the final GSAOI mosaic using IRAF tasks GEOMAP and GEOTRAN applied to unsaturated field stars. Proper motions were determined by marking the photocenters of features on the multi-epoch images. Images of the OMC1 outflow obtained with the Subaru 8 meter telescope on MJD = 51484 in 1999 (Kaifu et al. 2000), the Apache Point Observatory 3.5 meter on MJD = 53331 in 2004 (Bally et al. 2011) were also used. The interval between the Subaru and Gemini south observations is 4,839 days.
3 Results
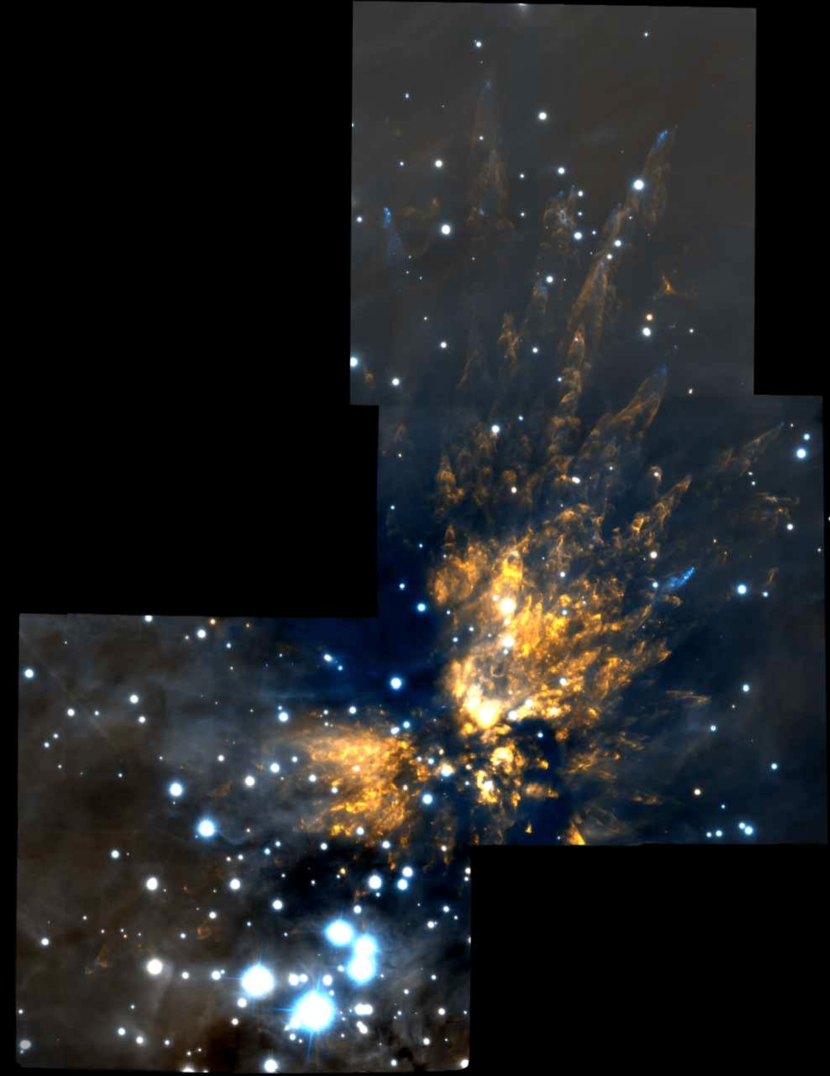
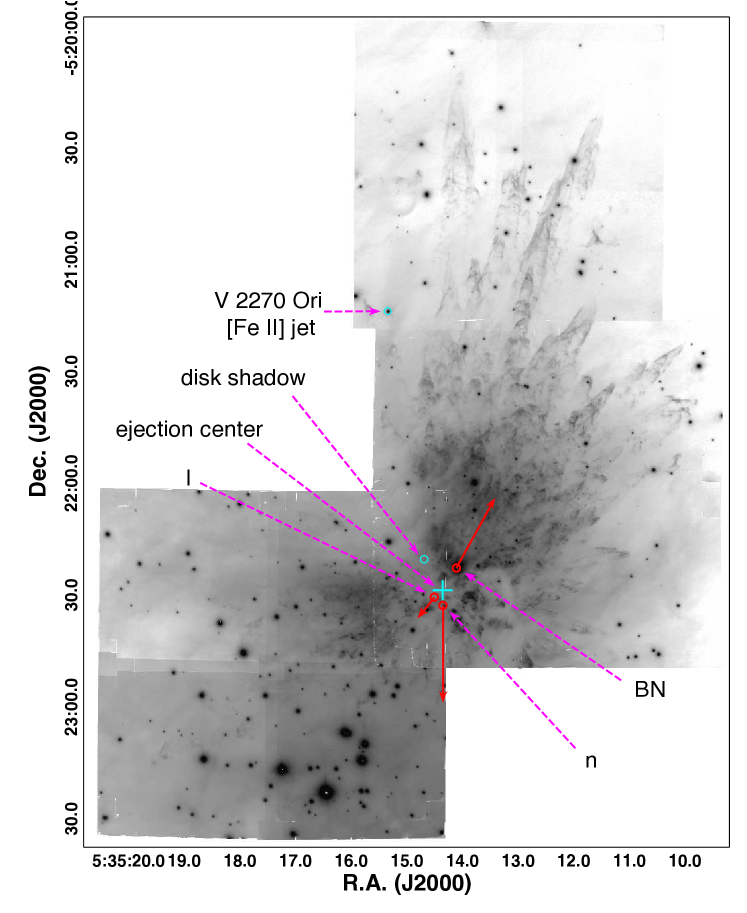
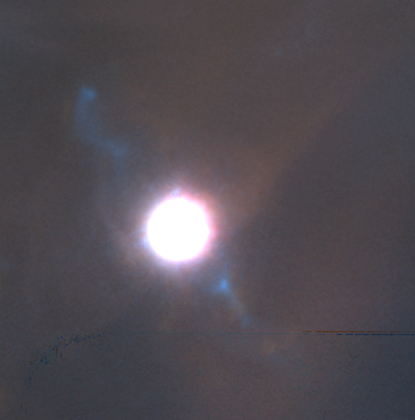
The 2013 epoch GSAOI images presented here reach the near-IR diffraction limit of an 8-meter telescope and provide the sharpest views obtained thus far of the entire OMC1 BN/KL outflow. The combined , [Fe ii], and Ks color image (Figure 1) shows fingers tipped with [Fe ii] emission extending from about 30″ to 140″ from the OMC1 core. For the analysis of dynamic ages for various features, we assume that all features originated from J2000 = 05:35:14.360, 05:22:28.70 (marked with a cyan cross in Figure 2), the suspected location from which the BN object and radio source I were ejected about 500 years ago (Gómez et al. 2008) and within a few arc seconds of the suspected point of origin of the fingers determined from the intersection point of the proper motion vectors (Bally et al. 2011). Figure 2 shows the image with the location of BN, I, an n shown along with their proper motions.
The two brightest [Fe ii] bow shocks correspond to the Herbig-Haro objects HH 201 and HH 210 located 60″ northwest and 113″ north of OMC1 (Gull et al. 1973; Münch & Taylor 1974; Canto et al. 1980; Axon & Taylor 1984). These shocks are visible on ground-based and Hubble Space Telescope images in [O i], H, [N ii] and [S ii]. However, they only exhibit faint emission (Graham et al. 2003), indicating that they lie in the mostly atomic, photon-dominated region (PDR) located between the Orion Nebula’s ionization front and the background Orion A molecular cloud and OMC1 cloud core. The most prominent fingers consist of multiple [Fe ii] finger-tips trailed by wakes with an orientation of PA 340∘ to 350∘. This chain of shocks and wakes extends from about 50″ to 135″ from the ejection center. It consists of at least a dozen nested bow shocks tipped with [Fe ii] emission regions. The brightest [Fe ii] features are visible in the visual-wavelength emission lines commonly seen in Herbig-Haro objects such as [O i], [S ii], [N ii], and H and have been designated as HH 205 through 209. These HH objects are associated with the tips of the chain of wakes propagating toward position angle (PA) 340∘ to 350∘.
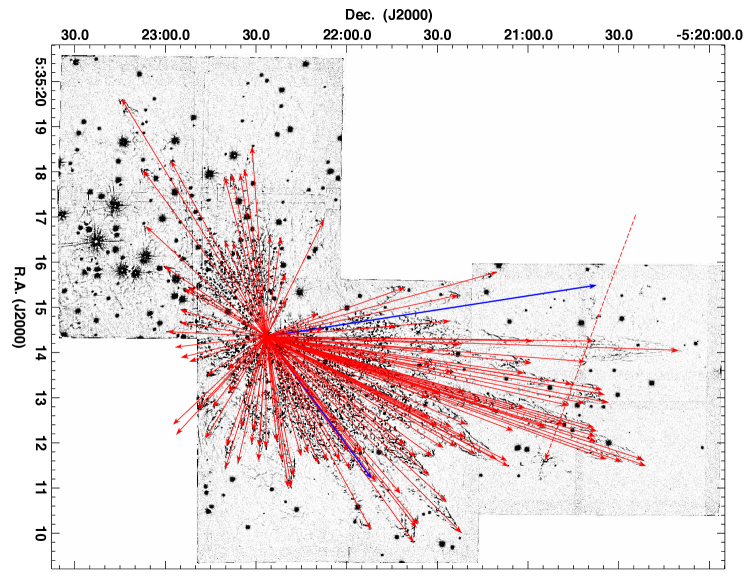
More than 120 distinct wakes are visible in the 2.12 m images that exhibit nearly parallel walls and large proper motions along their axes (Bally et al. 2011). Figure 3 shows a median filtered version of the 2013 GSAOI mosaic created by convolving the image with a 51 pixel kernel (1″; each pixel is 0.02″ on a side) using the IRAF function MEDIAN, and subtracting the result from the original image. Vectors were drawn from the suspected ejection site of radio sources BN and I (the coordinates are given above) to each or [Fe ii] fingertip. The dashed vector near the top marks a chain of knots and bow shocks with proper motions nearly orthogonal to the northern fingers; this feature traces another flow originating east of the imaged field. This flow is also seen faintly at visual wavelengths. The emission becomes too confused within 30″ of the suspected ejection location due to multiple overlapping features. The natural seeing-limited 1999 epoch Subaru telescope image from Kaifu et al. (2000) and the 2005 epoch image from Bally et al. (2011) were used to trace a few additional fingers beyond the boundaries of the GSAOI image in the southwest portion of Figure 3.
In the northwestern part of the flow, the wakes range in diameter from 2″ to 8″ ( to cm) with limb-brightened rims less than 1″ ( cm) wide (Figure 4). The half dozen major finger clusters in the northwest are up to 60″ ( 0.1 pc) long. The wakes in the inner part of the flow are narrower, tend to be shorter, and are more numerous resulting is a high degree of overlap along the line-of-sight. The emission tends to be fainter or disappears near the wake-tips where it is replaced by [Fe ii] emission.
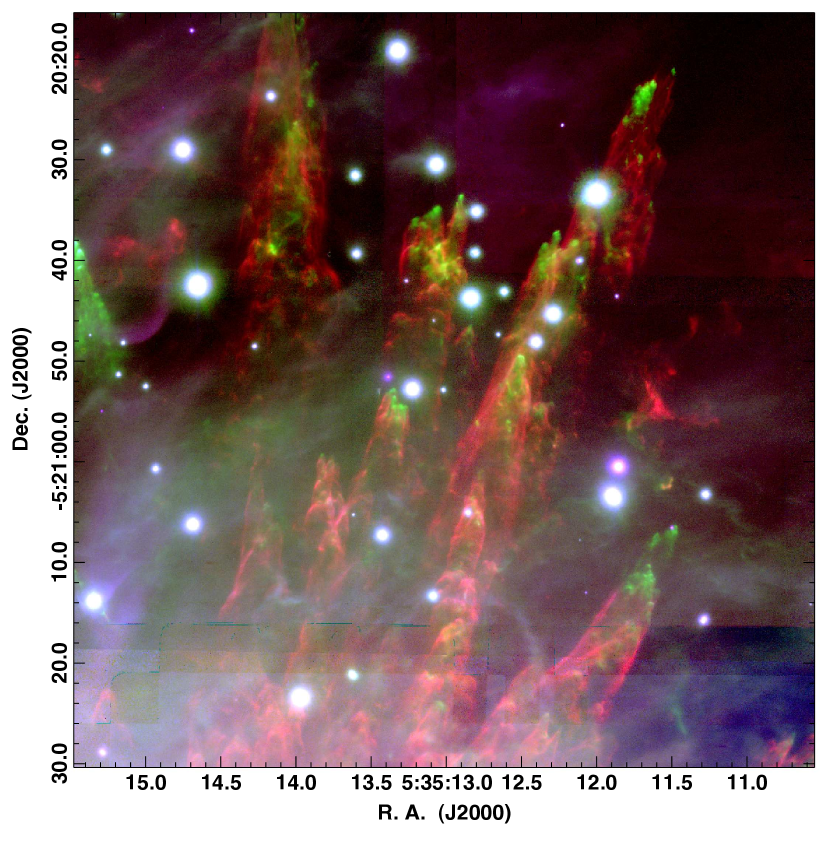
Most of the [Fe ii] emission in the BN/KL outflow originates from the fingertips which are faint or invisible in . Dozens of fingertips are visible in the 1.64 m [Fe ii] line. The two blue vectors in Figure 3 point to the two brightest [Fe ii] features which are also bright in visual wavelength shock-excited emission lines such as [O i] and [S ii] and are designated as HH 201 and 210. These fingertips are very faint in . Figure 4 shows a color version of the ‘ fingers’ region in 2013 from GSAOI showing (red), [Fe ii] (green), and the broadband light in Ks (blue).
3.1 Proper Motions of Selected Knots
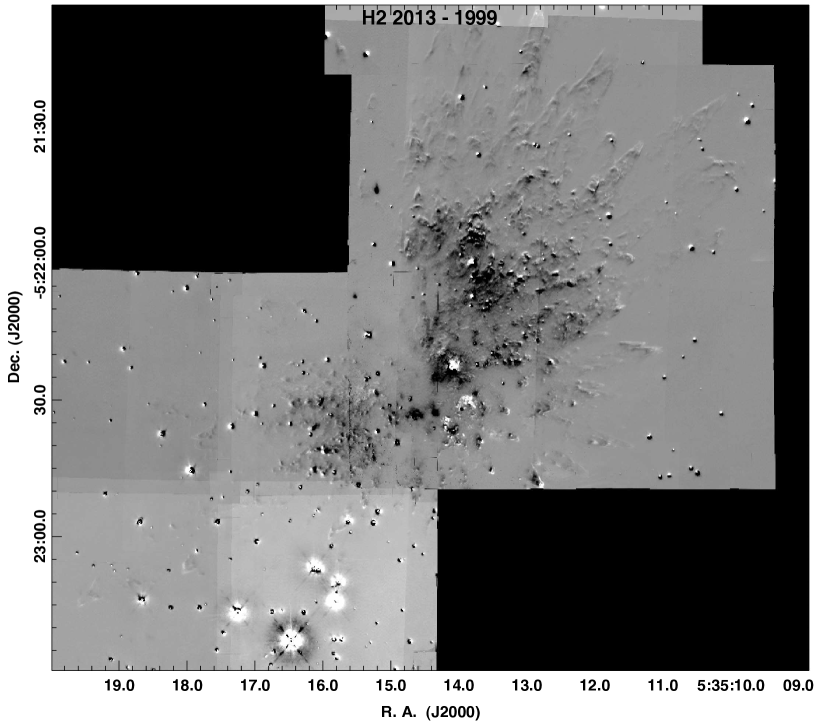
Previous analyses of multi-epoch ground-based images have shown that the highest proper motion knots in the BN/KL outflow are most distant from OMC1 (Jones & Walker 1985; Lee & Burton 2000; Bally et al. 2011). Figure 5 shows a difference image obtained by subtracting the 1999 epoch Subaru image of Kaifu et al. (2000) from our 2013 GSAOI image. Although the registration of the two images is not perfect due to small-scale distortions in the Subaru image (this image was assembled from a mosaic of smaller images), the overall pattern of expansion away from the OMC1 core is obvious.
Comparison of the 2013 epoch images in the sub-field containing the brightest part of the PA 340∘ to 350∘ finger with 2007, 2008, 2009 Gemini North NIRI images show large proper motions of the [Fe ii]-dominated fingertips pointing away from the OMC1 core. This field contains several compact, high velocity knots with sub-arcsecond to arcsecond diameters and proper motions similar to the [Fe ii] fingertips. Additionally, the wakes are expanding at right angles to a line connecting the fingertips to OMC1. The fastest transverse proper motions are found close to the fingertips and decline along the parts of the wake closer to OMC1.
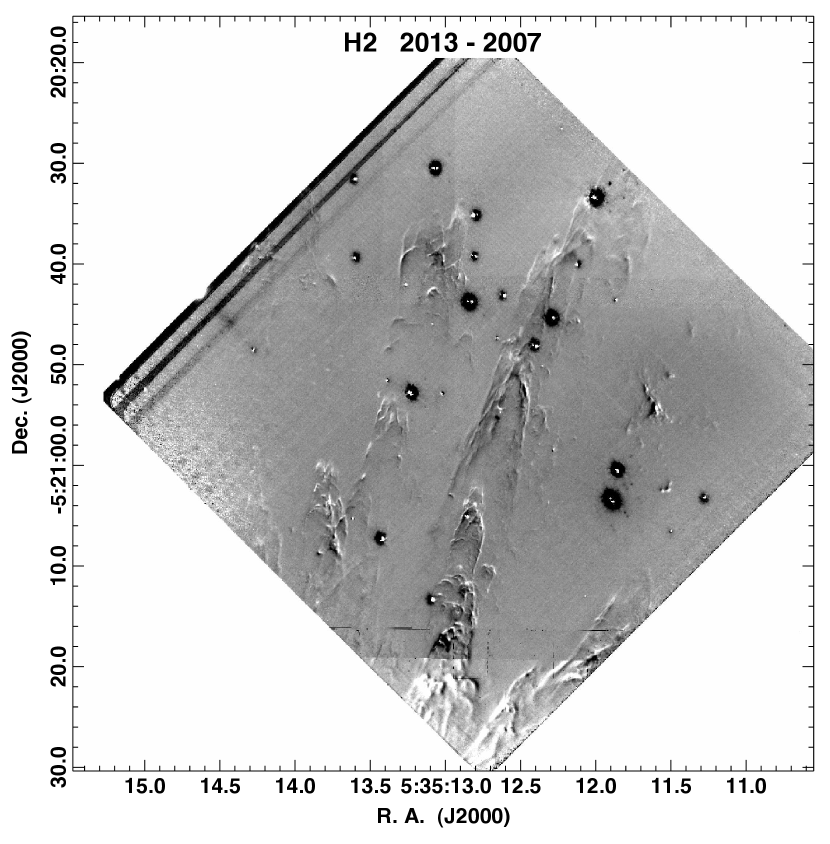
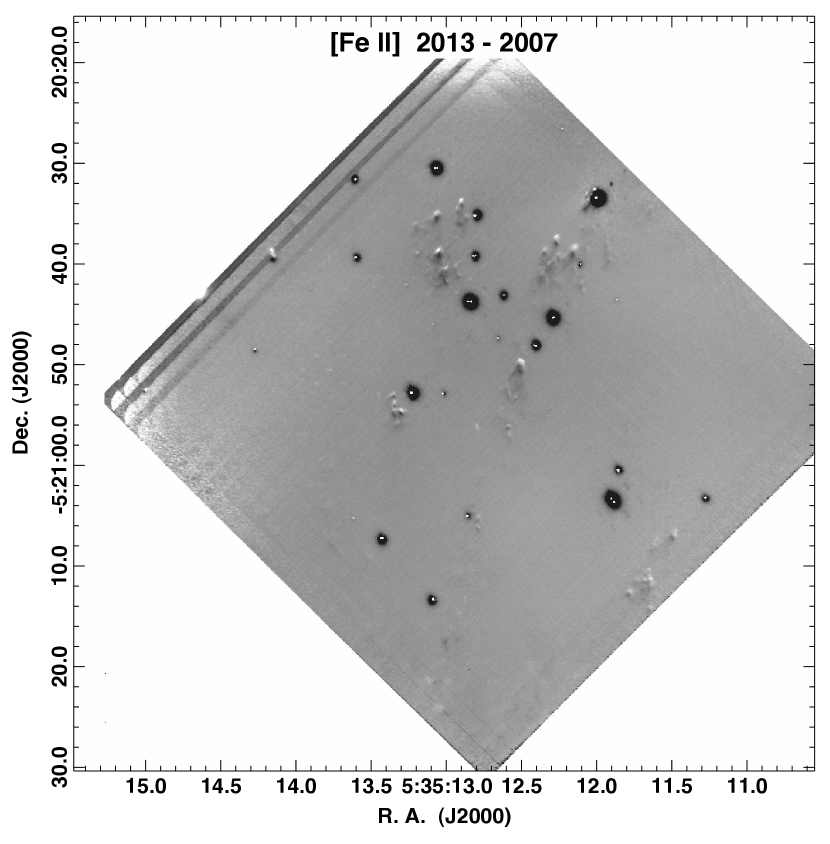
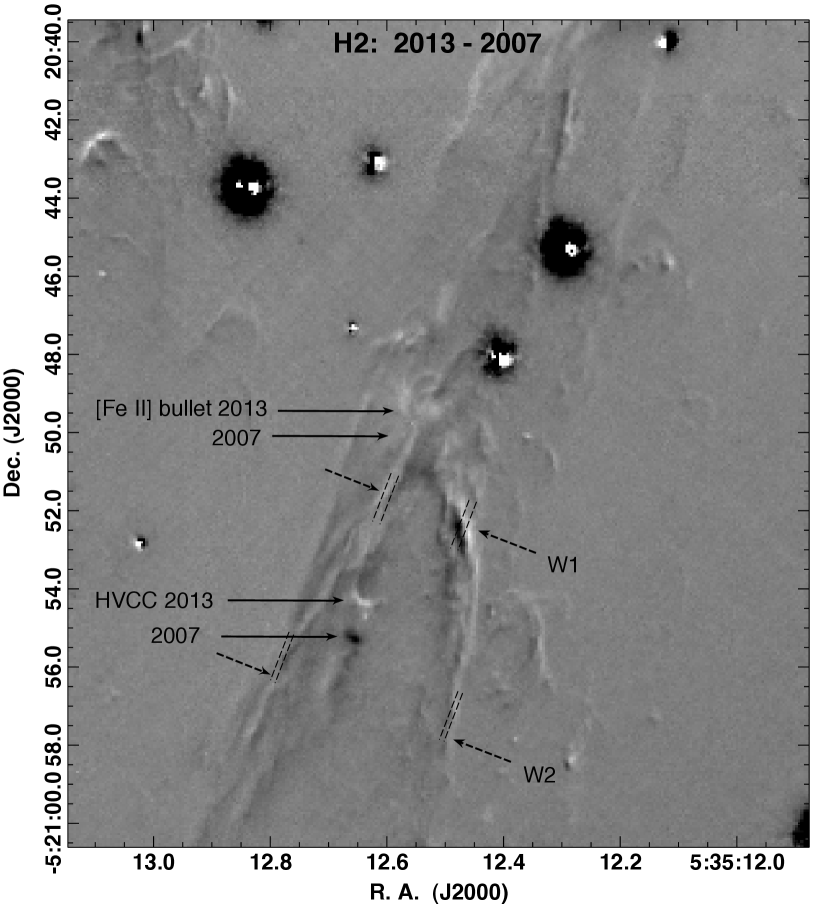
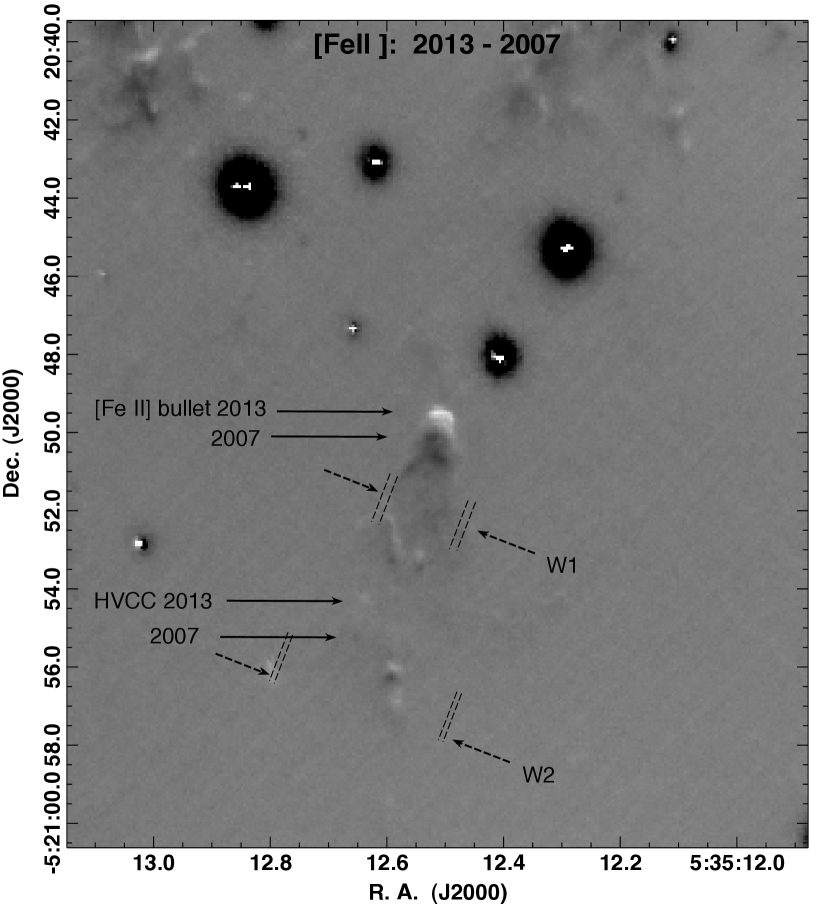
The most reliable proper motions were measured in this field using the AO-assisted images from 2013 and 2007 that are separated by 2,125 days. Figure 4 shows a color composite image of this field. Figures 6 and 7 show difference images in and [Fe ii] formed by subtracting a de-distorted, intensity matched and registered 2013 GSAOI images from the corresponding 2007 NIRI images. Figures 8 and 9 show closeup views of the central part of the field shown in Figures 6 and 7 that contains a bright bow shock. These images show 200 to 300 km s-1 proper motions of the fingertips in both and [Fe ii].
Figure 8 shows that in addition to the large proper motions of the fingertips, the wakes are spreading with velocities ranging from less than 20 to about 80 km s-1 in a direction orthogonal to the motions of the fingertips. The two regions marked W1 and W2 show the locations of slow and fast transverse spreading, respectively. The amount of transverse motion between the two epochs at these two locations are indicated by the closely spaced dashed lines. The spreading velocity decreases with increasing distance from the fingertips. Figure 9 demonstrates that these spreading regions are located behind a fast-moving [Fe ii] bullet whose locations in 2007 and 2013 are indicated.
The closeup images of this region (Figures 6 and 8) show a high-velocity compact clump (HVCC) which exhibits a proper motion of km s-1 over the 6 year ( second) interval between the acquisition of the Gemini North and South images in 2007 and 2013. This HVCC is located at projected distance of 100″ from the current location of source I and dejection = 97″ (0.195 pc) from the suspected location of sources I and BN more than 500 years ago prior to their dynamic ejection. Assuming no deceleration, the dynamic age of this knot is years (see Table 2). Comparison of HST images in [O i] and [S ii] taken on MJD 50170 show that the HVCC is located about 5″ south of HH 207 which is also bright in our [Fe ii] images. In [Fe ii], HH 207 has a proper motion of 229 km s-1 (Table 2). Measured on Hubble Space Telescope images in the visual wavelength range, HH 207 had proper motions of 167 km s-1 in [S ii], 203 km s-1 in H, and 291 km s-1 in [N ii](Doi et al. 2002). Using the velocity difference between the and [Fe ii] proper motions of the HVCC and the [Fe ii] emission associated with HH 207 (68 km s-1) and the current projected separation of 5″ indicates that the HVCC may catch up to the moving [Fe ii] emission region in about 140 years (assuming that they are not displaced along the line of sight).
Figure 8 shows that this HVCC has undergone considerable transverse spreading over the past 6 years. The HVCC is either subject to photometric variations or experiencing significant “sideways splashing” of post-shock material. The morphological evolution of the HVCC suggests that it may have been decelerated significantly from its ejection velocity. Several less-prominent HVCCs exhibit motions of 200 - 300 km s-1. Measured motions of a sample (subset) of fingertips, wakes, and compact, fast knots are given in Table 2.
While the fingertips with 100 to 300 km s-1 motion (best seen in [Fe ii]) are moving along a direction which points directly away from the OMC1 core, the wakes behind each [Fe ii] feature are spreading at right angles to the fingertip proper motions. The wake spreading-velocities tend to decrease with increasing distance behind each fingertip. Within a few arcseconds of the fingertips, some wakes show transverse expansion as fast as 80 km s-1 orthogonal to the wake orientation and proper motion of the fingertip. Spreading speeds decline to under 20 km s-1 (the measurement limit) at distances of more than 10″ to 15″ behind the fingertip.
The transverse spread is consistent with a simple model of a disturbance created by the passage of a high density compact object through the medium as shown below by numerical simulations. Let be the distance from the tip of a finger to the location where the wake half-width (width of the wake divided by 2) and transverse expansion speed are measured. The ratio of the transverse spreading-velocity, (one-half of the velocity with which the two sides of a wake are moving apart) to the fingertip proper motion, , is comparable to the half-width of the wake at a given location, , divided by the distance of that location from the fingertip, . Thus, . Both the fingertip and spreading velocities are highly supersonic.
As shown by previous ground-based measurements, the largest proper motions are seen at the largest projected distance from the OMC1 core and the suspected locations of the BN object and radio source I about 500 years ago. The northwestern fingertips located at the greatest distance from the OMC1 core exhibit the largest proper motions (200 to over 300 km s-1) and tend to show a pattern of increasing maximum velocity with increasing distance from the core. However the region also contains a number of slower-moving features with proper motions ranging from under 100 to about 200 km s-1. It is likely that these features have experienced significant deceleration as they interact with the surrounding medium. The fastest knots and fingertips have dynamic ages consistent with ejection between 450 and 600 years ago.
Doi et al. (2002) measured visual wavelength proper motions for Herbig-Haro (HH) objects protruding into the photon-dominated region (PDR) behind the Orion Nebula. Two of the brightest [Fe ii] features correspond to HH 201 northwest of OMC1 and 210 north of OMC1. Doi et al. (2002) measured proper motions of 312 to 315 km s-1 for various components of HH 201 and and 309 to 425 km s-1 for knots in HH 210. Grosso et al. (2006) detected X-rays from the wake of HH 210, which is the highest proper motion finger in the OMC1 outflow and one of the relatively few visible at visual wavelengths, thereby demonstrating that at least some of the fingers contain hot, X-ray emitting plasma. Additional HH objects are associated with the Orion fingers including HH 205 to 209, and HH 601 to 607 with proper motion velocities ranging from 100 to 300 km s-1 (Doi et al. 2002). All of these features have large negative radial velocities. For example, HH 201 has VLSR 260 to 284 km s-1(Doi et al. 2004).
3.2 Constraints on the ejection mechanism
A number of models have been proposed to explain the [Fe ii] fingers and wakes in the BN/KL outflow. The fingertips contain [Fe ii] knots and bow shocks with diameters of 1″ ( au) or less, estimated by measuring the separation between points where tangent lines on the leading edges of the shock on either side of the tip are at an angle of 90∘ with respect to each other. This dimension is used as an estimator for the size-scale of the material powering each shock which may be the working surface of a jet (Smith & Rosen 2007), a wind which has experienced instabilities (Stone et al. 1995), or a dense bullet (Allen & Burton 1993). The tangent lines become increasingly parallel (greater than 90∘) in the wake. Most of these [Fe ii] bullets and the HVCCs are located more than 100″ from their ejection site.
The individual fingers resemble the shocks produced by accretion-powered jets or collimated flows powered by young stellar objects as they sweep up the ambient medium (Reipurth & Bally 2001). However the presence of many dozens of individual fingers and over 100 shocks with similar dynamic ages moving away from the OMC1 core in all directions suggests that a single, brief event is more likely.
The multitude of fingers and wakes could be powered by a fast wide-angle wind which experienced instabilities and broke into a multitude of protrusions (Stone et al. 1995; McCaughrean & Mac Low 1997). Rayleigh-Taylor (RT) instabilities can produce fingers of fast ejecta surrounded by slower clumps of dense gas if the wind velocity increases with time on a time-scale shorter than the crossing time of the wind in the wind-dominated region. Alternatively, a steady wind running into into a stationary medium with a density profile decreasing faster than can be subject to RT instabilities. Neither an accelerating wind, nor a wind running into a rapidly decreasing density gradient is expected to produce the approximately Hubble-flow type behavior with the maximum velocity of the ejecta increasing linearly with increasing projected distance from the source.
The fingers and wakes may be driven by high-density, compact ejecta (‘bullets’ or HVCCs) as originally suggested by Allen & Burton (1993). Similar bullets have been detected in other astrophysical contexts such as supernova remnants where hydrodynamic and cooling instabilities fragment an expanding stellar envelope (Fesen et al. 2011; Milisavljevic & Fesen 2013).
Assuming the ejection occurred years ago at approximately the location of the BN/KL infrared nebula (Bally & Zinnecker 2005; Zapata et al. 2009; Bally et al. 2011; Goddi et al. 2011), the most distant knots to the northwest provide the most stringent constraints on the ejecta properties. These knots have traveled pc in projection in 500 years. Thus, the time-averaged velocities must be greater than 550 km s-1. For an explosive origin, the fingertip proper motions should increase linearly with increasing distance from the launch region. While a few features have proper motions between 300 and 350 km s-1, most show lower velocities, especially closer to the OMC1 core. Because the faster motions are at least 20% slower than expected for a 500 year-old explosion, the ejecta have either decelerated or were ejected earlier. The absence of faster ejecta in [Fe ii] and could be a consequence of deceleration, an older time of ejection, or a selection effect resulting from excitation conditions in the shocks. [Fe ii] can be in excited into higher ionization stages and may be dissociated above a critical shock speed. Such ultra-fast material should still be revealed by their wakes.
If the bullets originated between radio sources I and BN, they moved between to times their current diameters to their present location. The HVCC shown in Figure 8 had a diameter about about 0.2″ (100 au) in 2007 and traversed a distance of about 100″, about 500 times its own diameter, from the suspected ejection site between sources I and BN. Assuming that they are moving ballistically and not actively powered by jets or winds, momentum conservation requires that such bullets must be 500 times denser than the environment. Such bullets are unlikely to contain sufficient mass to be bound by their self-gravity. They may be confined by ram pressure, otherwise they are likely to be expanding with a speed comparable to their internal sound speeds.
If the bullets were formed from the disruption of circumstellar disks envelopes within tens of au of the massive stars ejected from the OMC1 cloud core, their initial densities are expected to be to cm-3, comparable to the densities of disks and inner envelopes. Following dynamic ejection, bullets are likely to expand with a velocity comparable to their an internal sound speed . In the absence of ram-pressure confinement by the medium the bullet is likely to sweep out a conical region given by the Mach angle, where is the bullet velocity. Using the observed sizes of the compact [Fe ii] and knots (40 to 400 au) and a distance greater than 0.2 pc from the ejection site implies km s-1 consistent with an H2 temperature of K . Although expansion will tend to cool the bullets below the surrounding medium, the intense IR radiation from OMC1 and heating by shock radiation will tend to keep them warm. It is likely that many bullets are moving into regions already shocked, heated, and partially evacuated by faster, previously ejected material. Such clumps will interact with a post-shock medium having a lower-density than the ambient medium, making it more likely for the bullets to be in free-expansion rather than being confined by ram pressure.
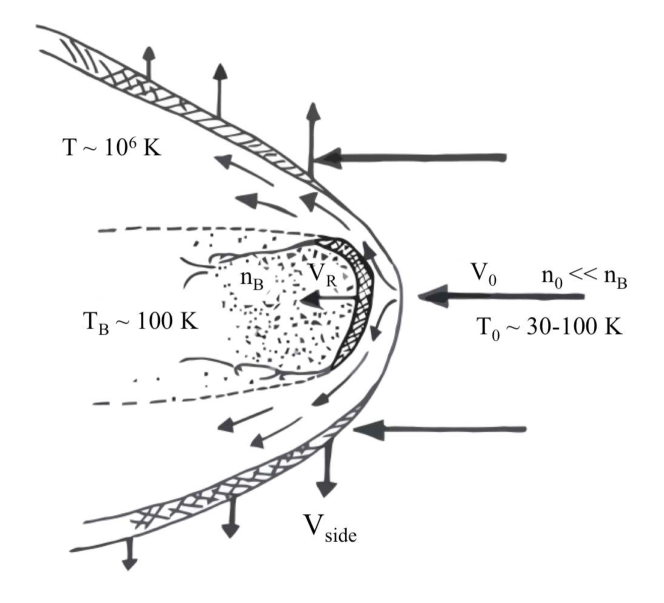
The properties of the wakes constrain the density of the medium into which the suspected HVCCs are moving. The wakes have widths that are an order-of-magnitude wider than the HVCCs and [Fe ii] fingertips (2″ to 10″ with most being near the lower-end of this range). Their formation requires that the heated layer behind the forward shock moving into the ambient medium has a cooling length larger than the clump (or the width of the jet beam) (Blondin et al. 1990). Figure 10 shows a cartoon of a dense bullet moving through a medium. A forward shock-heated ambient medium streams around the moving clump and drives lower-velocity shocks sideways into the ambient medium. A much slower, reverse shock propagates into the clump and compresses its leading edge.
The post-shock temperature immediately behind a shock is given by where is the shock speed. Blondin et al. (1990) give the cooling distance as where is the mean molecular weight of the pre-shocked gas particles, is the cooling function, is the shock velocity in units of 100 km s-1, and is the pre-shock particle density. More recent numerical studies of the cooling function give for km s-1 1,200 km s-1 (Draine 2011). Thus, a = 300 km s-1 shock moving into a density cm-3 has a cooling length cm (470 au). Thus, for ambient medium densities between cm-3 and cm-3 typical for the ‘Integral Shaped Filament’ in the Orion A molecular cloud located behind the Orion Nebula, these cooling lengths correspond to 1.1″ to 11″ at the distance of Orion, and are larger than the HVCCs and [Fe ii] knots.
For a dense HVCC driving a forward shock into the medium with speeds of 150 to 500 km s-1, the hot (1 to 10 MK) plasma will splash sideways to produce a wide bow-shaped wake. In the OMC1 rest frame the 30 to 300 year cooling time corresponds to a wake-length to cm, the latter being comparable to the lengths of fingers in the north and west parts of the OMC1 outflow. The sideway expansion of the hot plasma into the surrounding medium can then drive a slower ( 100 km s-1) side shock. The emission is likely to be produced in the swept-up, compressed, and shock heated layer behind the shock. However, intense UV radiation produced by the shock hot plasma may also excite molecules outside the wake, resulting in fluorescent excitation.
The reverse shock propagating back into a dense bullet will be much weaker than the forward shock owing to the bullet’s higher density. For a forward shock moving into a medium with density with velocity , the speed of the reverse shock moving into the bullet having a density (in the frame of the bullet) is . For a density contrast ratio , the reverse shock propagating back into the bullet will have speed km s-1 for a forward shock speed of 300 km s-1.
3.3 Numerical modeling
We use the Eulerian adaptive mesh refinement (AMR) hydrodynamics + N-body code, Enzo (Bryan et al. 2014) to model the propagation and evolution of bullets and the shocks they produce as they migrate through the ambient. The simulation set up is analogous to that of Silvia et al. (2010, 2012) in which an over-dense, spherical cloud is embedded in a uniform ambient medium. For the simulation presented here, we have assumed an adiabatic equation of state that ignores any effects radiative cooling may have in this scenario. More detailed calculations using a realistic cooling curve for the post-shock gas will be presented in a future paper.
In order to track the largest possible head-tail structure as the cloud is disrupted, without losing information due to flows that might exit the computational domain, we give the ambient medium a uniform velocity such that it washes over the cloud, rather than moving the cloud itself. As the medium flows past the cloud, it drives shocks into the cloud interior and ablates material from the cloud-medium interface – producing a tail of material that is carried downstream. In order to capture the evolution of the cloud over a large physical volume while minimizing the computational cost of the simulation, we use a coarse-resolution root grid with a physical cell size of 78 au per cell and eight levels of adaptive mesh refinement such that the cloud structure is resolved at a peak resolution of 0.3 au per cell. The full computational volume is 7500 2500 2500 au.
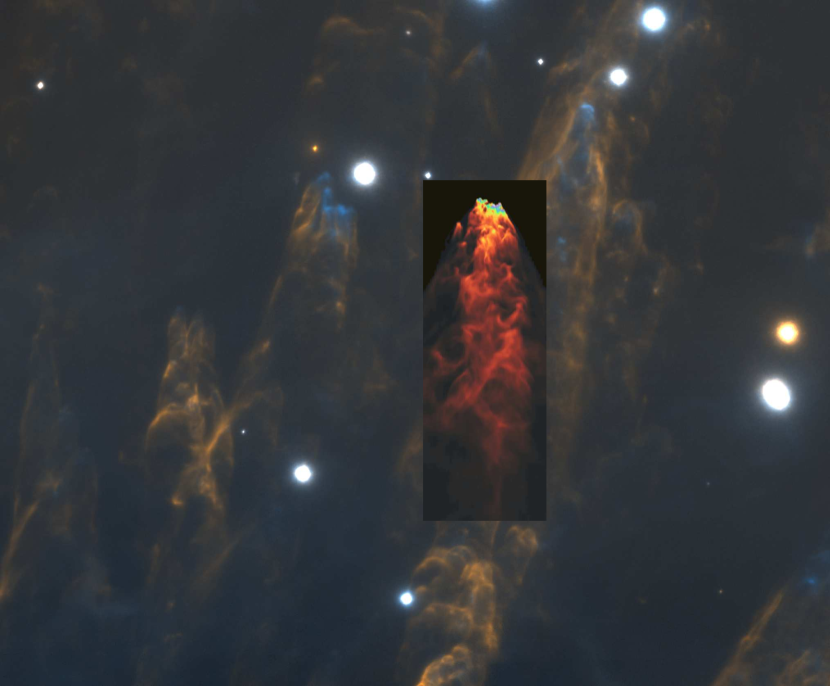
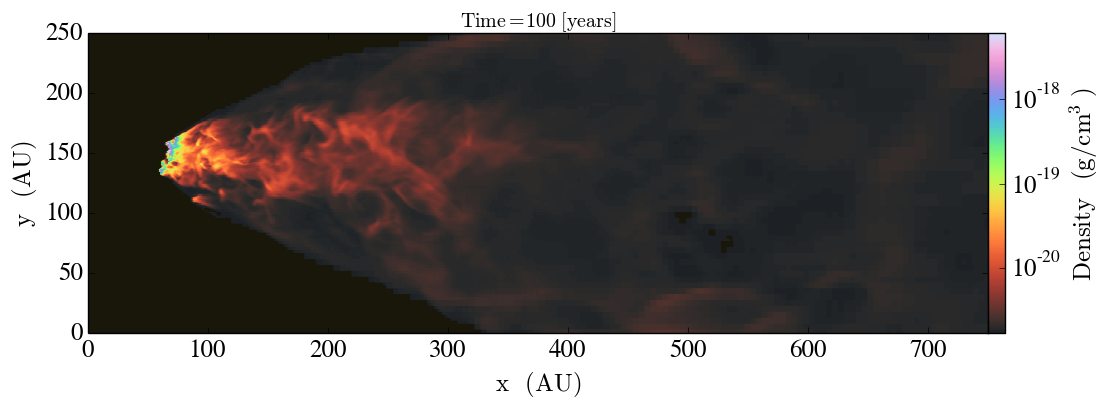
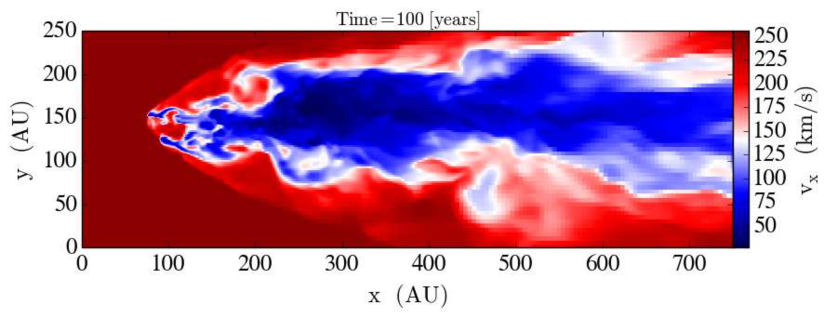
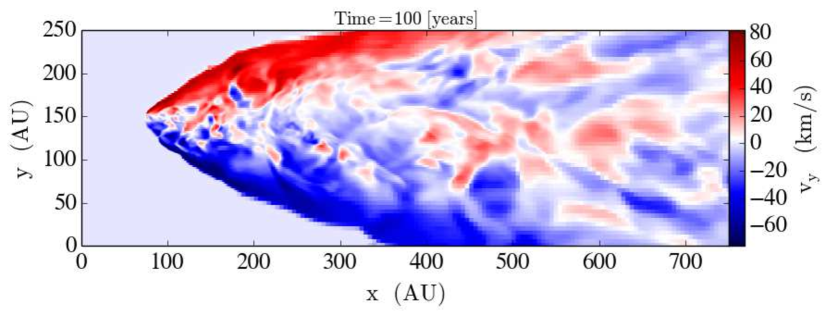
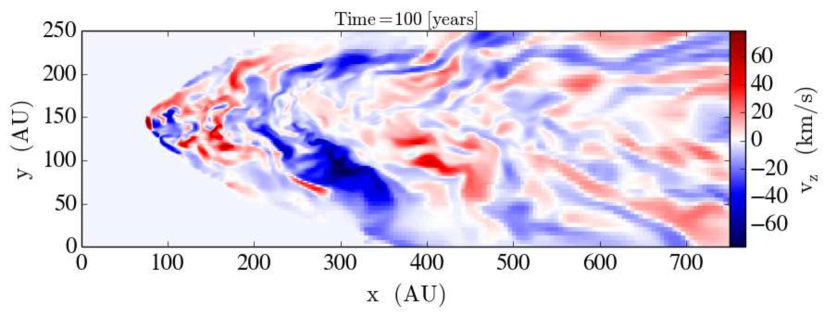
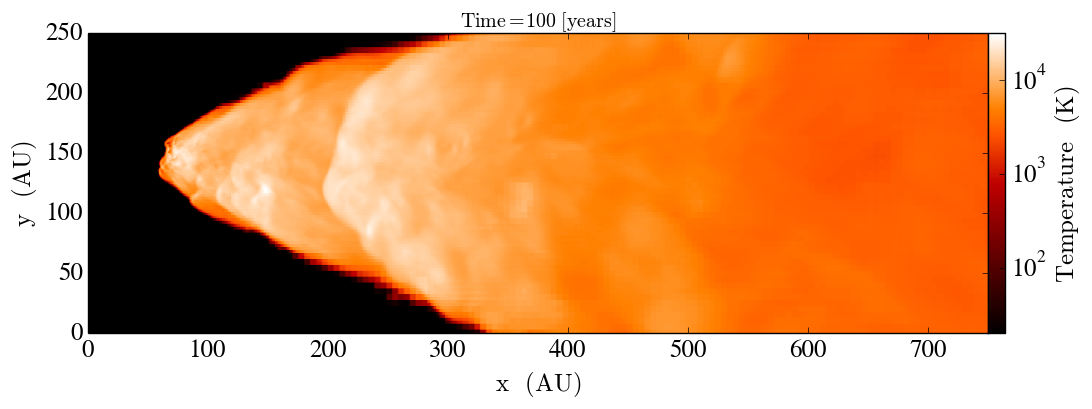
Figure 11 shows a comparison between one of the H2 fingertips and the numerical model showing the density structure of a dense, supersonic cloud that has moved approximately 500 times its initial diameter through a uniform medium. At the start of the simulation, the medium is initialized with a number density of cm-3, a temperature of K, and uniform velocity of km s-1 directed along the -axis of the simulation domain. The cloud is initialized with a density 104 times higher than that of the ambient medium, a temperature of 100 K, and a radius of au.
Figures 12 through 16, made using the yt toolkit (Turk et al. 2011), show the density, ,,-velocity structure, and temperature of the bullet after 100 years of evolution. For this simulation, the initial velocity of the cloud with the respect to the medium is too slow to reach the observed positions given an ejection 500 years ago, but is compatible with an earlier ejection time. Additionally, the simulation shows significant cloud deceleration and disruption in just 120 years following ejection. Together, this indicates that the bullet over-densities are likely to be higher than 104, or that the ISM densities are lower than used in the models. Prior to the dynamic ejection event, the forming stars probably produced accretion-powered outflows which would have carved cavities in the surrounding cloud through with ejecta would be moving. Additionally, some bullets may be propagating through cavities and wakes created by the leading edge of the ejected debris field.
The inclusion of cooling in the post-shock regions will tend to lower the transverse expansion of the shock-heated plasma to produce a narrower wake and a lower sideways splashing velocity. Cooling of the shock-heated layer produced by the slower, reverse shock moving back into the bullet will also tend to result in extensive fragmentation as portions of the cloud rapidly cool and condense – a phenomenon observed in the cloud-crushing simulations of (Silvia et al. 2010, 2012). Such fragments could have considerably longer survival times than the structures present in the simulation presented here. Other physical phenomena not included in this numerical work (e.g. magnetic fields, thermal conduction, plasma viscosity) may also aid in cloud survival. The addition of such physics is left to future work.
3.4 Other YSOs in the field
The line-of-sight to the OMC1 BN/KL outflow contains both lower-mass protostars embedded in or near the OMC1 cloud core, and more mature young stellar objects in the foreground Orion Nebula. Several dozen YSOs fall into the field-of-view presented here. Several of these YSOs drive outflows which can be seen in our images.
The most prominent outflow crosses the northern part of the BN/KL outflow around Declination 05:31 at position angle, PA ∘ to ∘ and indicated by a dashed arrow near the top of Figure 3. Comparison with the [O i] and [S ii] HST images presented by Doi et al. (2002) show that this flow consists of a bow shock located at J2000 = 5:35:06.8, 5:18:27. Doi et al. (2002) label this feature as 115-101 and 115-102 in their Figure 4 where it is shown as part of HH 603 and measured a proper motion toward PA ∘ with a velocity of 70 to 75 km s-1. In the image, a larger but fainter bow shock is located north of 115-101 and 115-102 at J2000 = 5:35:11.6, 5:20:54. In our images, this 2″ radius bow shock shows a proper motion parallel to 115-101 and 115-102 with a velocity of about 70 km s-1. This feature is also faintly seen in the HST [O i] and [S ii] images obtained in 1994. Assuming that the [O i], [S ii], and emission arise from the same region, these images confirm the mostly west-southwest motion. Finally, the [O i] image shows a very faint bow-shaped feature at J2000 = 5:35:08.9, 5:18:10 with a morphology and orientation consistent with the above proper motion vectors. Apparently, this set of three west-facing and west-moving shocks traces an outflow which originates from a yet-to-be identified YSO located northeast of the OMC1 core in the Integral Shaped Filament of dense gas in the Orion A cloud.
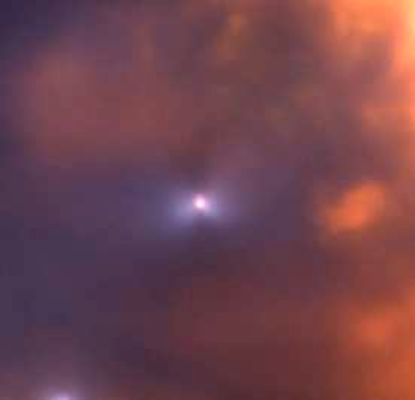
The variable star V2270 Ori (05:35:15.394, 05:21:14.11) located 71″ north of BN along the line-of-sight to the eastern edge of our images drives a bipolar [Fe ii] outflow at PA ∘ (Figure 17). The flow consists of a pair of bow-shaped features 1.5″ southwest and 2.1″ northeast of the star. The southwest portion of the flow forms a jet extending several arc seconds beyond the southwest bow. A curved, less-collimated jet-like feature extends to the northeast. This morphology is reminiscent of a jet produced by coverging flows at the end of a nozzle (Canto & Rodriguez 1980; Canto et al. 1981). Spectra were obtained at the Apache Point Observatory 3.5 meter telescope using the Triplespec spectrometer (these results will be presented fully in a forthcoming paper). These spectra show that the southwestern jet is redshifted with a mean radial velocity of about km s-1 with respect to the rest frame of the Orion Nebula [Fe ii] emission. The northeast lobe of the V2270 [Fe ii] jet is blueshifted with a radial velocity of about km s-1. The velocity changes at the position of the star, indicating that V2270 Ori is the driver of this outflow.
There is a silhouette disk system at 5:35:14.692 5:22:20.36 about 8″ east of BN (Figure 18). It is most evident in the [Fe ii] images, but also seen in the and Ks filters. The arcsecond-scale bipolar nebula perpendicular to the shadow likely traces reflected continuum light from the central star embedded in and shadowed by the nearly edge-on disk. The shadowing occurs at position angle 9∘ implying a disk axis at about 99∘.
4 Conclusions
New images of the OMC1 BN/KL outflow, obtained with the Gemini South MCAO laser guide star adaptive optics system are presented. The images, obtained in the 2.12 m line, the 1.64 m [Fe ii] line, and in a broad-band Ks filter nearly reach the diffraction limit of the 8 meter telescope, about 0.08″. Complete coverage of the outflow’s wakes and [Fe ii] fingertips reveal over 100 individual shocks in unprecedented detail.
These images are combined with 2007 to 2009 epoch images obtained with the Gemini North AO system, Altair, and the near-IR camera NIRI, and earlier epoch natural seeing limited images to measure new proper motions of selected features and to search for morphological changes in the BN/KL outflow.
The observed morphologies of the fingers and wakes are compared with numerical hydrodynamic simulations of a compact, high density bullet moving through a lower density ambient medium with a Mach number of about . The main results of this investigation are:
-
•
Several dozen [Fe ii] bright fingertips and a few sub-arcsecond diameter knots show the highest proper motions. The proper motions are 150 to 300 km s-1 at the projected north end of the outflow complex.
-
•
The survival of in a knot (the HVCC) moving with a proper motion or order 100 km s-1 indicates that it must have a density much higher than the surrounding medium. Over the last 6 years, this feature has shown dramatic morphological changes as it approaches a high velocity [Fe ii] knot located several arcseconds father downstream. The emission from this high-velocity compact clump (HVCC) has spread laterally (orthogonal to its proper motion), expanding from a diameter less than 0.1″ to more than 0.4″, possibly indicating the rapid evolution of the reverse shock moving into the clump
-
•
Many of the wakes show measurable expansion with a velocity of up to 80 km s-1 orthogonal to the proper motions of the fingertips which produce them. The compact structure of the [Fe ii] and emission of the fingertips suggests that they are powered by sub arcsecond to arcsecond scale bullets which have a much greater density than the medium into which they are moving. It is argued that the density in the bullets must be more than three orders-of-magnitude greater than the background density.
-
•
A simple model of bullet propagation is presented in which a fast forward shock produced mega-Kelvin plasma whose cooling length is much longer than the diameter of the bullet. The expansion of this plasma drives shocks into the medium at right angles to the bullet motion to produce 100 km s-1 shock which can sweep up the ambient medium without completely destroying . These sideways shocks driven by the expansion of the shock-heated medium are responsible for the intense emission in the OMC1 BN/KL outflow. The reverse shock moving into the bullets is slow and may excite some detectable emission.
-
•
Preliminary numerical simulations with the Enzo code using an adiabatic equation of state reproduce the observed morphology and kinematics of the fingers. The numerical simulations reproduce the observed sideways splash, the spreading of the post-shock material orthogonal to the propagation of the bullets, and the fragmentation of the leading edge of the high-velocity debris. Further numerical modeling is needed to fine-tune the model parameters to better match the densities and dynamical ages of the observed OMC1 shocks.
Acknowledgments: This research of JB and AG was in part supported by National Science Foundation (NSF) grant AST-1009847. We thank the staff the Gemini South observatory, and in particular the contributions of Rigaut, F., Neichel, B., d’Orgeville, C., Carrasco, R., Michaud, P., and the team responsible for developing and commissioning the Gemini South Adaptive Optics Imager and the multi-conjugate adaptive optics system without which these observations would have been impossible. We thank, Richard (Deno) Stelter for assistance in the initial reduction of the Gemini North NIRI images. Many of the figures were generated with SAOImage ds9. Computing resources for the simulation were provided by the High Performance Computing Center (HPCC) at Michigan State University.
References
- Allen & Burton (1993) Allen, D. A. & Burton, M. G. 1993, Nature, 363, 54
- Alves & Bouy (2012) Alves, J. & Bouy, H. 2012, A&A, 547, A97
- Axon & Taylor (1984) Axon, D. J. & Taylor, K. 1984, MNRAS, 207, 241
- Bally et al. (2011) Bally, J., Cunningham, N. J., Moeckel, N., Burton, M. G., Smith, N., Frank, A., & Nordlund, A. 2011, ApJ, 727, 113
- Bally & Zinnecker (2005) Bally, J. & Zinnecker, H. 2005, AJ, 129, 2281
- Beuther & Nissen (2008) Beuther, H. & Nissen, H. D. 2008, ApJ, 679, L121
- Blondin et al. (1990) Blondin, J. M., Fryxell, B. A., & Konigl, A. 1990, ApJ, 360, 370
- Bouy et al. (2014) Bouy, H., Alves, J., Bertin, E., Sarro, L. M., & Barrado, D. 2014, A&A, 564, A29
- Bryan et al. (2014) Bryan, G. L. et al. 2014, ApJS, 211, 19
- Canto et al. (1980) Canto, J., Goudis, C., Johnson, P. G., & Meaburn, J. 1980, A&A, 85, 128
- Canto & Rodriguez (1980) Canto, J. & Rodriguez, L. F. 1980, ApJ, 239, 982
- Canto et al. (1981) Canto, J., Rodriguez, L. F., Barral, J. F., & Carral, P. 1981, ApJ, 244, 102
- Chatterjee & Tan (2012) Chatterjee, S. & Tan, J. C. 2012, ApJ, 754, 152
- Colgan et al. (2007) Colgan, S. W. J., Schultz, A. S. B., Kaufman, M. J., Erickson, E. F., & Hollenbach, D. J. 2007, ApJ, 671, 536
- Cyganowski et al. (2008) Cyganowski, C. J. et al. 2008, AJ, 136, 2391
- Doi et al. (2002) Doi, T., O’Dell, C. R., & Hartigan, P. 2002, AJ, 124, 445
- Doi et al. (2004) —. 2004, AJ, 127, 3456
- d’Orgeville et al. (2012) d’Orgeville, C. et al. 2012, in Society of Photo-Optical Instrumentation Engineers (SPIE) Conference Series, Vol. 8447, Society of Photo-Optical Instrumentation Engineers (SPIE) Conference Series
- Draine (2011) Draine, B. T. 2011, Physics of the Interstellar and Intergalactic Medium
- Eislöffel (2000) Eislöffel, J. 2000, A&A, 354, 236
- Fesen et al. (2011) Fesen, R. A., Zastrow, J. A., Hammell, M. C., Shull, J. M., & Silvia, D. W. 2011, ApJ, 736, 109
- Furuya & Shinnaga (2009) Furuya, R. S. & Shinnaga, H. 2009, ApJ, 703, 1198
- Genzel et al. (1981) Genzel, R., Reid, M. J., Moran, J. M., & Downes, D. 1981, ApJ, 244, 884
- Gies & Bolton (1986) Gies, D. R. & Bolton, C. T. 1986, ApJS, 61, 419
- Goddi et al. (2011) Goddi, C., Humphreys, E. M. L., Greenhill, L. J., Chandler, C. J., & Matthews, L. D. 2011, ApJ, 728, 15
- Gómez et al. (2008) Gómez, L., Rodríguez, L. F., Loinard, L., Lizano, S., Allen, C., Poveda, A., & Menten, K. M. 2008, ApJ, 685, 333
- Gómez et al. (2005) Gómez, L., RodrÍguez, L. F., Loinard, L., Lizano, S., Poveda, A., & Allen, C. 2005, ApJ, 635, 1166
- Graham et al. (2003) Graham, M. F., Meaburn, J., & Redman, M. P. 2003, MNRAS, 343, 419
- Greenhill et al. (1998) Greenhill, L. J., Gwinn, C. R., Schwartz, C., Moran, J. M., & Diamond, P. J. 1998, Nature, 396, 650
- Grosso et al. (2006) Grosso, N., Feigelson, E. D., Getman, K. V., Kastner, J. H., Bally, J., & McCaughrean, M. J. 2006, A&A, 448, L29
- Gualandris et al. (2004) Gualandris, A., Portegies Zwart, S., & Eggleton, P. P. 2004, MNRAS, 350, 615
- Gull et al. (1973) Gull, T. R., Goad, L., Chiu, H.-Y., Maran, S. P., & Hobbs, R. W. 1973, PASP, 85, 526
- Hoogerwerf et al. (2000) Hoogerwerf, R., de Bruijne, J. H. J., & de Zeeuw, P. T. 2000, ApJ, 544, L133
- Hoogerwerf et al. (2001) —. 2001, A&A, 365, 49
- Jones & Walker (1985) Jones, B. F. & Walker, M. F. 1985, AJ, 90, 1320
- Kaifu et al. (2000) Kaifu, N. et al. 2000, PASJ, 52, 1
- Kwan & Scoville (1976) Kwan, J. & Scoville, N. 1976, ApJ, 210, L39
- Lee & Burton (2000) Lee, J.-K. & Burton, M. G. 2000, MNRAS, 315, 11
- McCaughrean & Mac Low (1997) McCaughrean, M. J. & Mac Low, M.-M. 1997, AJ, 113, 391
- Menten et al. (2007) Menten, K. M., Reid, M. J., Forbrich, J., & Brunthaler, A. 2007, A&A, 474, 515
- Milisavljevic & Fesen (2013) Milisavljevic, D. & Fesen, R. A. 2013, ApJ, 772, 134
- Muench et al. (2002) Muench, A. A., Lada, E. A., Lada, C. J., & Alves, J. 2002, ApJ, 573, 366
- Münch & Taylor (1974) Münch, G. & Taylor, K. 1974, ApJ, 192, L93
- Neichel et al. (2014) Neichel, B. et al. 2014, MNRAS, 440, 1002
- Neichel et al. (2013) Neichel, B. et al. 2013, in Proceedings of the Third AO4ELT Conference, ed. S. Esposito & L. Fini
- Nissen et al. (2007) Nissen, H. D., Gustafsson, M., Lemaire, J. L., Clénet, Y., Rouan, D., & Field, D. 2007, A&A, 466, 949
- Perets & Šubr (2012) Perets, H. B. & Šubr, L. 2012, ApJ, 751, 133
- Plambeck et al. (2009) Plambeck, R. L. et al. 2009, ApJ, 704, L25
- Poveda et al. (1967) Poveda, A., Ruiz, J., & Allen, C. 1967, Boletin de los Observatorios Tonantzintla y Tacubaya, 4, 86
- Reipurth & Bally (2001) Reipurth, B. & Bally, J. 2001, ARA&A, 39, 403
- Reipurth & Mikkola (2012) Reipurth, B. & Mikkola, S. 2012, Nature, 492, 221
- Reipurth et al. (2010) Reipurth, B., Mikkola, S., Connelley, M., & Valtonen, M. 2010, ApJ, 725, L56
- Rigaut et al. (2012) Rigaut, F. et al. 2012, in Society of Photo-Optical Instrumentation Engineers (SPIE) Conference Series, Vol. 8447, Society of Photo-Optical Instrumentation Engineers (SPIE) Conference Series
- Rigaut et al. (2014) Rigaut, F. et al. 2014, MNRAS, 437, 2361
- Rodríguez et al. (2005) Rodríguez, L. F., Poveda, A., Lizano, S., & Allen, C. 2005, ApJ, 627, L65
- Sahai et al. (2008) Sahai, R., Claussen, M., Sánchez Contreras, C., Morris, M., & Sarkar, G. 2008, ApJ, 680, 483
- Silvia et al. (2010) Silvia, D. W., Smith, B. D., & Shull, J. M. 2010, ApJ, 715, 1575
- Silvia et al. (2012) —. 2012, ApJ, 748, 12
- Smith & Rosen (2007) Smith, M. D. & Rosen, A. 2007, MNRAS, 378, 691
- Smith et al. (2009) Smith, N., Whitney, B. A., Conti, P. S., de Pree, C. G., & Jackson, J. M. 2009, MNRAS, 399, 952
- Snell et al. (1984) Snell, R. L., Scoville, N. Z., Sanders, D. B., & Erickson, N. R. 1984, ApJ, 284, 176
- Stone et al. (1995) Stone, J. M., Xu, J., & Mundy, L. G. 1995, Nature, 377, 315
- Tan (2004) Tan, J. C. 2004, ApJ, 607, L47
- Turk et al. (2011) Turk, M. J., Smith, B. D., Oishi, J. S., Skory, S., Skillman, S. W., Abel, T., & Norman, M. L. 2011, ApJS, 192, 9
- Wiseman & Ho (1996) Wiseman, J. J. & Ho, P. T. P. 1996, Nature, 382, 139
- Wu et al. (2014) Wu, Y., Liu, T., & Qin, S.-L. 2014, ApJ, 791, 123
- Zapata et al. (2009) Zapata, L. A., Schmid-Burgk, J., Ho, P. T. P., Rodríguez, L. F., & Menten, K. M. 2009, ApJ, 704, L45
- Zapata et al. (2013) Zapata, L. A., Schmid-Burgk, J., Pérez-Goytia, N., Ho, P. T. P., Rodríguez, L. F., Loinard, L., & Cruz-González, I. 2013, ApJ, 765, L29
| Year | (J2000) | (J2000) | Field Size | MJD | Comments |
|---|---|---|---|---|---|
| 2007 | 05:35:12.8 | -05:20:53 | 50″ 50″ at 45 ∘ | 54165 | H2 fingers; Gemini N |
| 2008 | 05:35:11.9 | -05:20:47 | 50″ 50″ at 45 ∘ | 54753 | H2 fingers; Gemini N |
| 2009 | 05:35:11.9 | -05:20:47 | 50″ 50″ at 45 ∘ | 55138 | H2 fingers; Gemini N |
| 2013 | 05:35:13.2 | -05:20:37 | 84″ 84″ at 0∘ | 56290 | OMC1 N; Gemini S |
| 2013 | 05:35:12.5 | -05:22:04 | 92″ 91″ at 0∘ | 56323 | OMC1 BN; Gemini S |
| 2013 | 05:35:17.5 | -05:22:48 | 92″ 91″ at 0∘ | 56323 | OMC1 SE; Gemini S |
| Feature | (J2000) | (J2000) | V | PA | D | Comments | ||
|---|---|---|---|---|---|---|---|---|
| (05h 35m+) | (5∘ + ) | (″) | (km s-1) | (∘) | (″) | (yrs) | ||
| H2 1 | 12.625 | 20:55.22 | 0.88 | 297 | 346 | 97 | 643 | HVCC H2 knot |
| 2 | 12.058 | 20:37.68 | 0.43 | 145 | 324 | 116 | 1577 | Ahead of H2 1 |
| 3 | 12.270 | 20:37.82 | 0.84 | 283 | 344 | 114 | 794 | ” |
| 4 | 12.351 | 20:38.84 | 0.54 | 182 | 350 | 112 | 1213 | ” |
| 5 | 12.965 | 21:16.37 | 0.33 | 111 | 338 | 74 | 1314 | Cluster NE of H2 1 |
| 6 | 12.989 | 21:17.73 | 0.53 | 179 | 347 | 73 | 801 | ” |
| S1 | 11.532 | 21:02.24 | 0.30 | 101 | 233 | - | - | Background flow |
| S2 | 11.616 | 20:53.94 | 0.29 | 98 | 227 | - | - | ” |
| S3 | 11.614 | 20:54.45 | 0.54 | 182 | 218 | - | - | ” |
| W1 | 12.543 | 20:52.03 | 0.240 | 80 | - | - | 29 | Spreading H2 wake |
| W3 | 12.642 | 20:56.45 | 0.138 | 46 | - | - | 100 | ” |
| [Fe II] 1 | 12.521 | 20:50.12 | 0.68 | 229 | 345 | 102 | 863 | HH 207; Fe II] bow |
| 2 | 12.165 | 20:39.09 | 0.81 | 273 | 345 | 116 | 835 | |
| 3 | 12.274 | 20:37.96 | 0.79 | 267 | 354 | 114 | 839 | |
| 4 | 12.353 | 20:38.94 | 0.55 | 186 | 349 | 112 | 1184 | |
| 5 | 12.898 | 20:34.12 | 0.59 | 199 | 1 | 116 | 1146 | |
| 6 | 12.932 | 20:34.87 | 0.61 | 206 | 3 | 115 | 1097 | |
| 7 | 13.066 | 20:35.39 | 0.61 | 206 | 355 | 114 | 1088 | |
| 8 | 13.052 | 20:39.01 | 0.61 | 206 | 354 | 112 | 1069 | |
| 9 | 13.010 | 20:40.81 | 0.56 | 189 | 350 | 97 | 1009 | |
| 10 | 13.308 | 20:54.78 | 0.41 | 138 | 354 | 96 | 1367 | |
| 11 | 13.386 | 20:56.16 | 0.53 | 179 | 353 | 95 | 1043 | |
| 12 | 13.354 | 20:53.14 | 0.33 | 111 | 357 | 98 | 1736 | |
| 13 | 12.592 | 20:56.23 | 0.27 | 91 | 354 | 97 | 2096 | |
| 14 | 12.795 | 21:05.50 | 0.49 | 165 | 354 | 87 | 1036 | |
| 15 | 11.502 | 21:07.20 | 0.92 | 310 | 338 | 94 | 596 | |
| 16 | 11.680 | 21:10.86 | 0.71 | 240 | 326 | 89 | 729 | |
| 17 | 11.792 | 21:12.81 | 0.41 | 138 | 329 | 86 | 1225 |