FIRST TASTE OF HOT CHANNEL IN INTERPLANETARY SPACE
Abstract
Hot channel (HC) is a high temperature (10 MK) structure in the inner corona revealed first by Atmospheric Imaging Assembly (AIA) on board Solar Dynamics Observatory. Eruption of HC is often associated with flare and coronal mass ejection. Previous studies suggest that HC is a good proxy of magnetic flux rope (MFR) in the inner corona, in addition to another well-known MFR candidate, the prominence-cavity structure that is with a normal coronal temperature (1-2 MK). In this paper, we report a high temperature structure (HTS, 1.5 MK) contained in an interplanetary coronal mass ejection induced by an HC eruption. According to the observations of bidirectional electrons, high temperature and density, strong magnetic field, and its association with the shock, sheath, and plasma pile-up region, we suggest that the HTS is the interplanetary counterpart of the HC. The scale of the measured HTS is around 14 R⊙, and it maintained a much higher temperature than the background solar wind even at 1 AU. It is significantly different from the typical magnetic clouds (MCs), which usually have a much lower temperature. Our study suggests that the existence of a corotating interaction region ahead of the HC formed a magnetic container to inhibit the HC expansion and cooling down to a low temperature.
1 INTRODUCTION
Hot channel (HC) refers to the high temperature structure that is revealed first by coronal images of AIA (Atmospheric Imaging Assembly) 131 Å passband (sensitive to temperature of 10 MK), while the structure is invisible from cooler temperature images, e.g., images of the AIA 171 Å passband (sensitive to temperature of 0.6 MK) (Zhang et al. 2012; Cheng et al. 2013a, 2013b, 2014a, 2014b, 2014c; Li & Zhang 2013). HC appears as a hot blob structure if observed along the channel axis (Cheng et al. 2011; Patsourakos et al. 2013; Song et al. 2014a, 2014b) due to the projection effect. Hereafter, we will use HC to refer to both hot channel and hot blob structures.
HC has been generally regarded as a proxy of magnetic flux rope (MFR, a volumetric plasma structure with the magnetic field lines wrapping around a central axis) since its discovery with AIA on board Solar Dynamics Observatory (SDO). This is supported by the following observational studies: (1) Cheng et al. (2014a) observed an HC that showed helical threads winding around an axis. In the meantime, cool filamentary materials descended spirally down to the chromosphere, providing direct observational evidence of intrinsical helical structure of HC; (2) Cheng et al. (2011) reported that HC can grow during the eruption, similar to the MFR growth process according to the classical magnetic reconnection scenario in eruptive flares; Song et al. (2014a) presented the formation process of an HC during a CME and found that the HC was formed from coronal arcades through magnetic reconnection. Their works further support that the HC is an MFR structure based on the relation between HC and magnetic reconnection; (3) Cheng et al. (2014b) found an HC was initially cospatial with a prominence, then a separation of the HC top from that of the prominence was observed during the eruption initiated by the ideal kink instability (Török et al. 2004). It is widely accepted that prominence/filament can exist at the dip of a flux rope (Rust & Kumar 1994). Therefore, this observation offered another important support that HC is an MFR;
Except HC, several lines of observations in the lower corona have also been proposed as MFRs, including sigmoid structure in active region (Titov & Démoulin 1999; Mckenzie & Canfield 2008) and coronal cavity in quiescent region (Wang & Stenborg 2010). A sigmoid has either a forward or reverse S-shape with enhanced X-ray emissions (implying an entity of high temperature) with its center straddling along the polarity inversion line of the hosting active region. Zhang et al. (2012) showed that the HC initially appeared like a sigmoidal structure and then changed to a semi-circular shape. Therefore, sigmoid and HC might represent the same structure, their different shapes are likely from different perspectives and evolution phase. Both structures are featured by high temperature, a possible result of flare magnetic reconnection (e.g., Song et al. 2014a, 2014b). Coronal cavity, on the other hand, observed as dark circular or oval structure above solar limb in coronal images with temperatures close to the background corona (Fuller et al. 2008; Gibson et al. 2010; Kucera et al. 2012), is also interpreted as MFR. As mentioned, the long-studied feature of solar filament/prominence shown best in H images has been interpreted as situated along the dip in MFR. Therefore, prominence lying in the dip of coronal cavity is not rare. The eruption of coronal cavity (or filament) from quiescent region doesn’t show high-temperature signature like HC, which might be attributed to lack of obvious heating acquired from the weak magnetic reconnection (e.g., Song et al. 2013).
According to the descriptions above, at least two different types of MFRs can be identified in the inner corona depending on their temperatures, i.e., high-temperature MFR like HC and low-temperature MFR like coronal cavity. Note that it is possible that the HC has a low initial temperature but heated later by flare magnetic reconnection during the eruption (e.g., Song et al. 2014a, 2014b). One obvious question arises as what the difference is between these two MFR structures when they are detected in situ near 1 AU. Magnetic cloud (MC), with lower temperature than the background solar wind, is a well known interplanetary structure (Burlaga et al. 1981; Lepping et al. 1990). Can the HC maintain its higher temperature than the background at 1 AU, or will it evolve into a cool MC? In this paper, we will try to address this question with instruments on board Solar TErrestrial RElations Observatory (STEREO) through tracing an HC eruption from the Sun to 1 AU. In section 2, we introduce the instruments. The observations and discussion are presented in Section 3, which are followed by a summary in our last Section.
2 INSTRUMENTS
Our event was observed by three spacecraft including SDO, SOHO (Solar and Heliospheric Observatory), and STEREO. The AIA on board SDO provides the solar atmosphere images in 10 narrow UV and EUV passbands with a high cadence (12 seconds), high spatial resolution (1.2 arcseconds) and large FOV (1.3 R⊙). The AIA passbands cover a large temperature range from 0.6 to 20 MK (O’Dwyer et al. 2010; Del Zanna et al. 2011; Lemen et al. 2012). During an eruption, the 131 Å passband is sensitive to the hot plasma from flare regions and erupting HC (e.g., Zhang et al. 2012; Cheng et al. 2011; Song et al. 2014a, 2014b). AIA’s high cadence and broad temperature coverage make it possible for constructing differential emission measure (DEM) models of corona plasma (Cheng et al. 2012 and references therein). In addition, the COR coronagraph instrument (Howard et al. 2008) on board STEREO (Kaiser et al. 2008) and LASCO on board SOHO (Domingo et al. 1995) provide CME images in the outer corona from different perspectives. Heliospheric Imager (HI, Howard et al. 2008) on board STEREO images the whole propagation process of the associated ICME from near the Sun to 1 AU. PLASTIC and IMPACT on board STEREO measure the solar wind properties and interplanetary magnetic field. Data from the above instruments are analyzed in the following section.
3 OBSERVATIONS AND DISCUSSION
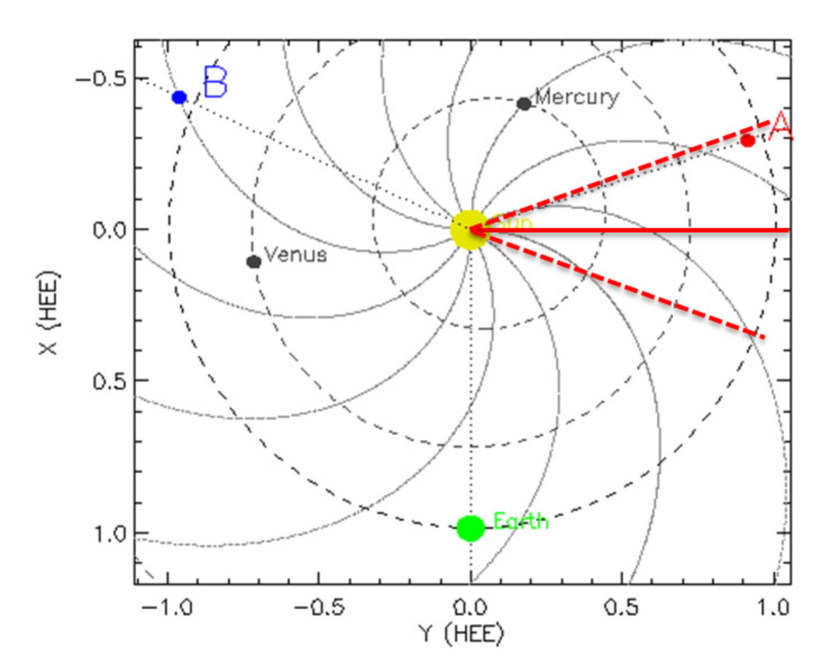
On 2012 January 27, an X1.7 class soft X-ray (SXR) flare was recorded by the Geostationary Operational Environmental Satellite (GOES), which started at 17:37 UT and peaked at 18:37 UT. The flare location was at N33W85 (NOAA 11402) from the perspective of the Earth. Figure 1 shows the positions of different spacecraft in the ecliptic plane, including SDO/SOHO, STEREO A and B. During this flare, STEREO A and B were 107.8∘ west and 114.5∘ east of the Earth with a distance of 0.96 AU and 1.06 AU, respectively. Therefore, the source location on the Sun was 23∘ east of the central meridian as viewed from STEREO A, whereas 70∘ behind the west limb for STEREO B. Obviously, STEREO A provides the best disk observation of the active region, while SDO and SOHO give the limb views of the eruption.
3.1 HC Eruption in the Inner Corona
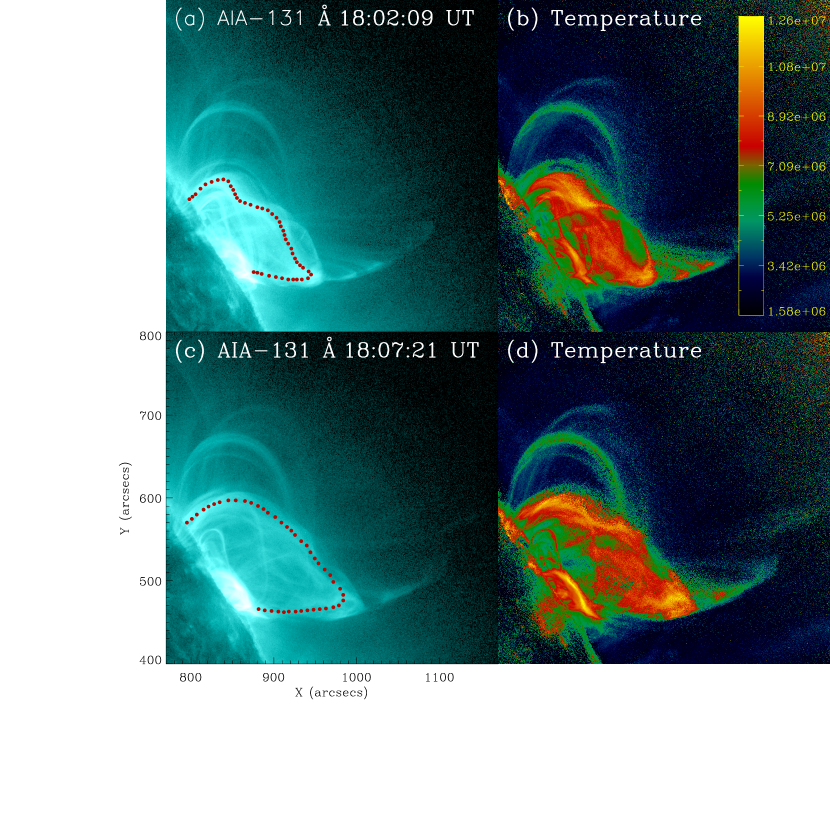
For this event, a very clear HC can be observed during the eruption, rising from 17:37 UT onward and arriving at the rim of AIA FOV at 18:15 UT. The HC showed an interesting morphological evolution from a channel with twisted or writhed axis (Figure 2(a)) to a channel with loop-like axis (Figure 2(c)), as indicated by the dotted lines. This morphological evolution is very similar to the event reported by Zhang et al. (2012). During the evolution, the two footpoints of the evolving HC remained fixed on the Sun (see the first animation accompanying Figure 2 for the whole process). To describe the overall thermal properties of the HC, DEM-weighted temperature maps (see Cheng et al. 2012 and Song et al. 2014b for the validation and other details) are reconstructed and presented in Figures 2(b) and (d), which show the HC temperature is around 10 MK at the times of Figures 2(a) and (c), respectively. Here we also acquire the HC density through DEM analysis (see Cheng et al. 2012 for the method), which is around 109 cm-3 and much higher than the density of its surrounding corona at the same altitude. By carefully inspecting the AIA and LASCO animations, one can deduce that the HC eruption induced a CME (see the second animation accompanying Figure 2), which was recorded by LASCO and COR from three distinct perspectives as described in the following subsection. With combined observations of SDO, STEREO A and B, we conclude that no other CMEs or large blowout jets took place during the time of interest (see the third animation accompanying Figure 2), which concludes that the CME was caused by the HC eruption.
3.2 CME Observations in the Outer Corona
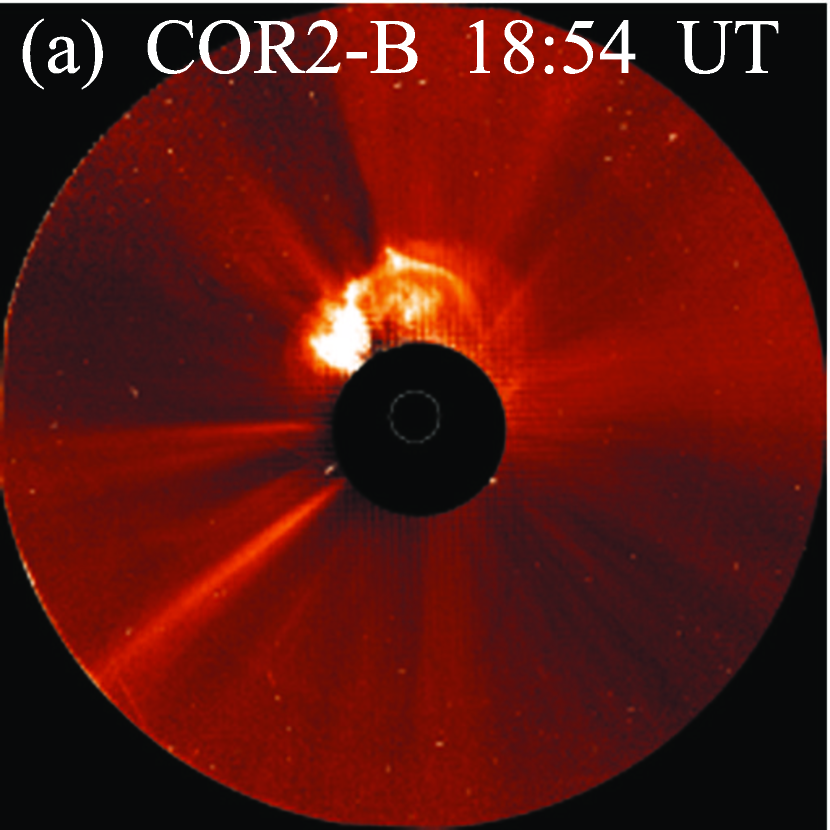
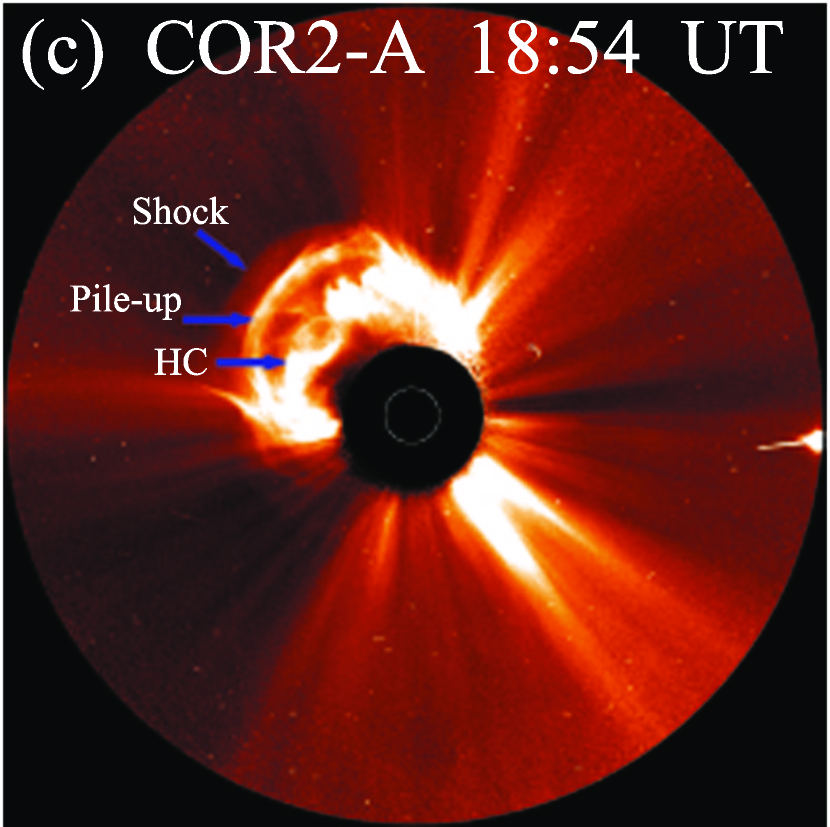
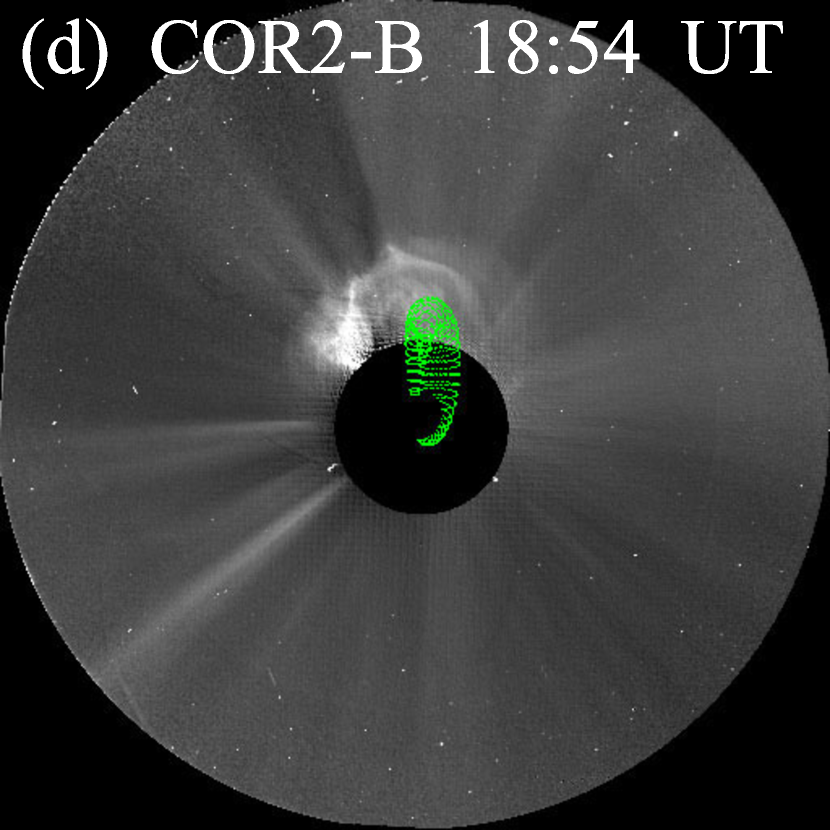
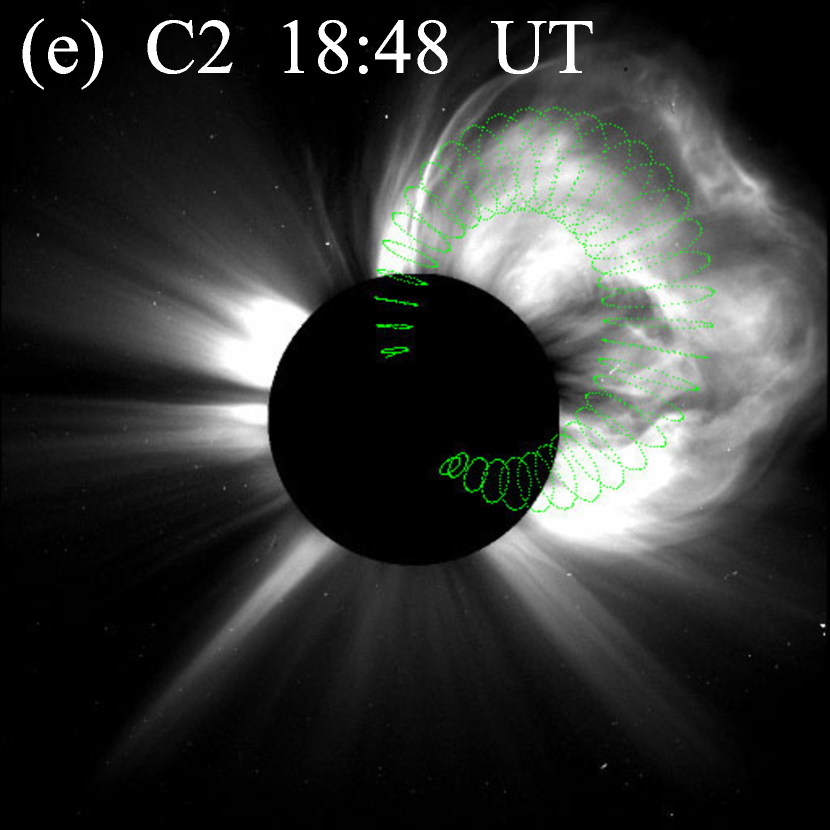
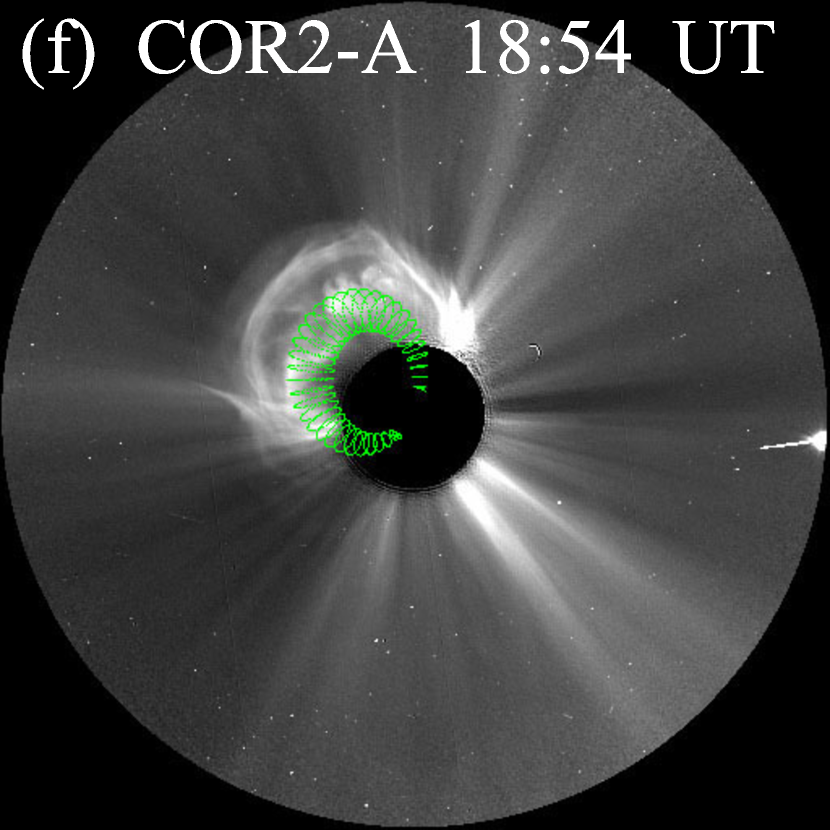
In the outer corona, the CME was well observed by the LASCO, COR-A and COR-B instruments as shown in Figures 3(a)-(c) (also see the accompanying animation). The CME appeared in LASCO C2 FOV first at 18:27 UT, and its linear speed was 2508 km s-1 in the LASCO C2/C3 FOV. The three viewpoints provide three distinct projections of the CME. We can distinguish a coherent bright structure and a preceding CME front region in all three perspectives. The CME front region ahead of the MFR likely consists of three components: plasma pile-up of the MFR, an outer diffuse shock front and the sheath region between them (Vourlidas et al. 2013; Cheng et al. 2014a). Through inspecting the HC eruption and CME propagation in LASCO FOV carefully, we believe that the coherent bright structure and preceding front region are the HC and pile-up plasma, respectively, which is consistent with the conclusions of Cheng et al. (2014a). This is further supported by the graduated cylindrical shell (GCS) model (Thernisien et al. 2006)
Using the GCS model of Thernisien et al. (2006), we can reconstruct the three-dimensional (3D) morphology of the HC. The model depends on six parameters: the source Carrington longitude () and latitude (), the MFR tilt angle (), height () and aspect ratio (), as well as the half-angle () between the two legs of MFR. We first estimate (186∘), (37∘), and (79∘) using the location and neutral line of the active region through the Extreme Ultraviolet Imager (EUVI) 195 Å images, then vary (57∘), (0.17), and (5.6 R⊙) till we achieve the best visual fit in the three coronagraph images simultaneously. The numbers in the brackets are the final positioning and model parameters of the HC for the time shown in Figure 3. The results are displayed in Figures 3(d)-(f). It’s clear that LASCO and COR-A were observing the HC face on, and COR-B edge on. Therefore, the HC appeared as a bright channel in LASCO and COR-A FOV and a bright blob in COR-B FOV. It’s clear that our CME is a limb event from the Earth perspective, and the HC is almost along the west solar limb. With the fitting results of GCS model and assuming that the HC experienced a self-similar expansion (Möstl et al. 2014), we got the longitude range of the HC is not over 40 degrees, which was shown with red dash lines in Figure 1, if assuming the CME propagated outward radially in the ecliptic plane along the red solid line in Figure 1. However, we note that the CME might deflect in the corona and interplanetary space (Wang et al. 2004, 2013; Gopalswamy et al. 2009; Shen et al. 2011; Gui et al. 2011). Figure 1 shows that the MFR will be likely detected by STEREO A, with the spacecraft trajectory far away from its center, which might influence the in-situ detection of the MFR (Démoulin et al. 2013; Riley & Richardson 2013). The in-situ observations will be discussed in Section 3.4.
It’s well accepted that the typical morphology of a normal CME contains the so-called three-part structure: a bright front loop, a dark cavity and an embedded bright core (Illing & Hundhausen, 1985), corresponding to the pile-up plasma, MFR, and the erupting filament (House et al. 1981), respectively. However, for CME induced by an HC eruption without a filament, the embedded bright part corresponds to the HC, instead of the filament. In this case, the CME will show a bright front loop and a coherent bright structure, corresponding to the pile-up plasma and HC (or MFR), respectively. It’s reasonable because the HC is not only hotter, but also denser than the background plasma (Cheng et al. 2012). The shock can be generated if CMEs move fast enough. In our event, the shock, pile-up plasma, and HC (MFR) can be observed directly in the coronagraphic FOV as depicted with arrows in Figure 3(c). Usually, the diffuse front ahead of the pile-up region is interpreted as a shock structure (e.g., Vourlidas et al. 2003, 2013; Feng et al. 2012, 2013), and the diffusive layer corresponds to the sheath region. A type II solar radio burst associated with this event was detected (not shown here), which further confirmed the existence of a shock. Therefore, in this event we expect that the shock, sheath, pile-up plasma (front region), HC (MFR), and remainder of the ICME (rear region) are all observed by the coronagraphs, and may have their corresponding in-situ counterparts (e.g., Kilpua et al. 2013), as will be presented later.
3.3 ICME Propagation in Interplanetary Space
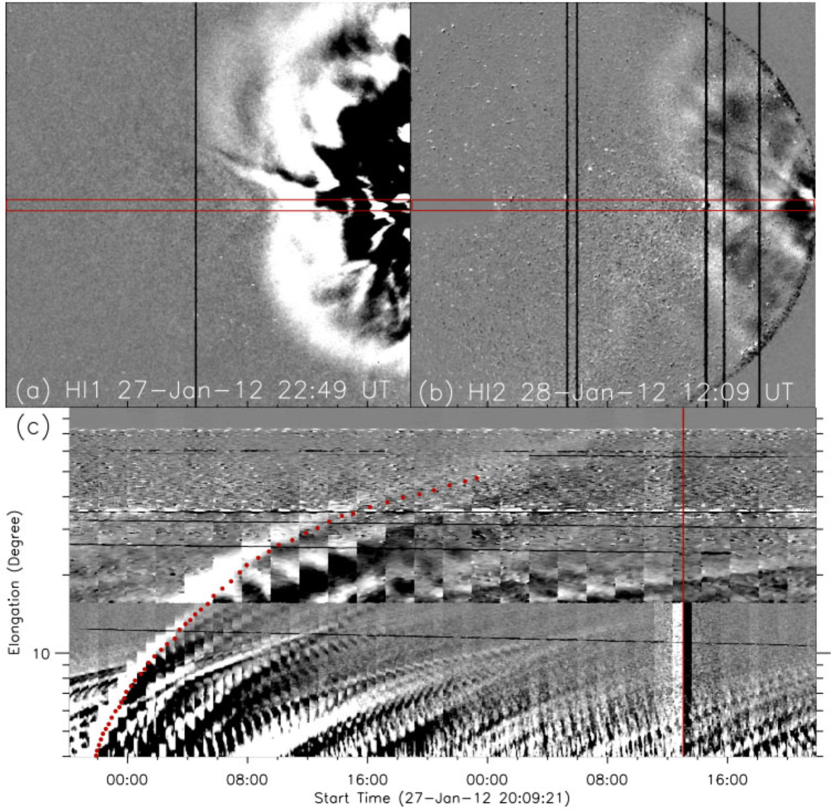
The CME propagation in interplanetary space was well observed by HI-1 and HI-2, as presented in Figures 4(a) and (b). The ICME first appeared in the HI-1A FOV at 19:29 UT on January 27, and in the HI-2A FOV at 02:09 UT on January 28. We produce a time-elongation map by stacking the running difference images within a slit along the ecliptic plane as shown in Figures 4(a) and (b) with the red rectangle, and present it in Figure 4(c). Here to trace the propagation of ICME in interplanetary space, we just use HI-1 and HI-2 images. Note that the elongation angles are plotted in a logarithmic scale to expand HI-1 data, so tracks are not J-like as in traditional linear-linear plots (Liu et al. 2010). The time-elongation map shows one obvious and continuous track as indicated with the red dotted line. The vertical red line in Figure 4(c) depicts the arrival time of the ICME shock to STEREO A, which is 13:04 UT on January 29. And no other ICME propagation was observed by HI from near the Sun to 1 AU during these days.(see the animation accompanying Figure 4 for the whole propagation process). These observations show that the ICME detected by STEREO A is the one we are tracing.
3.4 ICME (HC) Detection near 1 AU
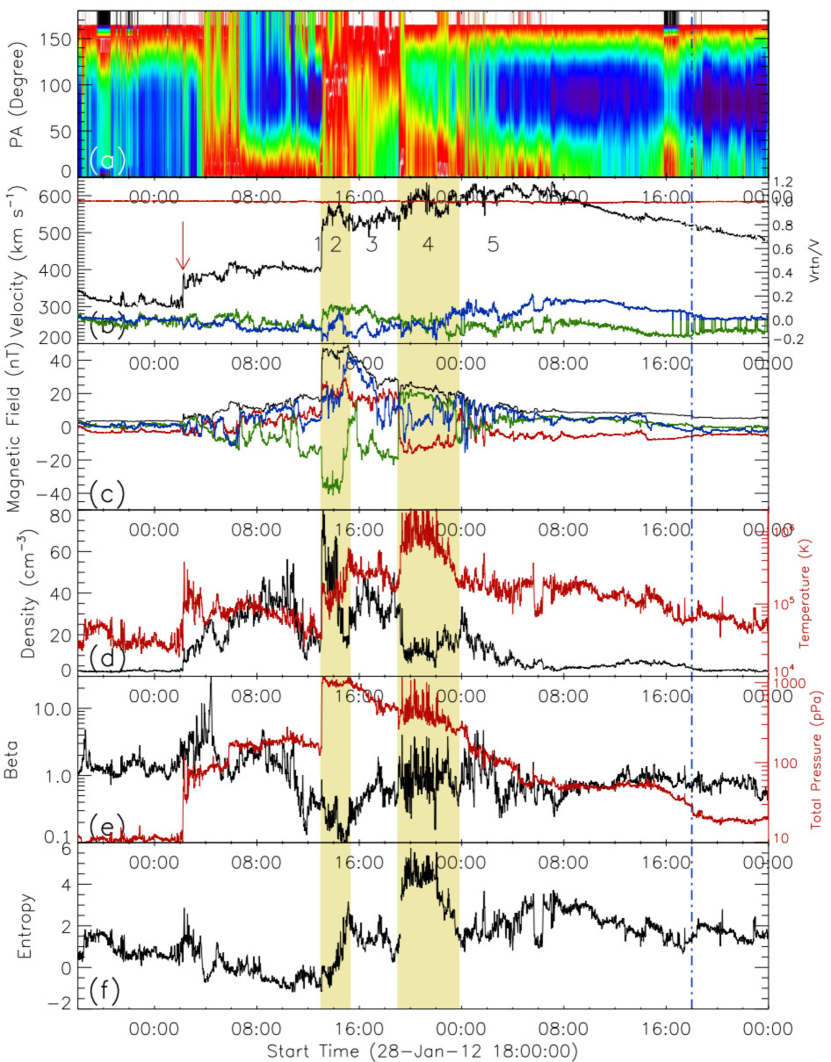
Figure 5 shows the in situ measurements from the IMPACT and PLASTIC instruments on board STEREO A at 0.96 AU. From top to bottom, the panels show the normalized pitch angle (PA) distribution of 93.47 eV electrons (with electron flux values descending from red to black), the proton bulk speed (black line) and ratios of three components to the total speed, magnetic field strength (black line) and its three components, proton density and temperature, plasma and total pressure, and entropy. Note the velocity (panel b) and magnetic field (panel c) components are plotted in RTN coordinates, where R (red line) points from the Sun center to the spacecraft, T (green line) is parallel to the solar equatorial plane and along the direction of planet motion and N (blue line) completes the right-handed system.
As mentioned in Section 3.2, we expect that the shock, sheath, pile-up plasma, HC (MFR), and remainder of ICME can be detected one by one with in situ measurements. An obvious forward shock (depicted with 1 in panel b) passed STEREO A at 13:04 UT on January 29. The transit time is 43.5 h taking the flare start time (17:37 UT on January 27) to be the CME launch time. One ICME can be identified from the magnetic field data behind the shock. The PA distributions in panel a distinguish the different parts of ICME. The sheath region is very turbulent (e.g., Burlaga et al. 1981), so electrons presented PA between 0 180∘ in this region (depicted with 2 in panel b, the left shaded region), while for the pile-up region, the anti-parallel electron flow dominated (depicted with 3 in panel b, between the two shaded regions), similar to the background solar wind, supporting that it is the pile-up materials of background plasma. Bidirectional electrons (BDEs) appeared within a high-temperature structure (HTS, 1.5 MK, as depicted with 4 in panel b in the right shaded region), indicating that it corresponds to a magnetic structure with both footpoints anchored on the Sun. The remainder of ICME is depicted with 5 in panel b. The final part likely ends around 18:00 UT on January 30 as indicated with the vertical blue dot dash line, when the magnetic filed, temperature, and total pressure approach to the background values.
3.5 Discussion
The total magnetic field strengths in the shock sheath and HTS keep around 45 nT and 20 nT, respectively, and vary between 30 and 50 nT in plasma pile-up region. The R and T components of HTS keep almost constant while the N component direction shows irregular rotation, which will be explained later. The density of HTS is 15 cm-3 and higher than the background solar wind, while it’s lower than that of the sheath and plasma pile-up region (panel e) due to its expansion during propagation from near the Sun to 1 AU. Based on its BDEs, high temperature, strong magnetic field strength, high density, and its association with the shock, sheath, and plasma pile-up region, we suggest that the HTS is the interplanetary counterpart of the HC observed in lower corona as shown in Figure 2. The presence of the embedding high Fe charge state further supports this conclusion, which will be discussed later. The HC started at 19:00 UT and ended at 23:50 UT, the average bulk velocity is 570 km s-1 during this period (panel b), so the scale of the measured HC is around 14 R⊙. The plasma in the HC is around 1 (panel e), which means the thermal pressure is nearly equal to the magnetic pressure. The high thermal pressure is attributed to the high temperature. The entropy in the HC region is considerably higher than its surroundings (panel f). From above descriptions, we find the temperature and density of HC decreased from 10 MK and 109 cm-3 to 1.5 MK and 15 cm-3 from near the Sun to 1 AU, respectively.
According to the ICME list provided on the STEREO website111, this ICME is sorted into Group 3, which means the spacecraft passed far away from the ICME center, displaying a rapid rise and then gradual decay in total pressure (Jian et al. 2006). It is consistent with our CME propagation analysis in Figure 1. This may lead to two consequences as mentioned above: First, the scale of the measured HC is small compared to the typical MC structure near 1 AU, which is around 0.25 AU (over 50 R⊙) (see, e.g., Lepping et al. 2006); Second, it is not easy to observe a regular rotation of magnetic field. Therefore, we do not acquire a nice MFR structure with the Grad-Shafranov (GS) reconstruction method (Hu & Sonnerup 2002), which works best for spacecraft passing near the ICME center. The weakening of the MFR signature with increasing distance of the spacecraft from the ICME center has been demonstrated by multi-spacecraft observations (Cane et al., 1997; Kilpua et al. 2011), consistent with our observations.
As mentioned above, an MC (Burlaga et al. 1981) can be frequently identified in ICME structures, usually behind the shock, sheath, and plasma pile-up region. The magnetic field vectors in a typical MC are observed to have a large rotation, consistent with the passage of an MFR. The field strength is high, and the density and temperature are relatively low with a low plasma (less than 0.1, see Lepping et al. 1997). The total pressure inside the cloud is higher than outside, causing the cloud to expand with its propagation, even to a distance beyond 1 AU (Burlaga et al. 1981). However, in our case, an ICME structure with a much higher temperature (1.5 MK) and irregular rotation of Bn was detected, and the associated plasma was around 1, which obviously is not the traditional MC. According to a very recent statistical study based on 325 ICMEs from 1996 to 2008 (Mitsakou & Moussas 2014), the temperatures of ICMEs at 1 AU are usually lower than 0.25 MK, and their averaged value is only 0.076 MK. We conjecture that there exist two types of interplanetary MFR (IMFR) structures mainly according to their temperatures, i.e., the low-temperature IMFR (or MC) corresponding to MFR (e.g., coronal cavity) without obvious heating during its eruption (e.g., Song et al. 2013), and the high-temperature IMFR corresponding to MFR (e.g., HC) with significant heating during or before its eruption (e.g., Song et al. 2014a, 2014b). In our event, the later can keep its temperature higher than background even to 1 AU. It might be confusing why the temperature of HC didn’t decrease to a level lower than the background wind through its faster expansion in the interplanetary space. To address this, we note that the total pressure ahead of the HC is much higher (see Figure 5(e)) than the usual solar wind, which might prevent the HC from a free expansion.
According to the statistical study (Richardson & Cane 2010; Wu & Lepping 2011), MCs are detected in only about 30% of ICMEs. Riley and Richardson (2013) listed several explanations for why some ICMEs are observed to be MCs and others are not, e.g., the observational selection effect of ICMEs, the interactions of an MFR with itself or between neighboring MFRs, the effect of evolutionary process of MFRs, and the different initiation mechanisms of CMEs. As mentioned above, there are different observational lines raised as proxies of MFRs in the lower corona, e.g., filaments/prominences, coronal cavities, sigmoid structures, and hot channels. Therefore, it’s natural to argue that ICMEs with or without MCs might correspond to different coronal structure eruptions. Our results indicate that the HC eruption might not evolve into a typical MC under some special conditions. More events are necessary to conclude this point.
If the HTS really corresponds to HC in the lower corona, then we should be able to detect high charge state of Fe element with in situ measurements, because the charge state distribution is fully established within a few solar radii from the Sun, and remains frozen in after that (e.g., Esser & Edgar, 2001; Chen et al. 2004). Unfortunately, high temporal resolution Fe charge state data is not available for this event. The ICME list provided on STEREO website (the same address with above) indicated that there was a significant increase of Fe charge state during our event, which hints the coronal origin of the HTS and supports our conclusion.
It should be mentioned that a weak shock was observed at 2:13 UT on January 29 before the ICME shock (See the red arrow in Figure 5(b)). It seems to be a forward shock generated by a corotating interaction region (CIR, see e.g., Wu et al. 2014), whose presence is supported by the appearance of a low latitude coronal hole ahead of NOAA active region 11402 according to the observations of the X-ray telescope on board HINODE. As mentioned, this CIR structure is the reason for the presence of the high-pressure region ahead of the HC, which acts as an obstacle and inhibits the HC expansion. We suggest that a preceding CIR (or ICME, e.g., Liu et al. 2014) shall be a necessary condition for the presence of a HC at 1 AU. It is likely that the CME-driven shock ran into the CIR, which makes the interplanetary transient looks complex as presented in Figure 5. Regions 2 and 3 in Figure 5 might include the compressed CIR plasma. Nevertheless, we believe that the ICME-CIR interaction will not change our interpretation of the detected HTS based on the descriptions and discussion of BDEs, magnetic field, temperature, and total pressure. As mentioned, the different trajectories of spacecraft through ICME make the observational characteristics of ICME difference. For this event, it also seems that the regions 2, 3, and 4 are all belong to the sheath, and just region 5 corresponds to the ejecta according to Figure 5(b). However, we think this possibility is not high because the total magnetic field in region 5 is at the background level, and the BDEs analysis in Figure 5(a) doesn’t support this point, either.
4 SUMMARY
In this paper, an HC eruption associated with an X1.7 class SXR flare was recorded by SDO and GOES. The corresponding fast CME can be well observed from three distinct viewpoints by coronagraphs on board SOHO, STEREO A and B. The shock, pile-up region and HC can be well observed in coronagraphic FOVs. And the HC (coherent bright structure) in coronagraph images can be well fitted with the GCS model. The CME propagation into the interplanetary space can be traced with the HI-1/2 instruments, and detected in-situ by instruments on board STEREO A. Further, no other ICME propagation in HI FOV during these days. This concludes that the HI ICME is the HC eruption we are tracing. For the first time, we might taste the HC in interplanetary space, which is mainly identified by its high temperature, appearance behind shock, sheath and pile-up region, and the BDEs. The preliminary Fe charge-state report from the STEREO team further supports that the high temperature property observed near 1 AU has its origin in the inner corona. Compared with the background solar wind, the interplanetary HC has a strong magnetic field, and shows obvious BDE flow, indicating its two footpoints still connecting to the Sun. This supports that the interplanetary HC belongs to an MFR structure. Nevertheless, it’s likely that the spacecraft passed far away from the ICME center, so the rotation of magnetic field components was not obvious and it’s difficult to obtain a nice flux rope structure with the GS reconstruction method. In future studies, we expect that a suitable event will enable us to observe the known MFR signatures in the aftermath of a HC eruption.
References
- Burlaga et al. (1981) Burlaga, L., Sittler, E., Mariani, F., & Schwenn, R. 1981, J. Geophys. Res., 86, 6673
- Cane et al. (1997) Cane, H. V., Richardson, I. G., & Wibberenz, G. 1997, J. Geophys. Res., 102, 7075
- Chen (2011) Chen, P. F. 2011, Living Rev. Solar Phys., 8, 1
- Chen (2004) Chen, Y., Esser, R., Strachan, L, & Hu, Y. 2004, ApJ, 602, 415
- Cheng et al. (2014a) Cheng, X., Ding, M. D., Guo, Y., et al. 2014a, ApJ, 780, 28
- Cheng et al. (2014b) Cheng, X., Ding, M. D., Zhang, J., et al. 2014b, ApJ, 789, L35
- Cheng et a.. (2014c) Cheng, X., Ding, M. D., Zhang, J., et al. 2014c, ApJ, 789, 93
- Cheng et al. (2013a) Cheng, X., Zhang, J., Ding, M. D., et al. 2013a, ApJ, 763, 43
- Cheng et al. (2013b) Cheng, X., Zhang, J., Ding, M. D., et al. 2013b, ApJ, 769, L25
- Cheng et al. (2011) Cheng, X., Zhang, J., Liu, Y., & Ding, M. D. 2011, ApJ, 732, L25
- Cheng et al. (2012) Cheng, X., Zhang, J, Saar, S. H., & Ding, M. D. 2012, ApJ, 761, 62
- Del Zanna et al. (2011) Del Zanna, G., O’Dwyer, B., & Mason, H. E. 2011, A&A, 535, A46
- Démoulin et al. (2013) Démoulin, P., Dasso, S., & Janvier, M. 2013, å, 550, A3
- Domingo et al. (1995) Domingo, V., Fleck, B., & Poland, A. I. 1995, Sol. Phys., 162, 1
- Esser & Edgar (2001) Esser, R., & Edgar, R. J. 2001, ApJ, 563, 1055
- Feng et al. (2013) Feng, S. W., Chen, Y., Kong, X. L., et al. 2013, ApJ, 767, 29
- Feng et al. (2012) Feng, S. W., Chen, Y., Kong, X. L., et al. 2012, ApJ, 753, 21
- Fuller et al. (2008) Fuller, J., Gibson, S. E., de Toma, G., & Fan, Y. 2008, ApJ, 678, 515
- Gibson et al. (2010) Gibson, S. E., Kucera, T. A., Rastawicki, D., et al. 2010, ApJ, 724, 1133
- (20) Gopalswamy 2009 Gopalswamy, N., Mäkelä, P., Xie, H., Akiyama, S., & Yashiro, S. 2009, JGRA, 114, A00A2.
- Gui et al. (2011) Gui, B., Shen, C. L., Wang, Y. M., et al. 2011, Sol. Phys., 271, 111
- House et al. (1981) House, L. L., Wagner, W. J., Hildner, E., Sawyer, C., & Schmidt, H. U. 1981, ApJ, 244, L117
- Howard et al. (2008) Howard, R. A., Moses, J. D., Vourlidas, A., et al. 2008, Space Sci. Rev., 136, 67
- Hu & Sonnerup (2002) Hu, Q., & Sonnerup, B. U. Ö. 2002, J. Geophys. Res., 107, 71142
- Illing & Hundhausen (1985) Illing, R. M. E., & Hundhausen, A. J. 1985, Sol. Phys., 90, 275
- Jian et al. (2006) Jian, L., Russell, C. T., Luhmann, J. G., & Skoug, R. M. 2006, Sol. Phys., 239, 393
- Kaiser et al. (2008) Kaiser, M. L., Kucera, T. A., Davila, J. M., et al. 2008, Space Sci. Rev., 136, 5
- Kilpua et al. (2013) Kilpua, E. K. J., Isavnin, A., Vourlidas, A., Koskinen, H. E. J., & Rodriguez, L. 2013, Ann. Geophys., 31, 1251
- Kilpua et al. (2011) Kilpua, E. K. J., Jian, L. K., Li, Y., Luhmann, J. G., & Russell, C. T. 2011, J. Atmos. Solar-Terr. Phys., 73, 1228
- Kucera et al. (2012) Kucera, T. A., Gibson, S. E., Schmit, D. J., Landi, E., & Tripathi, D. 2012, ApJ, 757, 73
- Lemen et al. (2012) Lemen, J. R., Title, A. M., Akin, D. J., et al. 2012, Sol. Phys., 275, 17
- Lepping et al. (1997) Lepping, R. P., Berdichevsky, D. B., Szabo, A., et al. 1997, J. Geophys. Res., 102, 14049
- Lepping et al. (2006) Lepping, R. P., Berdichevsky, D. B., Wu, C. C., et al. 2006, Ann. Geophys, 24, 215
- Lepping et al. (1990) Lepping, R. P., Burlaga, L. F., & Jones, J. A. 1990,J. Geophys. Res., 95, 11957
- Li & Zhang (2013) Li, L. P., & Zhang, J. 2013, A&A, 552, L11
- Liu et al. (2010) Liu, Y., Davies, J. A., Luhmann, J. G., et al. 2010, ApJ, 710, L82
- Liu et al. (2014) Liu, Y. D., Luhmann, J. G., Kajdič, P., et al. 2014, Nat. Commun., 5, 3481
- McKenzie & Canfield (2008) McKenzie, D. E., & Canfield, R. C. 2008, A&A, 481, L65
- Mitsakou & Moussas (2014) Mitsakou, E., & Moussas, X. 2014, Sol. Phys., 289, 3137
- Möstal et al. (2014) Möstl, C., Amla, K., Hall, J. R., et al. 2014, ApJ, 787, 119
- O’Dwyer et al. (2010) O’Dwyer, B., Del Zanna, G., Mason, H. E., Weber, M. A., &Tripathi, D. 2010, A&A, 521, A21
- Patsourakos et al. (2013) Patsourakos, S., Vourlidas, A., & Stenborg, G. 2013, ApJ, 764, 125
- Richardson & Cane (2010) Richardson, I. G., & Cane, H. V. 2010, Sol. Phys., 264, 189
- Riley & Richardson (2013) Riley, P., & Richardson, I. G. 2013, Sol. Phys., 284, 217
- Rust & Kumar (1994) Rust, D. M., & Kumar, A. 1994, Sol. Phys., 155, 69
- Shen et al. (2011) Shen, C. L., Wang, Y. M., Gui, B., Ye, P. Z., & Wang, S. 2011, Sol. Phys., 269, 389
- Song et al. (2013) Song, H. Q., Chen, Y., Ye, D. D., et al. 2013, ApJ, 773, 129
- Song et al. (2014a) Song, H. Q., Zhang, J., Chen, Y., & Cheng, X. 2014a, ApJ, 792, L40
- Song et al. (2014b) Song, H. Q., Zhang, J., Cheng, X., et al. 2014b, ApJ, 784, 48
- Thernisien et al. (2006) Thernisien, A. F. R., Howard, R. A., & Vourlidas, A. 2006, ApJ, 652, 73
- Titov & Démoulin (1999) Titov, V. S., & Démoulin, P. 1999, A&A, 351, 707
- Török et al. (2004) Török, T., Kliem, B, & Titov, V. S. 2004, A&A, 413, L27
- Vourlidas et al. (2013) Vourlidas, A., Wu, S. T., Wang, A. H., Subramanian, P., & Howard, R. A. 2003, ApJ, 598, 1392
- Vourlidas et al. (2013) Vourlidas, A., Lynch, B. J., Howard, R. A., & Li, Y. 2013, Sol. Phys., 284, 179
- Wang et al. (2004) Wang, Y. M., Shen, C. L., Wang, S., & Ye, P. Z. 2004, Sol. Phys., 222, 329
- Wang & Stenborg, G. (2010) Wang, Y. M., & Stenborg, G. 2010, ApJ, 719, L181
- Wang et al. (2013) Wang, Y. M., Wang, B. Y, Shen, C. L., Shen, F., & Lugaz, N. 2013, J. Geophys. Res., 119, 5117
- Webb & Hundhausen (1987) Webb, D. F., & Hundhausen, A. J. 1987, Sol. Phys., 108, 383
- Wu & Lepping (2011) Wu, C. C., & Lepping, R. P. 2011, Sol. Phys., 269, 141
- Wu et al. (2014) Wu, Z., Chen, Y., Li, G., et al. 2014, ApJ, 781, 17
- Zhang et al. (2012) Zhang, J., Cheng, X., & Ding, M. D. 2012, NatCo, 3, 747