Evolution of Directed Triangle Motifs
in the Google
OSN
Abstract
Motifs are a fundamental building block and distinguishing feature of networks. While characteristic motif distributions have been found in many networks, very little is known today about the evolution of network motifs.
This paper studies the most important motifs in social networks, triangles, and how directed triangle motifs change over time. Our chosen subject is one of the largest Online Social Networks, Google. Google has two distinguishing features that make it particularly interesting: (1) it is a directed network, which yields a rich set of triangle motifs, and (2) it is a young and fast evolving network, whose role in the OSN space is still not fully understood.
For the purpose of this study, we crawled the network over a time period of six weeks, collecting several snapshots. We find that some triangle types display significant dynamics, e.g., for some specific initial types, up to 20 of the instances evolve to other types. Due to the fast growth of the OSN in the observed time period, many new triangles emerge. We also observe that many triangles evolve into less-connected motifs (with less edges), suggesting that growth also comes with pruning.
We complement the topological study by also considering publicly available user profile data (mostly geographic locations). The corresponding results shed some light on the semantics of the triangle motifs. Indeed, we find that users in more symmetric triangle motifs live closer together, indicating more personal relationships. In contrast, asymmetric links in motifs often point to faraway users with a high in-degree (“celebrities”).
I Introduction
Network motifs [1], also known as graphlets or structural signatures, can give insights into the relationships and interaction patterns in a network. The existence and frequency distribution of network motifs has been analyzed in multiple contexts, including biological [2] (e.g., protein-protein interaction networks), economical [3] (e.g., connectivity during mergers) and social networks.
Apart from links–that is 2-node motifs–the most simple and important network motif in social networks is the triangle: it describes the relationship between three nodes. Triangles give insights into the inter-connectivity of nodes in graphs [4, 5] and are an indication of community behavior [6]. Triangles also form the basis of the widely-studied clustering coefficient [7, 8].
However, while researchers have made much progress on the characterization of a given network, only very little is known today about the evolution of motifs over time. Moreover, many studies today focus on undirected motifs, especially in the context of clustering (see also the notion of clustering coefficient itself); in reality however, networks often feature rich directed relationships.
Our Contribution. This paper argues that the motifs of any active network are inherently dynamic, and the study of the motif changes over time can give interesting new insights into the nature of a network.
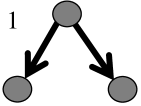
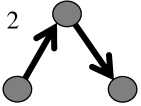
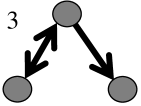
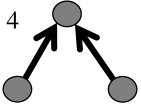
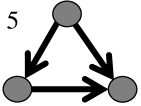
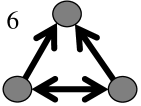
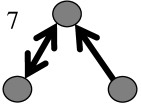
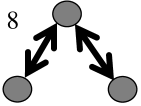
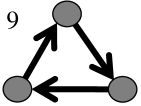

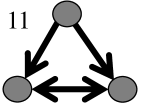
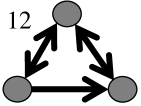
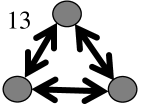
As a first step, we consider the most fundamental triangle motif: weakly connected subgraphs involving three users. Figure 1 summarizes the thirteen non-isomorphic triangle types studied in this paper.
For our analysis, we collected a unique data set about the user relationships in Google OSN during a 6-week period of fast growth: in the observed period, the network doubled in size. Our data set not only includes information about who circles (“follows”) who, but also meta-data about, e.g., the geographic user locations and hence the distances of links.
To study motif changes over time, we present a snapshot-based methodology, and make the following findings:
-
1.
Slightly over of all triangles instances in the first snapshot are of a different type in the last snapshot after six weeks. How dynamic the triangles are depends on their type: while some motif types are rather stable (around 10 % change probability), specific types evolve quickly in the sense that more than 30 % of their triangles change into another type. This implies that the topology structure changes over time.
-
2.
The frequency distribution over different motifs is very skewed in all snapshots: the least frequent motif (Type 9) occurs less than 0.001 %, while the most frequent motif (Type 4) occurs around 60 %.
-
3.
We observe a non-negligible amount of transient triangles, i.e., triangles that are not observed if the analysis only considers triangles seen in the first or the last snapshot. This implies that to properly capture the whole dynamics of the social network, all motifs seen during the whole lifetime of the network must be considered.
-
4.
Although the observed time period is characterized by a fast growth, more than half (50.6 %) of all triangles that change type evolve into less-connected types, i.e., many links disappear. Some even dissolve completely (18.6 %). This indicates that users also prune their social network or change their privacy settings to hide their network.
-
5.
By correlating triangles with users in- and out-degrees and user locations, we shed light on the semantics of different triangle types. Asymmetric motifs (motifs with asymmetric links only) differ in nature from more symmetric motifs (motifs with symmetric links): asymmetric edges often point to “celebrity users” with a high in-degree, and span a large geographic distance. In contrast, symmetric motifs are more representative of “friendship networks”, connecting users who live close and who may already have met in person.
Organization. The remainder of this paper is organized as follows. Section II introduces our methodology and describes the collected data set. In Section III, we first study the frequency distribution of different triangle types, and in Section IV we investigate the evolution over time. We extend the study to include meta-data collected from user profiles in Section V, and provide a discussion of our methodology and its limitations, in Section VI. After reviewing related work in Section VII, we conclude in Section VIII.
II Terminology and Methodology
In previous work [9] we crawled almost the complete Google+ social network along with publicly available profile data. This study is based on four snapshots from that crawl, collected over a period of six weeks. The snapshots were taken by crawling the network on Sep 7th (Snapshot ), Sep 20th (Snapshot ), Oct 4th (Snapshot ), and Oct 20th (Snapshot ) in 2011. Snapshots are large: the smallest graph has 19M nodes while the largest has 38M nodes and about 400M edges. Moreover, for , we also collected publicly available profile data, about user locations. Collection of a snapshot took almost a full day, which in conjunction with 2 weeks in-between snapshots might lead to a bias. Please refer to Section VI for a detailed discussion.
In the following we first introduce some terminology, and then present our data set and methodology.
II-A Terminology
Social Graph: The social graph consists of the set of users (nodes) in Google+ and their relationships (directed edges) to other users expressed through the circles.
Node: A user in Google+ represents a node in the graph.
Edge: A (directed) edge represents the fact that user included user in one of his circles (short: circled ). In the case that user also circled , the graph contains another directed edge .
Links (asymmetric/symmetric): The social relation between two nodes in Google+ is called a link. Links can either be asymmetric and consist of one directed edge, or they can be symmetric, in case the users mutually circle each other. Sometimes, we will call a link a 2-node motif.
Out-going, In-coming: The out-going edges of a node are those directed edges that start at this node, pointing to the members of this user’s circles. The in-coming edges of a node are the edges that end at that node, that is, somebody else has “circled” the user.
Out-degree, In-degree: The out-degree is the number of (directed) edges that start at a certain node. The in-degree is the number of (directed) edges that end at a certain node.
Neighbor: Two nodes are neighbors if they are connected by an edge, irrespective of the edge direction.
Profile: A profile is the set of personal data a user reveals about herself. It contains the total number of in- and outgoing edges, the place(s) the user lives, the employer, etc. This paper focuses on publicly available (“crawlable”) user data only.
Distance: The distance between nodes is calculated based on latitude and longitude as given in a user’s profile. We use the Haversine formula to compute the great-circle distance between two points on a sphere. Distances between nodes do not imply an edge between the nodes.
Time Zone: The timezone of a node is also based on the coordinates taken from the profile. We give time zones in absolute numbers in relation to UTC .
We are interested in triangle motifs: the relationships between three Google users.
Definition II.1 (Triangle)
Three nodes form a triangle if and only if the subgraph spanned by the three nodes is weakly-connected, i.e., the nodes are connected if the edges were undirected.
Note that our triangle definition is rather general, as an edge does not have to exist between all pairs of users in the triangle, not even a directed one. Figure 1 enumerates all 13 non-isomorphic triangle types fulfilling Definition II.1. Theoretically, users can be involved in up to triangles.
Origin and Destination Type: To study how the relationship between three users changes, we compare the types of the corresponding triangles connecting them in two snapshots : the origin snapshot and the destination snapshot . Accordingly, we call the triple relationship in the origin triangle and the relationship in the destination triangle. Unless otherwise stated, we assume that and .
Type 0: Due to the fast growth of the network, many node triples form a triangle according to our definition only during a subset of the snapshots . To take into account triangles which only exist for a strict subset of the snapshots , we introduce the notion of Type 0 triangles: an instance of a Type 0 triangle is any relationship between three users who were connected according to a Type triangle in at least one other snapshot. As we will see, Type 0 triangles do provide insight, e.g., regarding the triangles built by new users. Implementation wise, Type 0 triangles also help us to track the same set of triples of nodes.
II-B Dataset and Methodology
Our methodology to find all triangles and what type they are works in two steps. 1) we search all groups of three nodes that are weakly connected, 2) we determine the type of each triple. The number of resulting triangles is very large. In fact we estimated the time to detect all the triangles in a single snapshot to consume several weeks and resulting in more disk space than we had available (3 TB). Apart from the challenge to store such enormous amounts of data it is also hard to process them later. So, for practical purposes, we decided to reduce the result space. In a first step we choose four of our 16 data sets, the first, the last, and two in between. In the second step we removed all nodes and their edges that do not give a meaningful location, i. e., that did not provide geo-coordinates. Since we wanted to learn more about the user relations in relation to their locations, e.g., the distances between friends.
From these, we select one hundred starting nodes uniformly at random, and then consider all triangles these nodes participate in. Within this step, all nodes and edges that are necessary to complete the triangles are added again to the data set. For each of the four snapshots, we start with the same set of 100 nodes. This method results in a set of data that is small enough to be further processed, but big enough to preserve the graph structure.
The sampling of the graph likely incurs a bias on the results. This is a well known fact and reported in previous work [10, Section 4.1.1] However similar work relies on similar problem space reduction techniques as we do [11, 10]. For a discussion of the bias of our methodology we refer the reader to Section VI.
| Graph (Date in 2011) | Number of (in Mio.) | |||
|---|---|---|---|---|
| Nodes | Edges | Triangles | ||
| Sep 7 | full | 19.6 | 278.3 | – |
| Sep 7 | locations only | 3.3 | 43.8 | – |
| Sep 7 | triangle-graph | 1.6 | 29.3 | 4.9 |
| Sep 20 | full | 20.7 | 294.4 | – |
| Sep 20 | locations only | 3.5 | 46.4 | – |
| Sep 20 | triangle-graph | 1.6 | 31.2 | 6.3 |
| Oct 4 | full | 36.2 | 388.3 | – |
| Oct 4 | locations only | 8.8 | 64.6 | – |
| Oct 4 | triangle-graph | 2.7 | 41.0 | 8.1 |
| Oct 20 | full | 38.6 | 476.9 | – |
| Oct 20 | locations only | 9.6 | 83.7 | – |
| Oct 20 | triangle-graph | 3.4 | 54.5 | 8.9 |
Table I gives an overview of the graphs considered in this paper. Here, “full” refers to the graph representing the entire snapshot. The step in between, stripping the graph of all nodes without location information, is referred to as “location only” triangles: graphs where nodes without location information in the profile are ignored (together with their incident edges). The “triangle-graph rand” category contains the triangles resulting from choosing one hundred starting nodes at random.
II-C Interpretation of Motifs
The Google+ “social search OSN” occupies a peculiar position between a friendship network and a news aggregator network. In this paper, we will sometimes interpret the semantics of different motifs accordingly (see also the discussion in Section VI): We argue that more symmetric motifs (where users are mutually connected) are an indication of a friendship relationship, while more asymmetric relationships suggest that a user follows someone he or she has not yet met in person.
| Name | Rank | Followers in full | % of Followers in full | |
|---|---|---|---|---|
| location only | triangle-graph | |||
| Britney Spears | 1 | 443854 | 62.11 % | 59.29 % |
| Mark Zuckerberg | 2 | 510132 | 45.74 % | 44.99 % |
| Paris Hilton | 3 | 336174 | 66.07 % | 64.72 % |
| Sergey Brin | 4 | 351943 | 58.57 % | 57.80 % |
| Jessi June | 5 | 275122 | 64.29 % | 63.31 % |
| Vic Gundotra | 6 | 277713 | 60.41 % | 60.09 % |
| Mark Cuban | 7 | 219765 | 61.66 % | 59.81 % |
| Thomas Hawk | 8 | 204357 | 61.84 % | 61.49 % |
| Trey Ratcliff | 9 | 205413 | 58.27 % | 58.11 % |
| Pitbull | 10 | 187610 | 62.23 % | 59.61 % |
We observe several indicators that lead to this interpretation. First, we observe that asymmetric links often point to users with a high in-degree. For example Table II shows the top-10 in-degree users. Depending on the connection between the followers the resulting triangle type is 4, 5, or 6. Second, as we observed earlier [9] the geographic distances spanned by asymmetric links are generally larger than for symmetric links.
III Motif Distribution: A First Look
| Data | Frequency of triangle type (in %) | ||||||||||||
|---|---|---|---|---|---|---|---|---|---|---|---|---|---|
| 1 |
2 |
3 |
4 |
5 |
6
|
7 |
8 |
9 |
10 |
11 |
12 |
13 |
|
| Sep 7 | 20.86 | 6.82 | 5.23 | 55.75 | 3.18 | 0.40 | 4.74 | 1.43 | 0.00002 | 0.08 | 1.16 | 0.28 | 0.03 |
| Sep 20 | 17.37 | 5.56 | 4.46 | 62.97 | 2.74 | 0.40 | 3.87 | 1.34 | 0.00006 | 0.07 | 0.96 | 0.26 | 0.03 |
| Oct 4 | 12.91 | 6.37 | 5.12 | 63.79 | 2.86 | 0.87 | 4.29 | 2.22 | 0.00005 | 0.08 | 0.90 | 0.46 | 0.14 |
| Oct 20 | 15.12 | 5.22 | 5.49 | 66.48 | 2.13 | 0.66 | 3.09 | 0.87 | 0.00024 | 0.05 | 0.68 | 0.20 | 0.02 |
We first study the frequency distribution of different motifs in Google snapshots. As one might expect, the distribution is quite skewed, see Table III: Type 4 is by far the most frequent motif, with over 50 percent of all triangles of this type. According to our motif interpretation, this means that a large fraction of users follows other users. The peculiar Type 9 is the least frequent motif: indeed, it describes a situation where three users are connected in a circular manner, where the circled user does not include the original user. Type 13 triangles (three mutually connected users) are quite rare: this can be seen as a further indication that Google is used for more than just keeping up with friends.
Another take-away from Table III is that triangles are typically sparse, i.e., triangles with the minimum of only two directed edges constitute the vast majority of all the triangles. Among the motifs where all three nodes are directly linked, Type 6 is quite frequent: it describes a situation where two mutually connected users (e. g., friends) follow the same third user. Much more frequent however is Type 5, where there is only an asymmetric link between two “followers”. Among the triangle motifs with at least one symmetric link, Type 3 and Type 7 occur most often—again, essentially the motifs with the least edges fulfilling the symmetric criteria.
IV Motif Dynamics
Active social networks are in a constant flux: new users join the system, existing users update their relationships over time, and others leave. This is particularly true for the young Google network: The observed period features a significant growth (the user base and number of triangles more than doubled), but many users also remove links during this period of growth: the fraction of triangles evolving into a sparser motif is quite large.
This section presents our first insights on how triangles change their type between crawled snapshots. Unless otherwise stated, we will focus on the triangles sampled for the snapshot (Sep 7), and compare a given triangle’s type in (the origin type or origin triangle) with its type in (the destination type or destination triangle). We first consider all triangle transitions including those from and to Type 0, in order to also understand the creation and destruction process of triangles. Then we focus on triangle to triangle transitions.
IV-A Triangle Transitions Including Type 0
Due to the fast growth of the user base, many triangles only emerge after snapshot or disappear before . Accordingly, in this section, we consider Type 0 triangles: user triples who formed a valid triangle for one or more snapshots in .
In our 6-week observation period we observe the majority of triangles changing type. We observe for 61.57% of node triples that at lease once form a triangle a change in their interconnection. This implies that a significant amount of transient dynamics within a social network may be lost when only the triangles present in the original or final snapshot are considered.
| 0 | 1 | 2 | 3 | 4 | 5 | 6 | 7 | 8 | 9 | 10 | 11 | 12 | 13 |
|---|---|---|---|---|---|---|---|---|---|---|---|---|---|
| 100.0 | 32.2 | 16.5 | 20.5 | 20.0 | 9.8 | 10.9 | 21.2 | 27.8 | 100.0 | 18.4 | 12.2 | 9.4 | 11.5 |
Table IV shows the probability that a certain type changes. Note, that all Type 0 triangle need to change, per definition. Also note that there is only one Type 9 triangle in the first snapshot. For the other types we observe quite varying change probabilities. This indicates that some types are more stable than others. Types 5, 6, 11, 12, and 13 are the most stable ones with change rates around 10 %. Types 1 and 8 expose the highest change rates around 30 %. Overall however most triangle do not change at all.
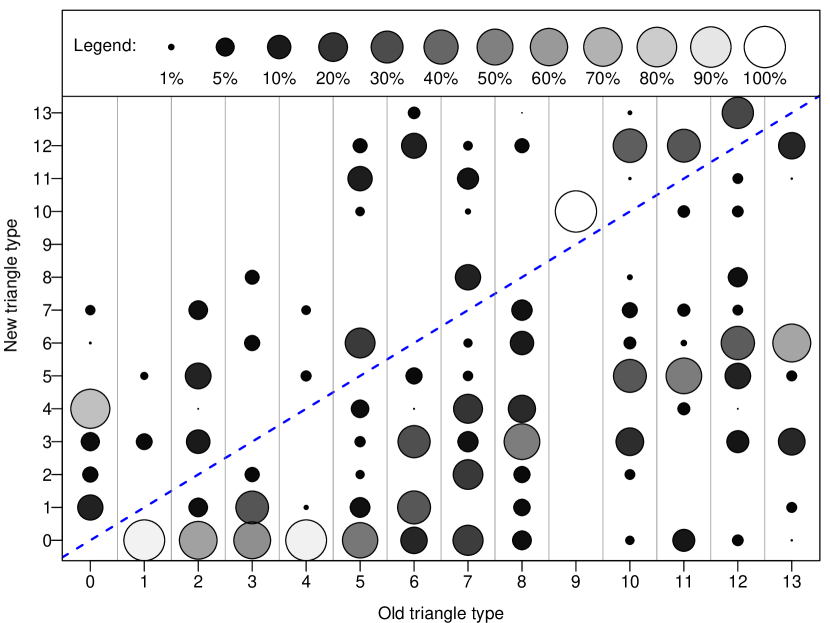
Figure 3 shows the distribution of destination types triangles transition into per origin triangle type. So for example the plot shows that in relation to all transitions with an origin Type 4 (), 94.6 % turn into a Type 0 triangle (), and Type 5, 7, and 1 are the next most likely destination with 1.8 %, 1.5 %, and 0.8 %. Note that we only plot a circle when the transition probability is higher than 0.5 %.
Transitions below the diagonal in Figure 3, indicate a degeneration of the triangle, typically involving the loss of an edge. Looking at the figure it is obvious that more triangles degenerate (below the diagonal) as compared to those that strengthen their relation (above the diagonal). It is also apparent that Type 0 is the most likely destination for origin types 1 through 5, i. e., those triangles disintegrate. For the better connected triangle types 10 through 13, however types 5 and 6 are the most likely destination types.
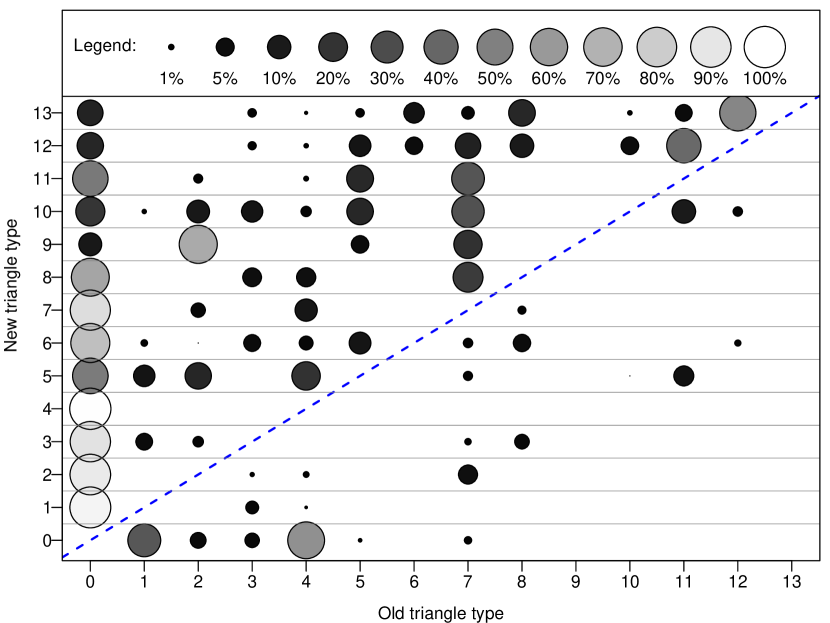
In Figure 2 we now look at the origin type instead of the destination type. Here, for almost every destination type (y-axis), except types 9, 10, 12, and 13 we see that Type 0 is the most likely origin type. Yet, interesting enough around 14 % of types 12 and 13 evolve directly from Type 0. Obviously, our snapshots are two far apart to capture the full dynamics, but none the less this indicates that Type 13 triangles can be created in short time frames of around 2-weeks.
This general trend towards sparser motifs may have multiple possible reasons, including changes in privacy settings (i. e., thereby hiding links from our crawling method), people dropping out from Google, or active pruning of users from Circles due to changing interests. We expect that most of the vanishing edges are due to changes in privacy settings, however in some occasions it is reasonable to expect that users stop to follow another user for various reasons, including but not limited to a too high posting frequency, to boring content shared by the followed, or actual change in off-line relationships. However, our data does not provide direct evidence to argue about which of the reasons is more prevalent.
IV-B Triangle-to-Triangle Transitions
Given the large impact of transitions involving Type 0, we now turn to triangles that already existed in , and whose user triple still formed a connected triangle in .
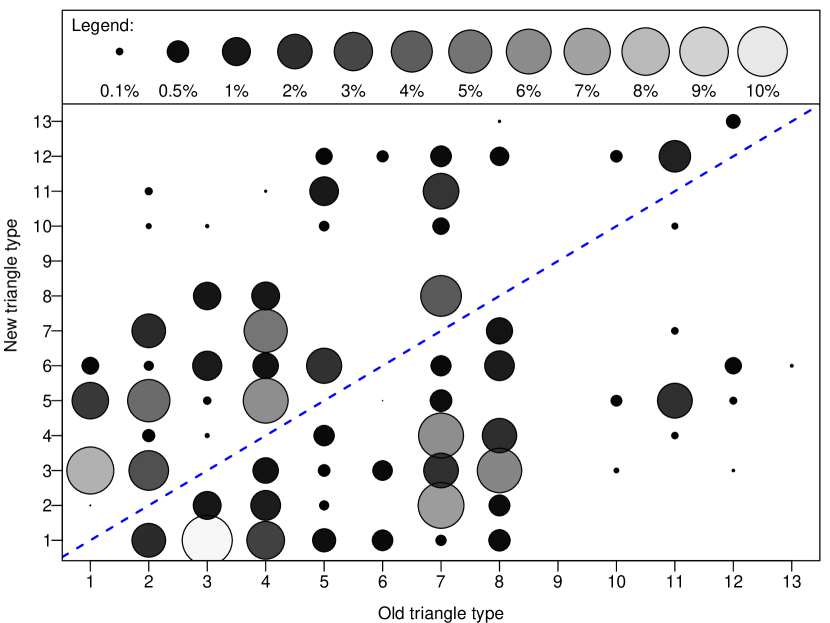
Table V gives an overview of frequencies of all transitions (i. e., not per type), see also Figure 4 for a graphical representation. Without Type 0 triangles, 4.12 % of the triangles in the first snapshot changed to a different type in the last snapshot .
| 1 | 2 | 3 | 4 | 5 | 6 | 7 | 8 | 9 | 10 | 11 | 12 | 13 | |
|---|---|---|---|---|---|---|---|---|---|---|---|---|---|
| 1 | — | 0.055 | 7.653 | 0.006 | 2.473 | 0.297 | 0.000 | 0.023 | 0.000 | 0.008 | 0.027 | 0.009 | 0.001 |
| 2 | 1.835 | — | 3.442 | 0.184 | 4.626 | 0.131 | 1.827 | 0.032 | 0.009 | 0.085 | 0.106 | 0.010 | 0.000 |
| 3 | 10.599 | 0.986 | — | 0.077 | 0.109 | 1.122 | 0.028 | 0.942 | 0.000 | 0.071 | 0.000 | 0.050 | 0.006 |
| 4 | 2.824 | 1.204 | 0.762 | — | 6.104 | 0.760 | 5.039 | 0.981 | 0.000 | 0.017 | 0.063 | 0.031 | 0.003 |
| 5 | 0.588 | 0.132 | 0.173 | 0.443 | — | 2.131 | 0.001 | 0.000 | 0.001 | 0.138 | 1.066 | 0.280 | 0.006 |
| 6 | 0.450 | 0.005 | 0.407 | 0.007 | 0.052 | — | 0.001 | 0.001 | 0.000 | 0.001 | 0.000 | 0.164 | 0.029 |
| 7 | 0.149 | 6.740 | 2.027 | 6.140 | 0.505 | 0.428 | — | 3.880 | 0.002 | 0.291 | 2.253 | 0.456 | 0.010 |
| 8 | 0.491 | 0.468 | 5.802 | 1.969 | 0.049 | 1.188 | 0.813 | — | 0.000 | 0.003 | 0.004 | 0.357 | 0.063 |
| 9 | 0.000 | 0.000 | 0.000 | 0.000 | 0.000 | 0.000 | 0.000 | 0.000 | — | 0.001 | 0.000 | 0.000 | 0.000 |
| 10 | 0.001 | 0.008 | 0.082 | 0.001 | 0.158 | 0.010 | 0.016 | 0.004 | 0.000 | — | 0.003 | 0.170 | 0.004 |
| 11 | 0.008 | 0.005 | 0.020 | 0.098 | 2.066 | 0.043 | 0.101 | 0.002 | 0.000 | 0.093 | — | 1.442 | 0.018 |
| 12 | 0.003 | 0.003 | 0.065 | 0.004 | 0.104 | 0.283 | 0.014 | 0.045 | 0.000 | 0.015 | 0.014 | — | 0.217 |
| 13 | 0.002 | 0.000 | 0.016 | 0.000 | 0.002 | 0.067 | 0.000 | 0.000 | 0.000 | 0.000 | 0.001 | 0.015 | — |
We extract several take-away’s from Table V and Figure 4. First, we observe that the transition probabilities are rather asymmetric. This indicates that the distribution of motif frequencies, and hence the character of the topology, is changing over time. Another interesting observation is that the rate of change, as well as the most likely predecessor and successor types, depend on the triangle type. Taking into account the relative frequencies of the corresponding types (see Table III), we can compute the relative change frequency per type, see Table VI; the table also includes the most frequent predecessor and successor type for each triangle. The table shows that over 25 of all Type 8 triangles change between and . Type 10 and Type 7 also change very frequently (more than ). In contrast, Types 1, 2, and 5 are quite stable (change rate around 5). Maybe surprisingly, the change frequency of Type 9 is low; however, due to the small absolute number of triangles of this type, we believe that statistical significance is insufficient. Table VI also shows that for some triangle types, namely Types 1, 3, 7, and 8, the predecessor and the successor types are the same.
| type | pred | succ | freq |
|---|---|---|---|
|
|
|
|
2.4 |
|
|
|
|
6.7% |
|
|
|
|
10.1% |
|
|
|
|
1.3 |
|
|
|
|
5.4 |
|
|
|
|
9.4 |
|
|
|
|
17 % |
|
|
|
|
26.6 |
|
|
|
|
0.0 |
|
|
|
|
18.2 |
|
|
|
|
11.3 |
|
|
|
|
9.2 |
|
|
|
|
11.4 |
V Motif Contexts
Triangle types differ by much more than just their statistical frequencies. While a semantic characterization of different directed triangles is beyond the scope of this paper (see Section VI for a short discussion), this section gives some insights into the context in which a triangle usually appears.
Concretely, we investigate the correlation between triangle type and user degrees. While naturally, many Type 4 triangles are likely to occur together, in the sense that the circled user is a celebrity with a high in-degree (describing other Type 4 triangles), we will see that the triangle degrees also correlate with the change rate of the corresponding triangles.
Subsequently, we will take into account additional, publicly available profile data, and show that different triangle types also differ in the distances spanned by their edges.
V-A Relationship Between Types and Degrees
Figure 5 shows the out-degrees of nodes participating in a certain triangle type: Figure 5 (top left) studies triangles that win edges over time, i.e., transition into a stronger connected type, Figure 5 (top right) studies triangles that loose edges over time, and Figure 5 (bottom) shows the node degrees per triangle type for all triangles that stay the same type over time.


| Data | 1 | 2 | 3 | 4 | 5 | 6 | 7 | 8 | 9 | 10 | 11 | 12 | 13 |
|---|---|---|---|---|---|---|---|---|---|---|---|---|---|
| # of triangles within three neighboring timezones | 417607 | 63132 | 234476 | 774584 | 9883 | 30913 | 40682 | 20795 | 2 | 80 | 1215 | 826 | 515 |
| percent of triangles within three timezones | 30.91 | 13.55 | 47.77 | 13.04 | 5.20 | 52.13 | 14.75 | 26.84 | 9.53 | 1.66 | 2.00 | 4.62 | 26.17 |
| percent of triangles within one timezone | 22.92 | 8.53 | 39.40 | 6.43 | 3.88 | 48.73 | 10.18 | 22.17 | 9.53 | 1.06 | 1.25 | 3.58 | 23.12 |
| types in general (percent of whole set) | 15.12 | 5.22 | 5.49 | 66.48 | 2.13 | 0.66 | 3.09 | 0.87 | 0.00024 | 0.05 | 0.68 | 0.20 | 0.02 |
V-B Geographic Distribution
To complement and extend our topological study, we also crawled the publicly available user profile data, focusing mainly on geographic locations (taken from ). Based on this information, we can provide evidence for our hypothesis that symmetric links are more likely to describe person relationships while asymmetric links describe a follower or “news-reader” relationship (see Section II).
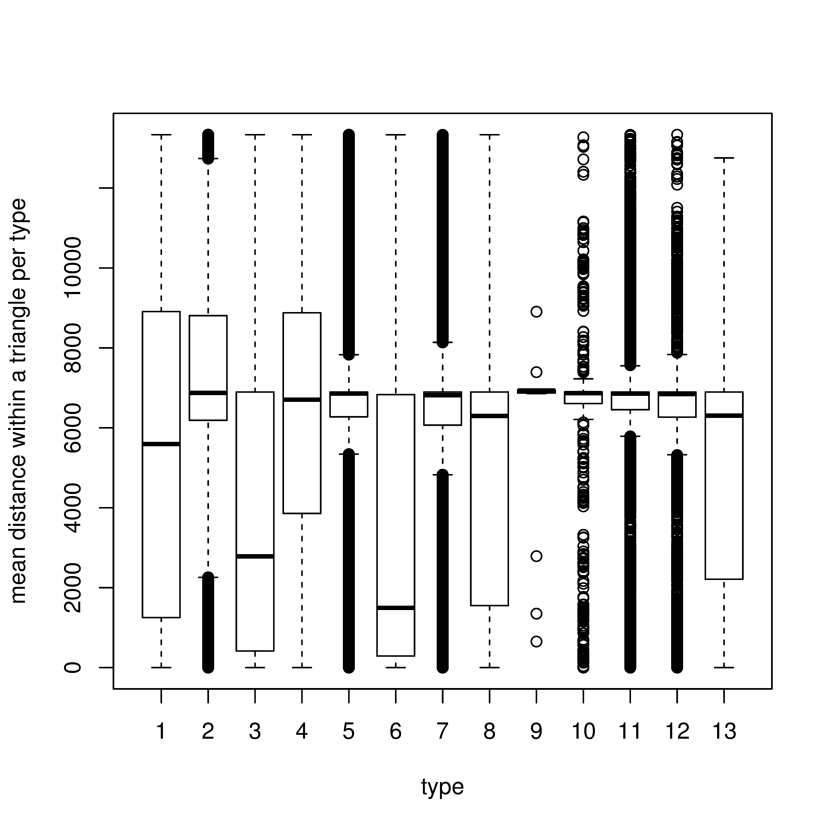
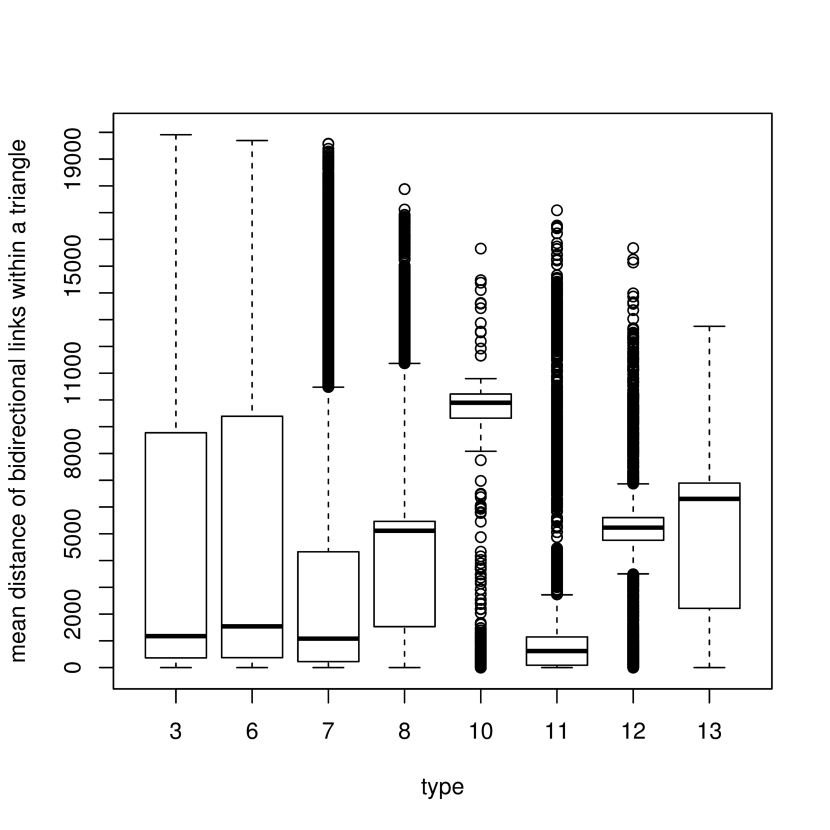
Figure 7 shows the mean of the distances per triangle, grouped by motif types, and Figure 8 plots the mean distance of bidirectional links in triangles. We observe that the mean distances of bidirectional links are much shorter, indicating that bidirectional links really seem to be among people who have a personal contact, i.e., know each other. When focusing on the average distances in triangles, the impact of one-directional links is quite large, making the overall distance more uniform despite the naturally large variance.
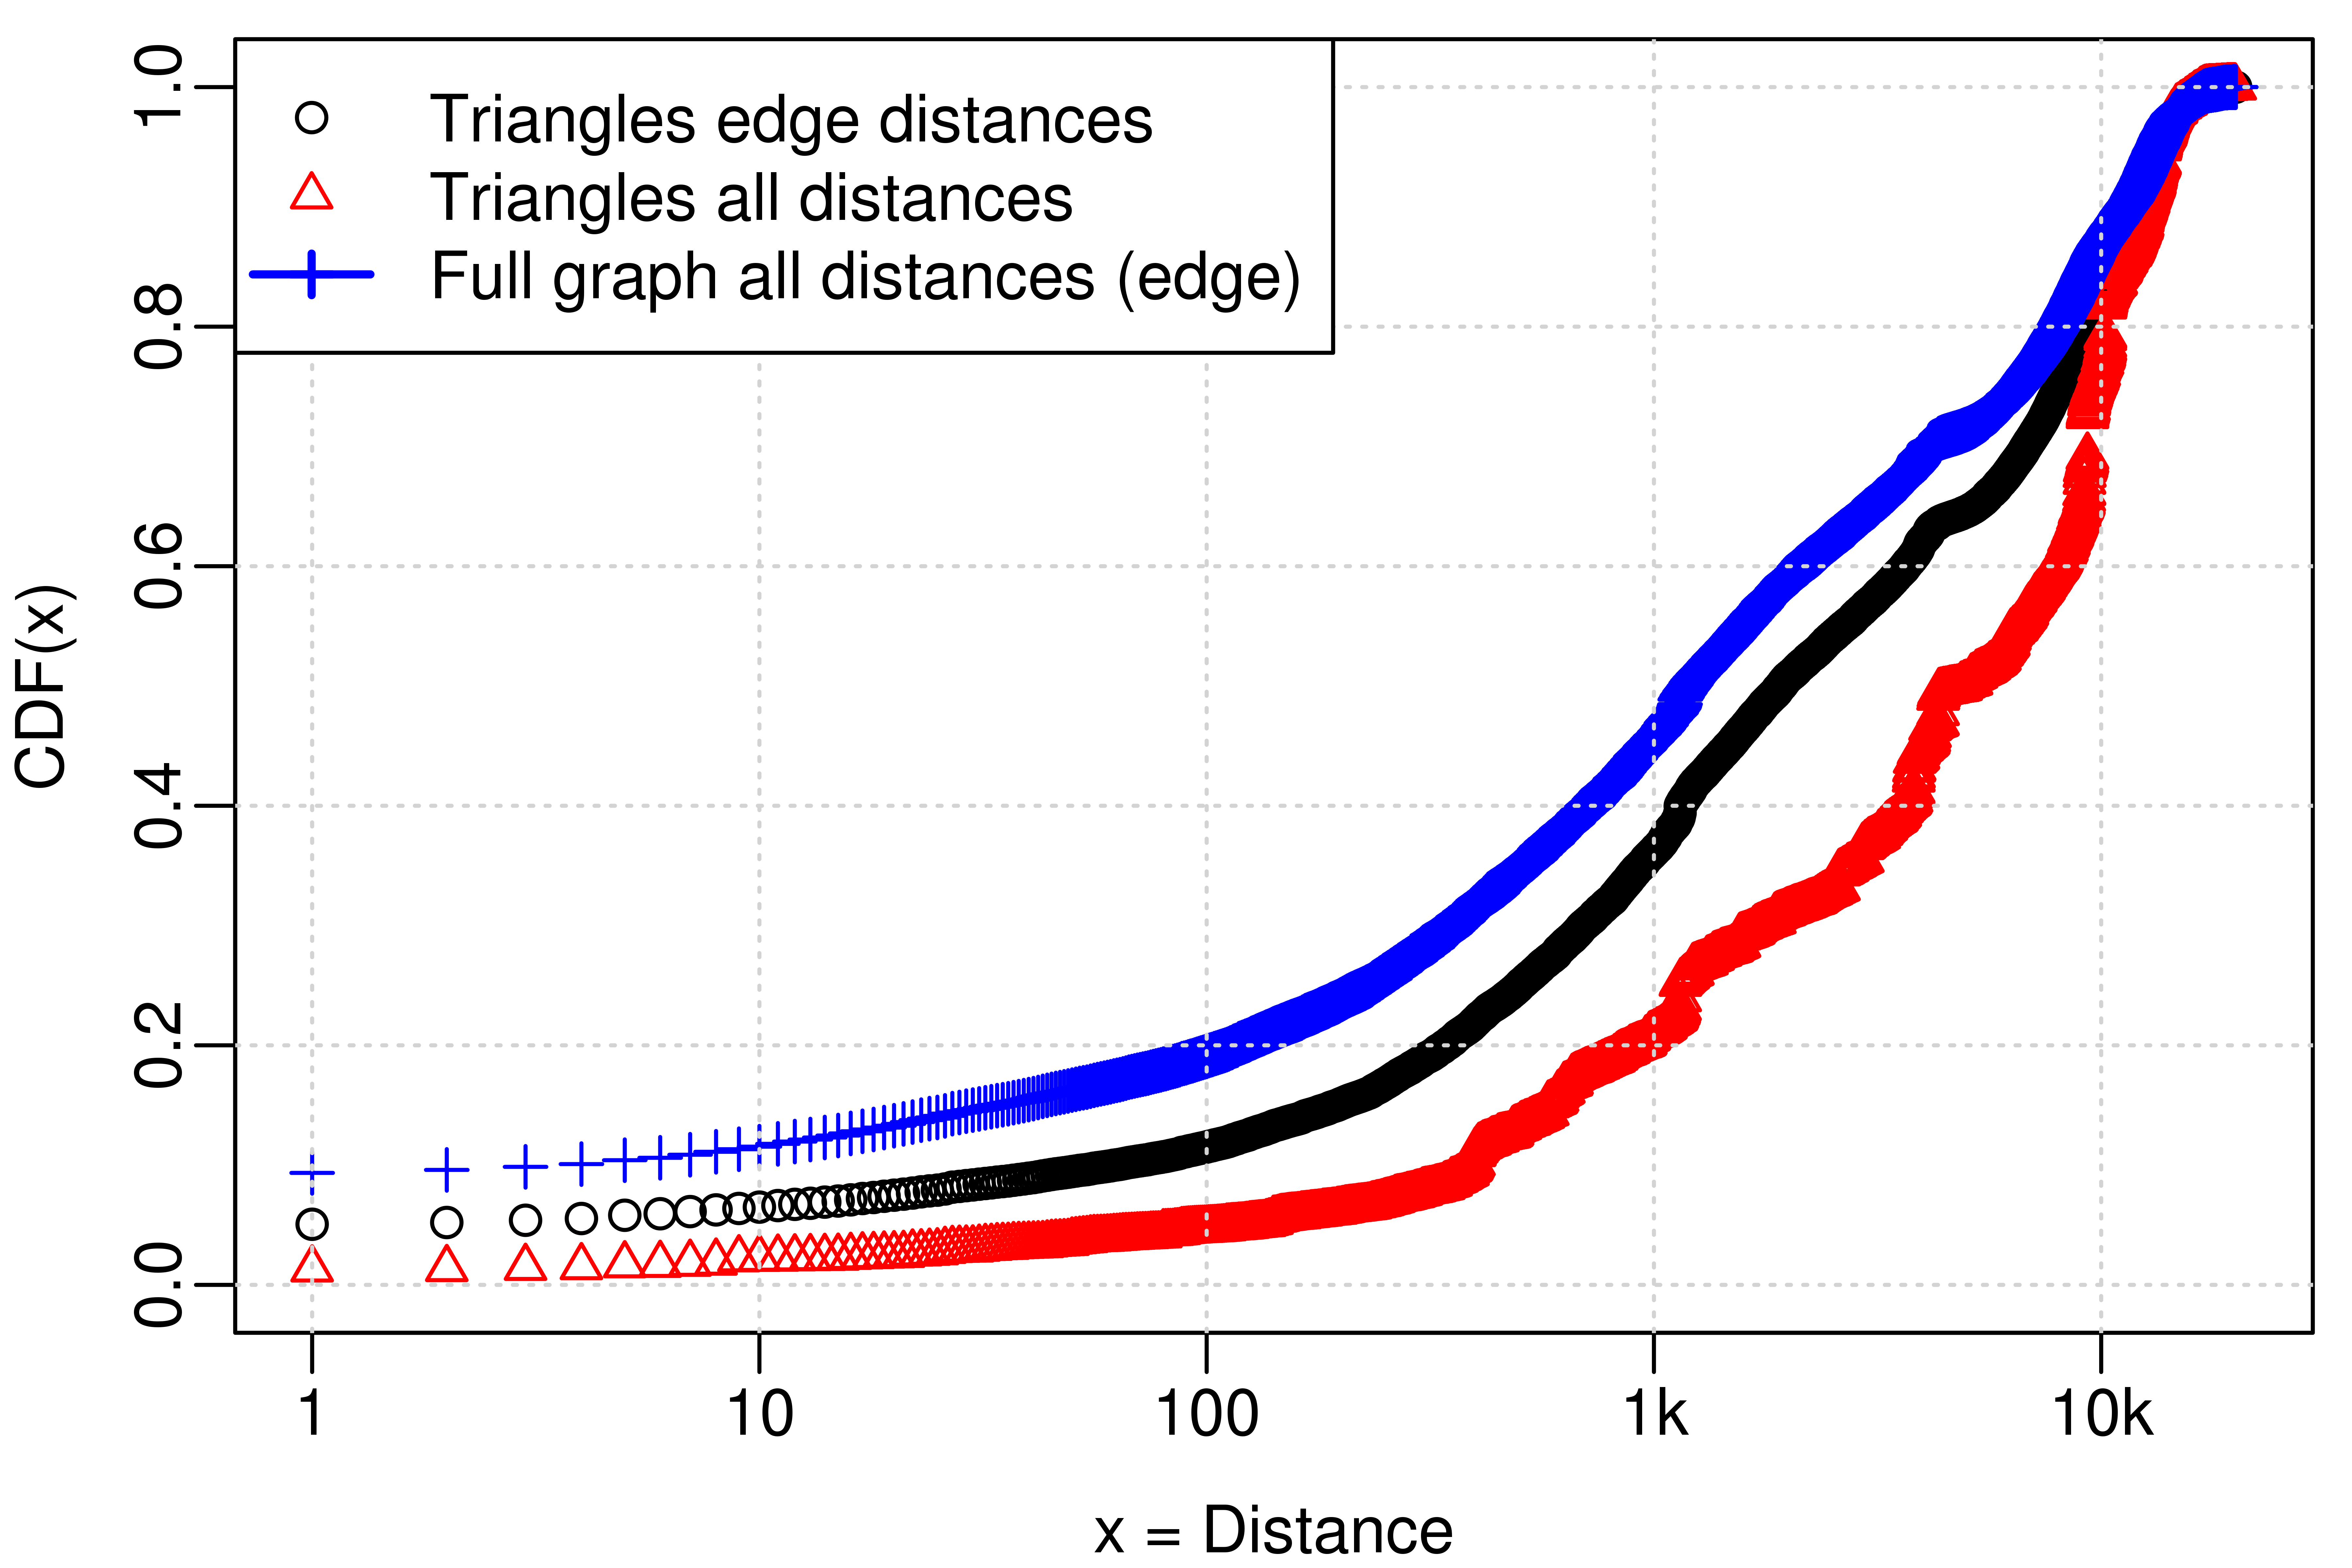
For comparison purposes, Figure 9 shows the CDF of the distances between the users for all distances we know, for the edges in the triangles, and for the users within a triangle. We calculate the distance between the users in a triangle even if there is no edge between those users. This is motivated by our assumption that all users in a triangle are somehow related to each other (at least transitively), so the distance of all participants matters. This figure highlights the bias on the distribution by accounting for these additional distances.
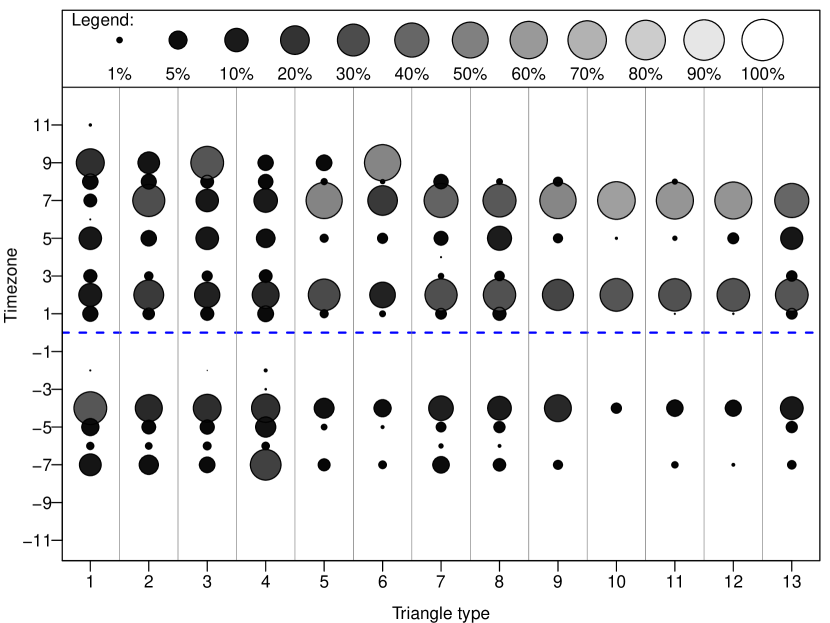
Finally, we also consider the different timezones users are located in. Figure 6 gives an overview of the time zones of Google+ users in general, and Table VII studies on the number of triangles with users which are less than three time zones away from each other. Looking at the distances in km, we can see now that the users in triangles of Type 3 and 6 are closest: around half of the triangles of that type are within 2 timezones. For Type 8 and 13, this is only a third of all triangles.
VI Discussion
We now discuss the shortcomings of relying on snapshots, especially how they are related to the challenges that have to be overcome to observe the motif dynamics within an online social network such as Google.
Relying on snapshots has the following limitations:
-
(L1)
Data provides limited resolution over time.
-
(L2)
A snapshot does not describe a single point in time, but crawling a full snapshot does not scale and took almost a day.
-
(L3)
All triangles could not be studied due to the combinatorial complexity of the triangles, only a random sample.
One implication of Limitation (L1) is that the motif dynamics will be underestimated: a user triple can be of the same triangle type in two snapshots, but may have gone through a sequence of changes between—unnoticed. We believe that the fraction of changes we overlooked this way is relatively small, but in general, our results on the change rate must be understood as a conservative lower bound.
Also Limitation (L2) comes with certain implications. Generally, snapshots spanning longer time periods cannot be used to study the causality of certain interactions. However, we in this paper did not study such direct or causal interactions, hence we argue that the assumption is less critical.
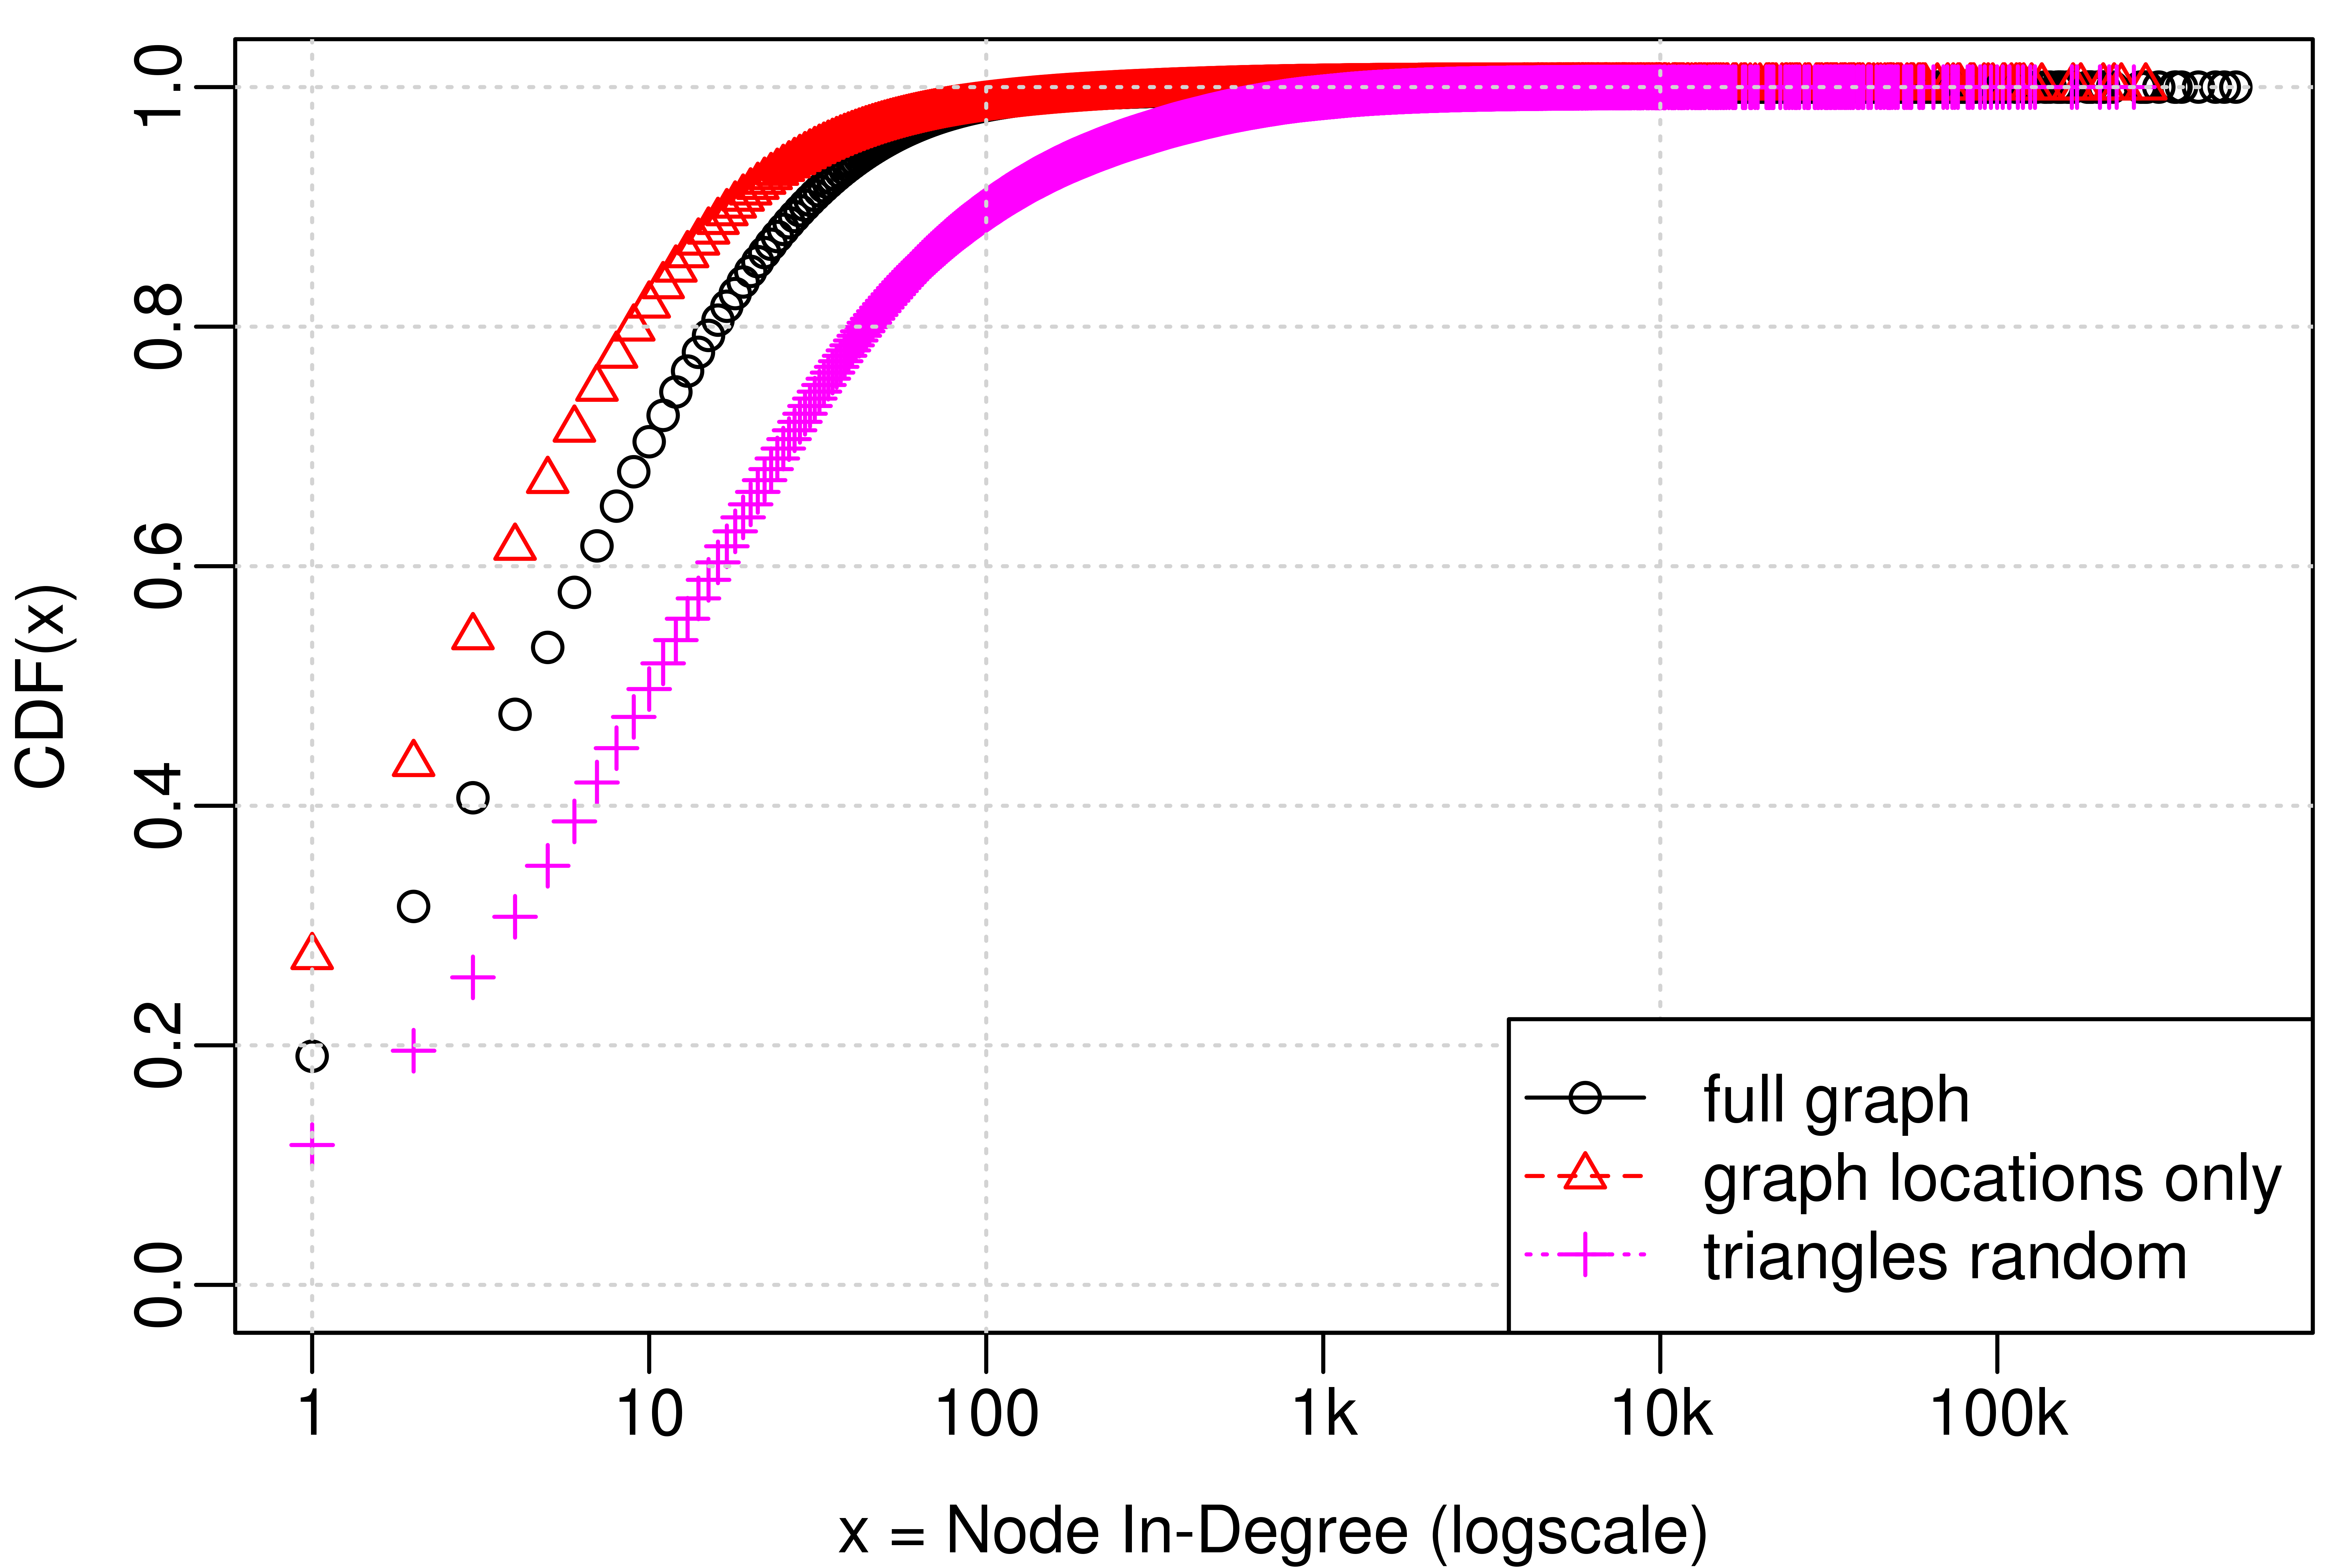
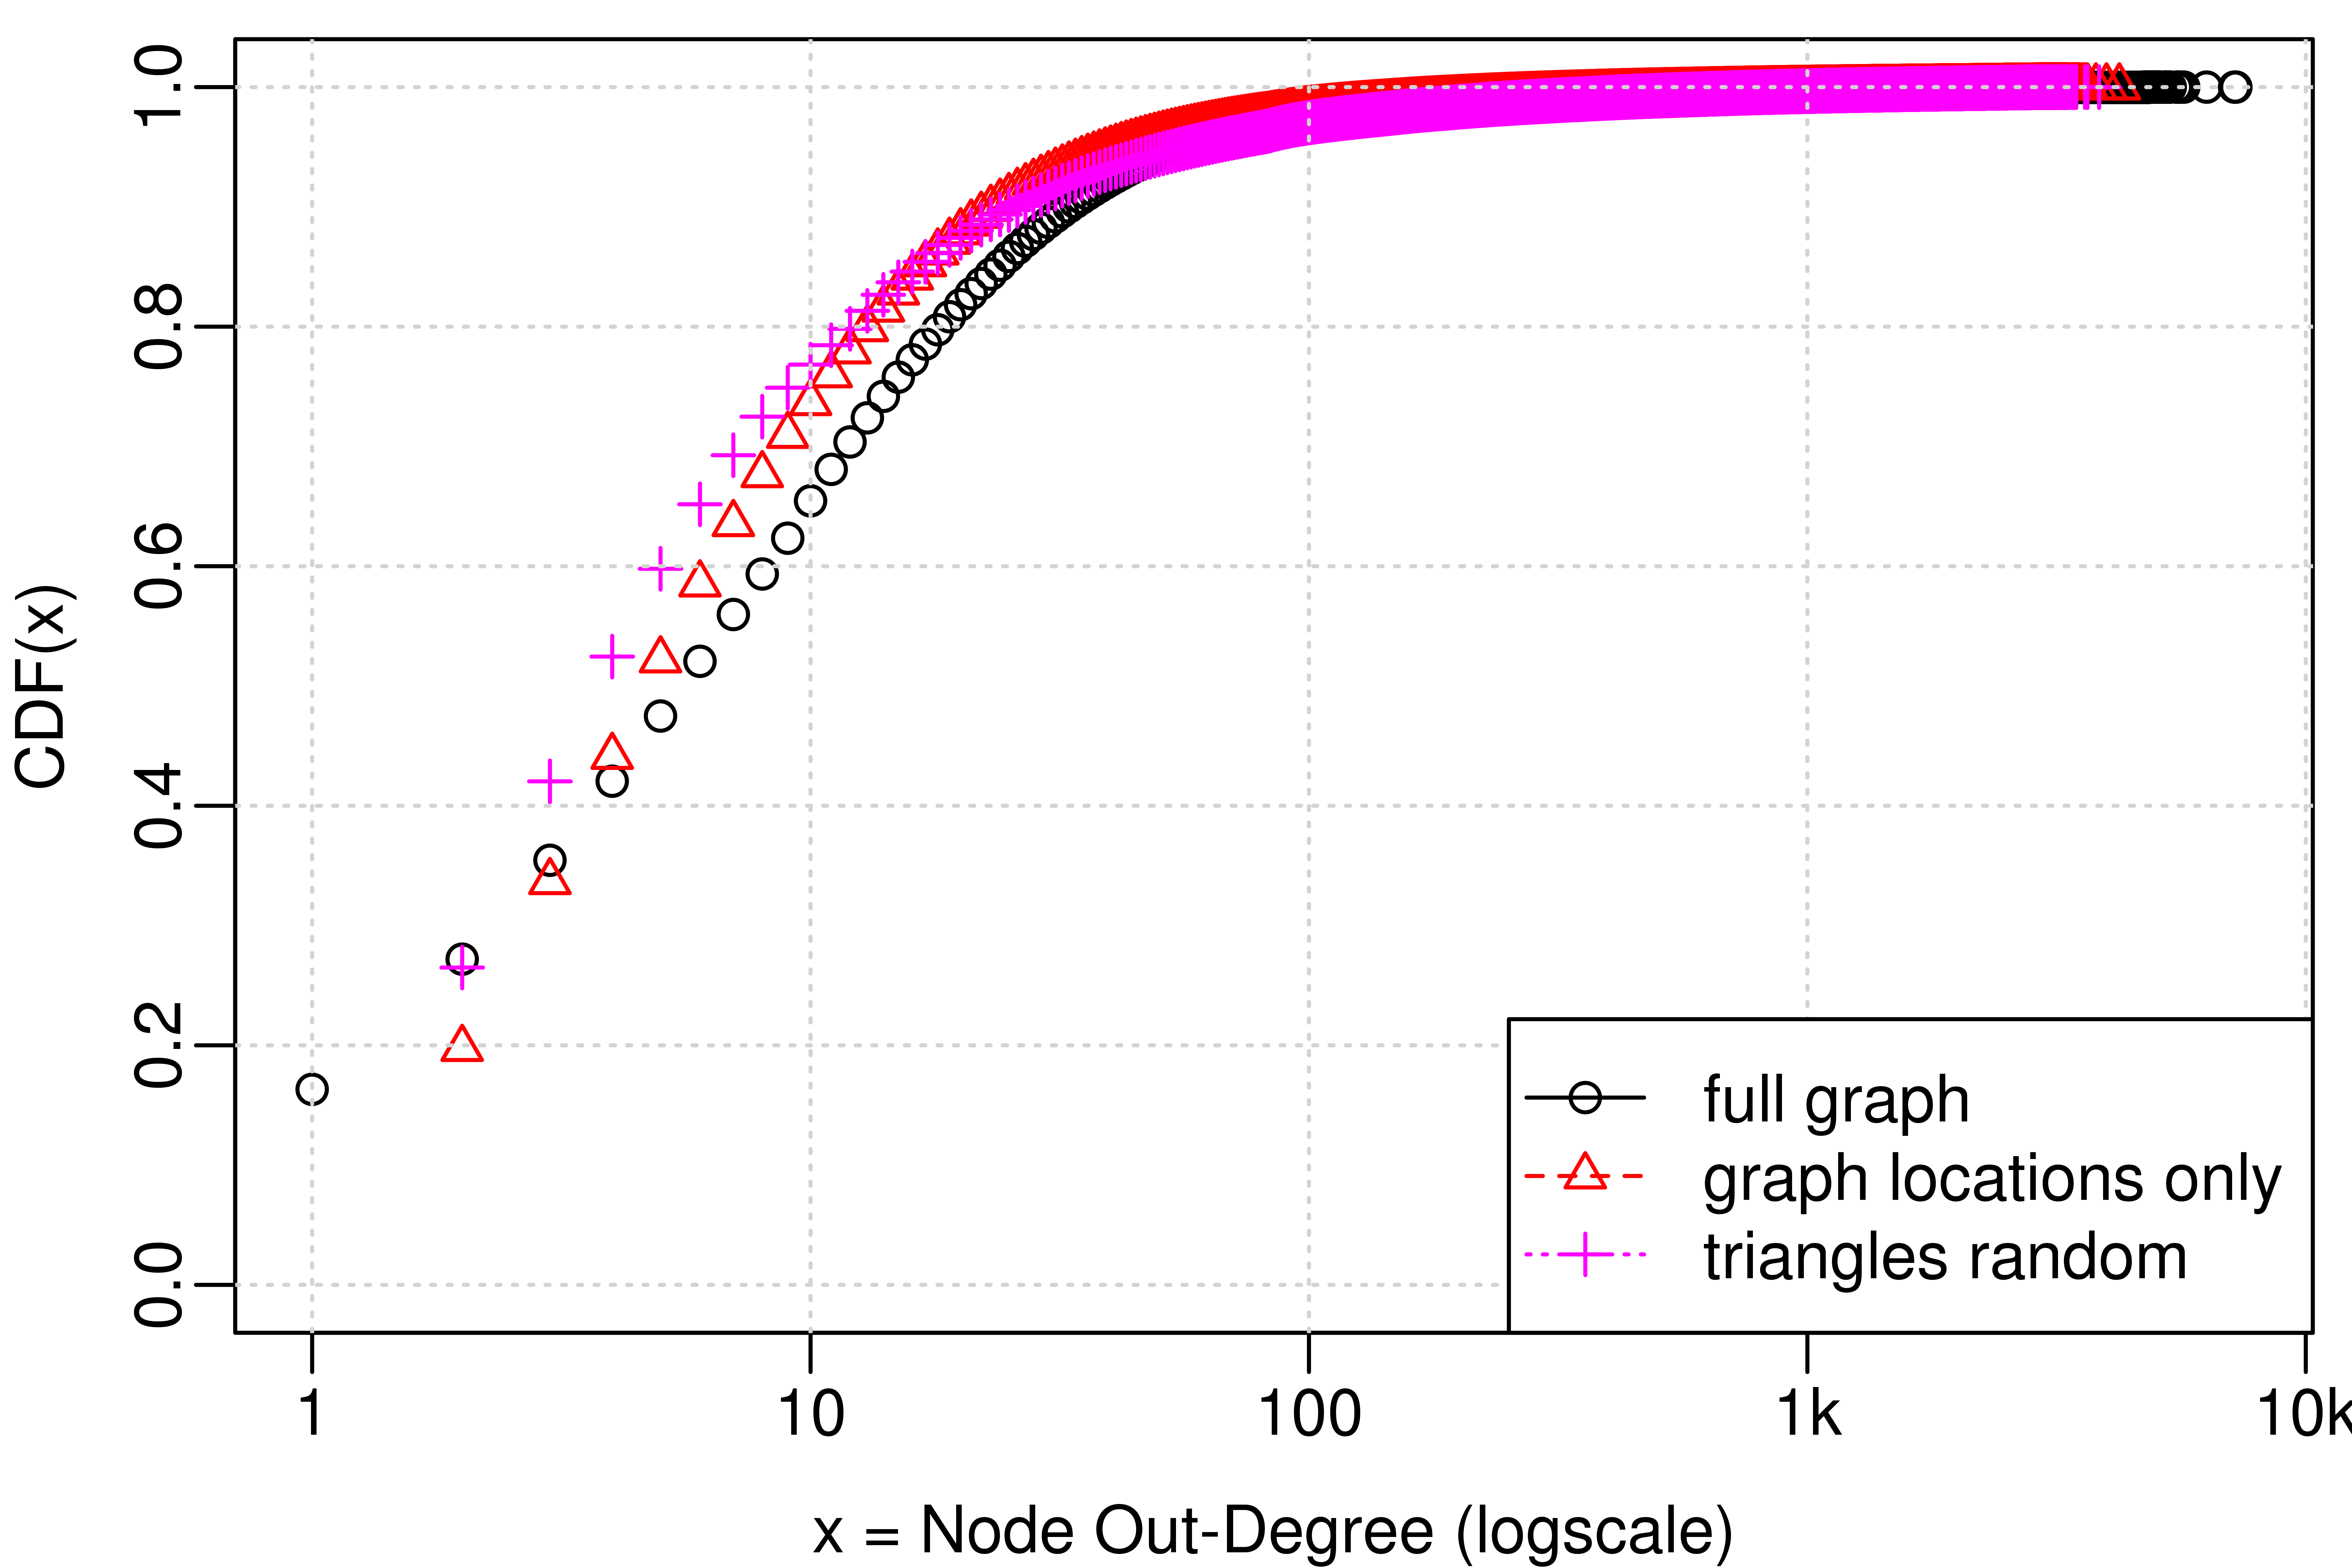
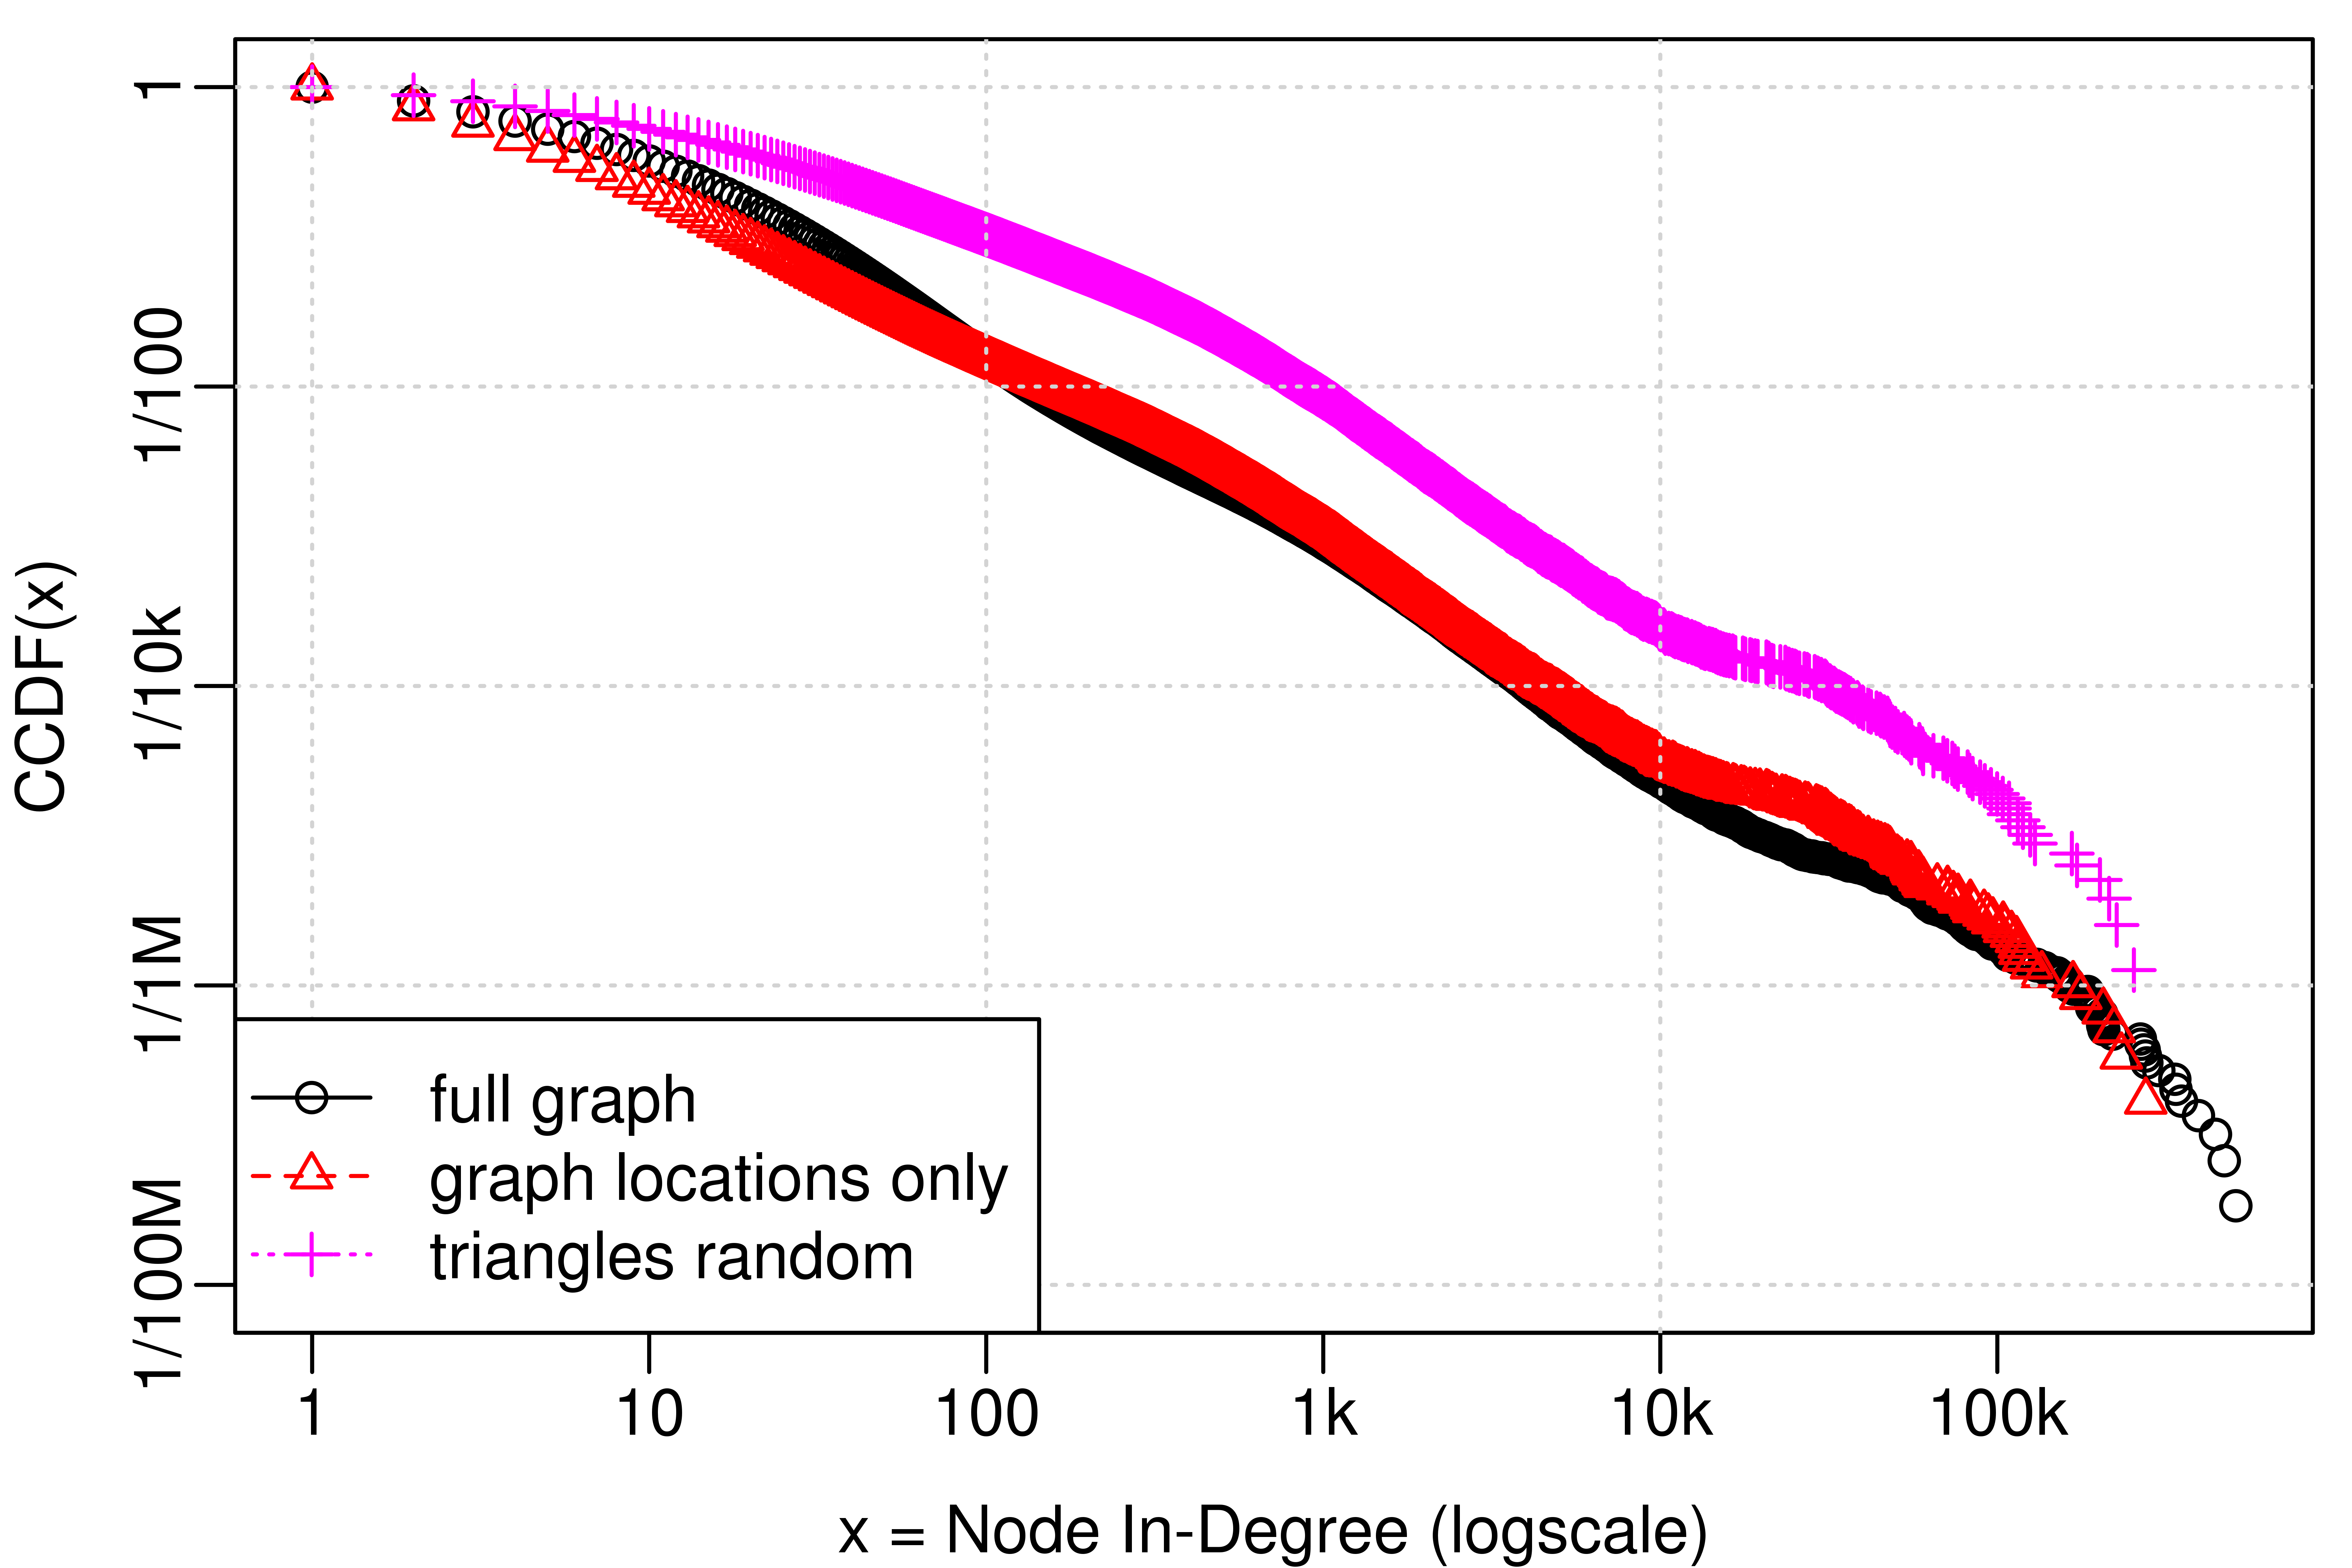
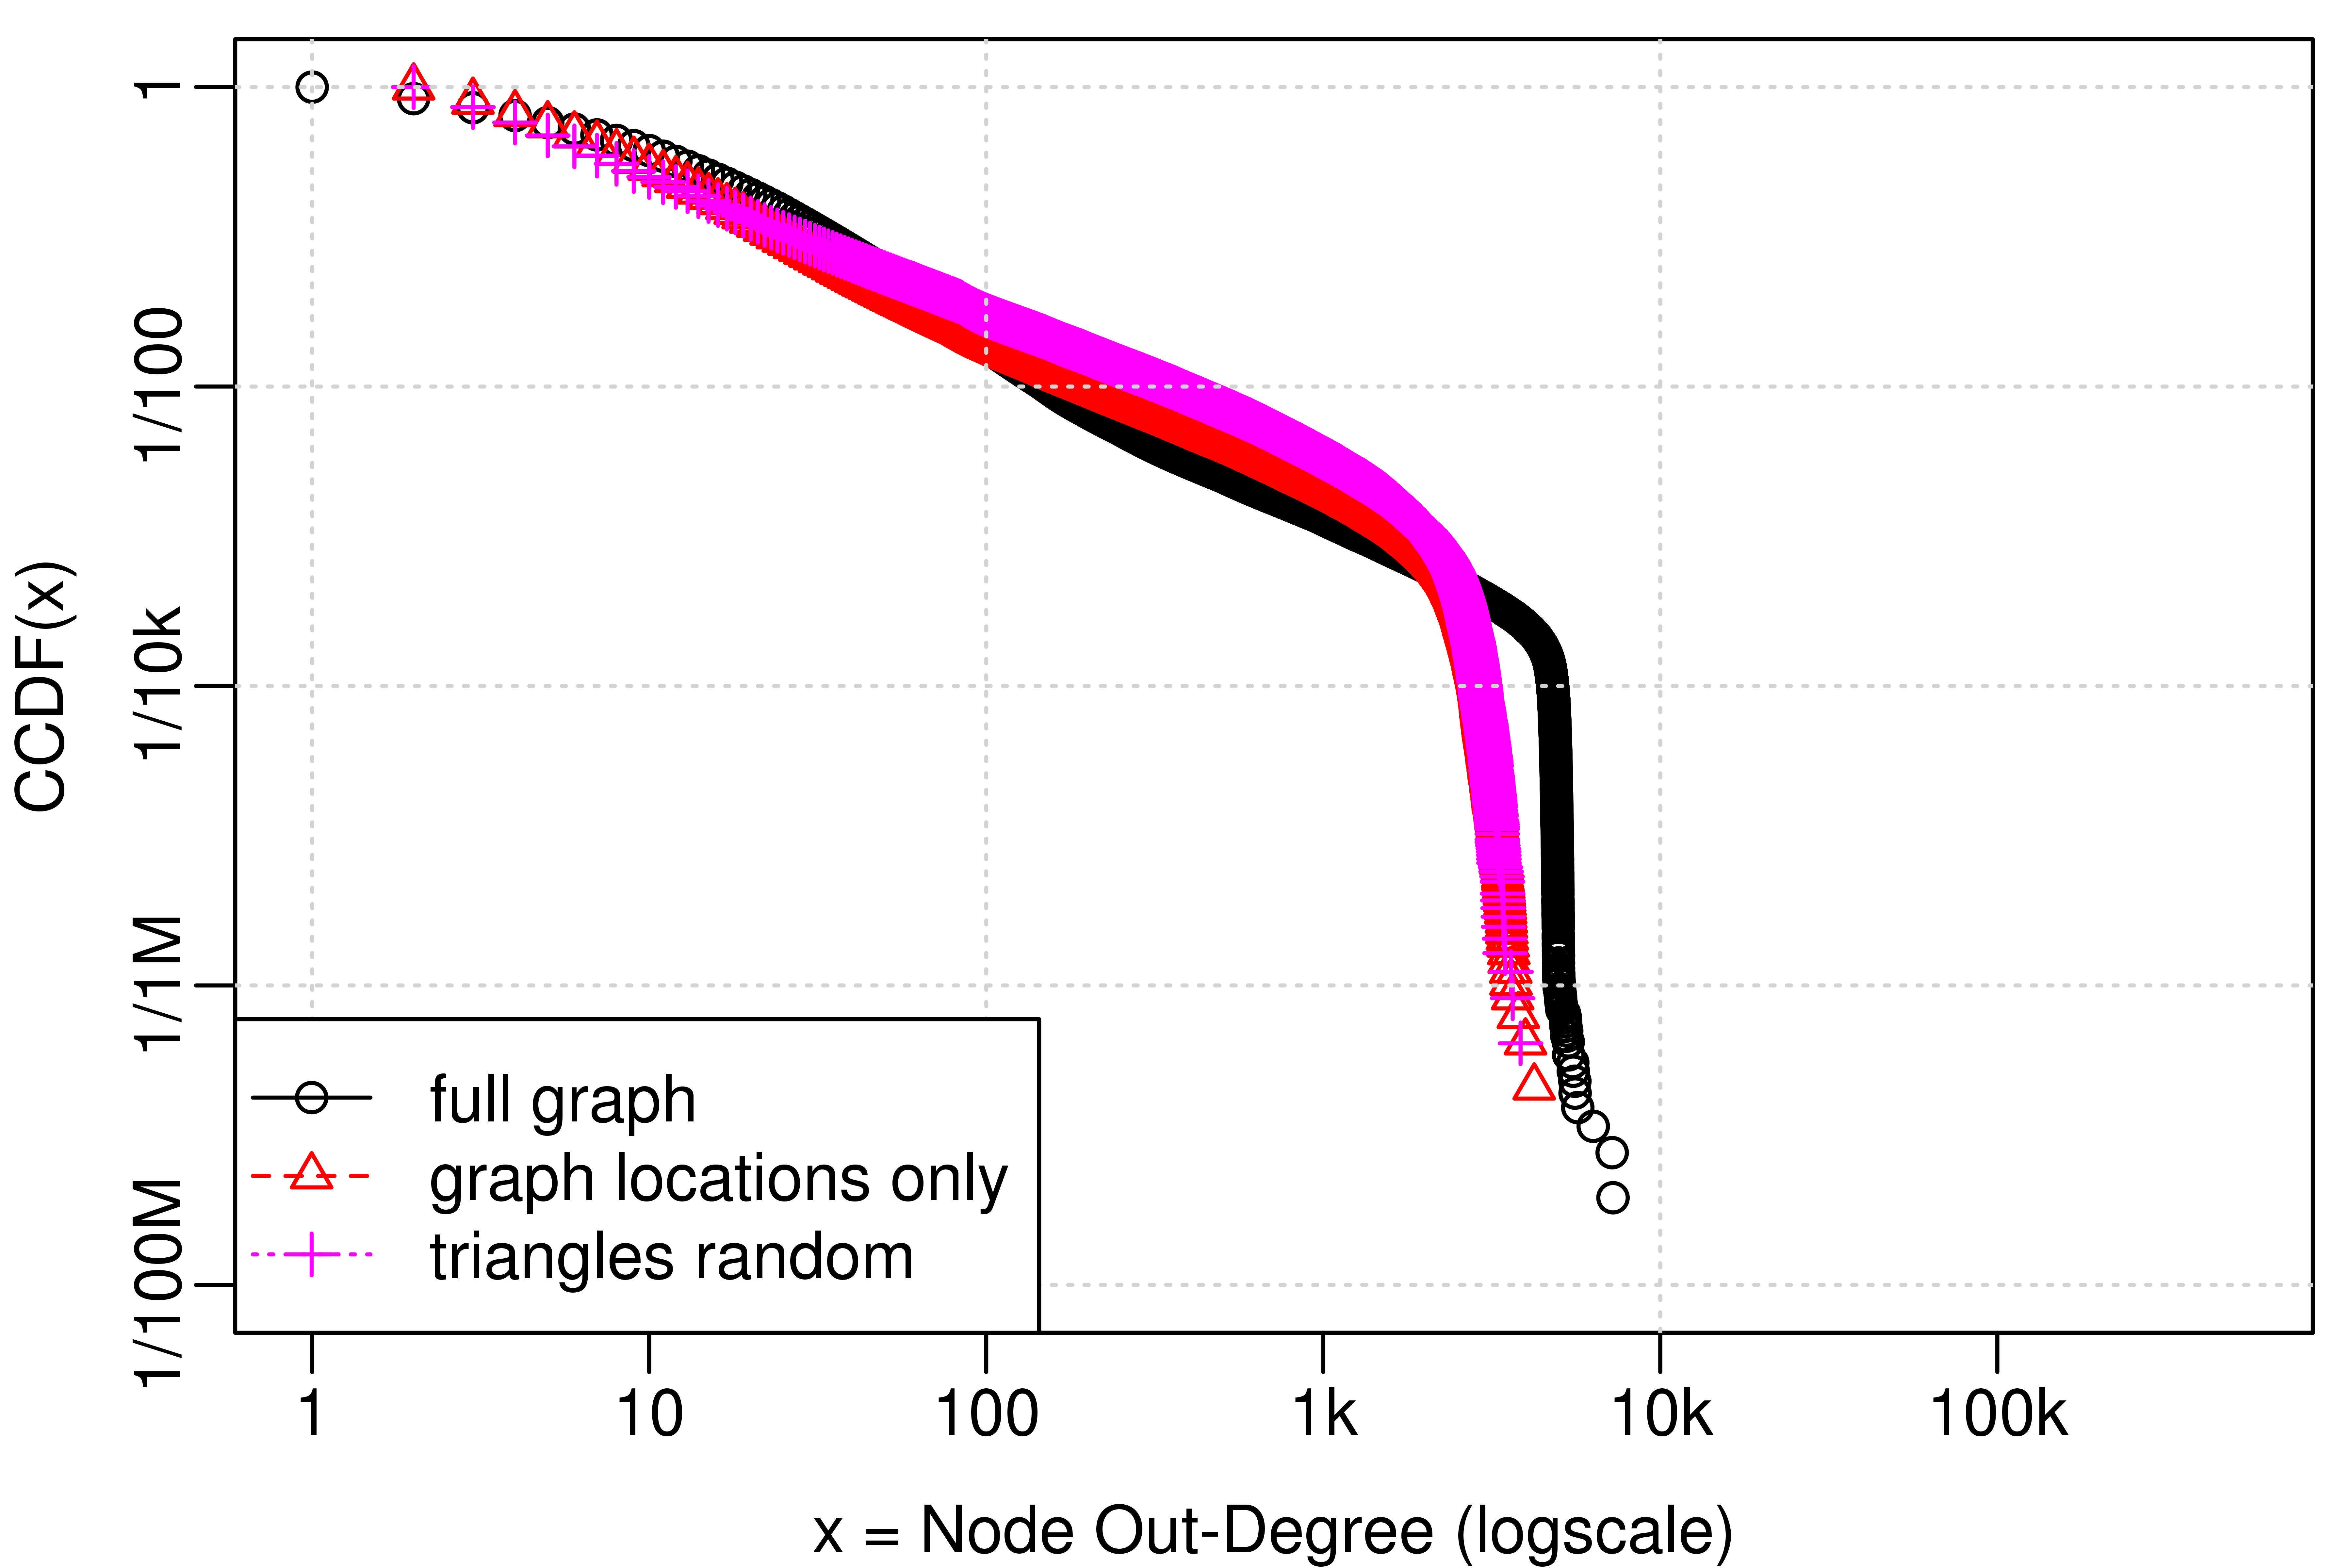
Limitation (L3) however is important: the focus on locations as well as the sampling process comes with a certain bias. In the following, we will provide evidence that while the sampling process does play a role in our plots, the general nature of the system is preserved. Figure 10 shows the CDF and CCDFs for both in- and out-degree-distributions after each reduction and sampling step. The differences in the CDF are obvious: the heads of the distributions differ in their nature, although the absolute numbers are relatively small. However, we argue that more relevant for our study are the tail distributions, i.e., the CCDFs. Here, the different samples are more similar. Moreover, the differences do not concern the general shape of the curve, but are rather shifted.
While this is good news and indicates that our sampling methodology does not influence the qualitative results much, a more rigorous analysis, also of additional properties, needs to be conducted.
Let us conclude with a remark on the interpretation of the triangles. Any large empirical study as ours is bound to aggregate and ignore many important details. For example, in our case, all we know about the users is some geographic location and their connectivity. Accordingly, restricting ourselves to the 13 triangle types and giving users of the same type a common interpretation is problematic. Although maybe large geographic distances, asymmetric links and high in-degrees may suggest that users do not know each other in person, this may not be true in general. Therefore, in this paper, we try to avoid the semantic interpretation of the different triangle types, and leave this for future sociological studies. All we can offer is some statistical interpretations.
VII Related Work
Researchers have been fascinated by the topological structure and the mechanisms leading to them for many years. While early works focused on simple and static networks [12], later models, e.g., based on preferential attachment [13], also shed light on how new nodes join the network, resulting in characteristic graphs. Nevertheless, today, only very little is known about the dynamics of social networks. This is also partly due to the lack of good data, which renders it difficult to come up with good methodologies for evaluating, e.g., link prediction algorithms [14, 15].
Motifs and Triangles. Graph structures are often characterized by the frequency of small patterns called motifs [16, 1, 17, 18], and also known as graphlets [19], and structural signatures [20]. The efficient computation of more complex motifs is of independent interested, and the reader is referred to the corresponding literature, e.g., [17].
Our paper focuses on the most simple triangle motif, whose importance has been observed in many contexts. For example, triangles are of interest for the study of community detection algorithms [21], and also the frequently studied clustering coefficient [22] is defined based on triangles. The clustering coefficient has many applications [7, 4, 8]; to give just one example, the clustering coefficient has recently been interpreted as a curvature [23] and it has been shown that connected regions of high curvature on the WWW characterize similar topics.
Many existing concepts, such as the clustering coefficient, are based on undirected triangles. However, also directed triangles have already been proposed to compare graphs, e.g., in [24, 20, 25]. In [6], Durak et al. take a closer look at the structure of the different triangles, and study degree relations in networks. They find that networks coming from social and collaborative situations are dominated by homogeneous triangles, i.e., degrees of vertices in a triangle are quite similar to each other. On the other hand, information networks (e.g., web graphs) are dominated by heterogeneous triangles.
OSNs and Google. For a (historic) overview of OSNs, the reader is referred to [26]. In [10], the authors report on a large-scale measurement study of the topological structure of Flickr, YouTube, LiveJournal, and Orkut, and the paper confirms the power-law, small-world, and scale-free properties of OSNs. A demographic perspective is assumed in [27], where Mislove et al. investigate how representative Twitter users are of the overall population. Ahn et al. [28] take a look at the growth patterns and topological (degree-based) evolution of OSNs (Cyworld, MySpace, and Orkut) and compare their results with the ones in real-life social networks. They focus on the scaling exponent of the degree distribution, and find that certain OSNs encourage on-line activities that cannot be easily copied in real life, through the degree correlation pattern. In [29], Cha et al. compare three topological measures of influence (in-degree, re-tweets, and mentions) based on a large crawl of the Twitter OSN. Scellato et al. [30] analyse the annotated geo-location graphs of BrightKite, FourSquare, LiveJournal and Twitter, based on snowball sampling crawls. They find that friendship edges are fairly distant geographically, and define a new metric, called node locality, which captures how close all neighbors of a node are. Gjoka et al. [31] study parallel relations between OSN users, by conducting multigraph measurements of Last.fm.
Not much is known about the Google network. In [9], Schiöberg et al. investigate topological properties of the network (e.g., in- and out-degree distributions), and also use geographic information obtained from user profiles, e.g., on the distribution of link lengths. Kairam et al. [32] study the circle structure of Google, and its ramifications for selective sharing. Gonzalez et al. [33] study the user activity during the first year, and show that the network is not strongly clustered. Gong et al. [34] develop a generative model to reproduce the social structure of Google.
VIII Conclusion
We understand our work as a first step to shed light onto the dynamic evolution of triangle relationships in Online Social Networks, and in particular Google. In contrast to much existing literature focusing on a single snapshot or on the question how a new user joins the network initially (i.e., bootstraps), our study also considers changes in the longer run; indeed, we observe that quite a large number of links also disappears over time, even during this year of fast growth. Accordingly, we believe that our methodology and results give an interesting new perspective on the field, and also have implications, e.g., on link prediction.
However, while our study shows a high degree of motif churn, the results are still very conservative. In fact, we show that any methodology based on a discrete set of snapshots is bound to underestimate the dynamics: there is a large fraction of Type 0 triangles, i.e., triangles which only exist during a subset of the snapshots. A higher resolution of the evolution over time is hence likely to increase the churn rate further.
References
- [1] R. Milo, S. Shen-Orr, S. Itzkovitz, N. Kashtan, D. Chklovskii, and U. Alon, “Network motifs: Simple building blocks of complex networks,” in SCIENCE, 2001.
- [2] A. S. Konagurthu and A. M. Lesk, “On the origin of distribution patterns of motifs in biological networks,” BMC Systems Biology, vol. 2, 2008.
- [3] D. Taylor and J. G. Restrepo, “Network connectivity during mergers and growth: optimizing the addition of a module,” Physical Review E, vol. 2, 2011.
- [4] J.-P. Eckmann and E. Moses, “Curvature of co-links uncovers hidden thematic layers in the world wide web,” Proc. National Academy of Sciences, vol. 99, no. 9, pp. 5825–5829, 2002.
- [5] D. J. Watts and S. H. Strogatz, “Collective dynamics of’small-world networks,” Nature, vol. 393, no. 6684, pp. 409–10, 1998.
- [6] N. Durak, A. Pinar, T. G. Kolda, and C. Seshadhri, “Degree relations of triangles in real-world networks and graph models,” in Proc. 21st ACM International Conference on Information and Knowledge Management (CIKM). New York, NY, USA: ACM, 2012, pp. 1712–1716. [Online]. Available: http://doi.acm.org/10.1145/2396761.2398503
- [7] J. S. Coleman, “Social capital in the creation of human capital,” The American Journal of Sociology, 1988.
- [8] A. Portes, “Social capital: Its origins and applications in modern sociology,” Annual Review of Sociology, 1998.
- [9] D. Schioeberg, F. Schneider, H. Schioeberg, S. Schmid, S. Uhlig, and A. Feldmann, “Tracing the birth of an osn: Social graph and profile analysis in google,” in Proc. ACM Web Science (WebSci), 2012.
- [10] A. Mislove, M. Marcon, K. P. Gummadi, P. Druschel, and B. Bhattacharjee, “Measurement and analysis of online social networks,” in Proc. of ACM/USENIX Internet Measurement Conference (IMC), 2007.
- [11] M. Cha, A. Mislove, and K. P. Gummadi, “A measurement-driven analysis of information propagation in the flickr social network,” in Proceedings of the international conference on World wide web (WWW), 2009.
- [12] P. Erdos and A. R nyi, “On the evolution of random graphs,” in Math. Inst. Hungarian Academy of Sciences, 1960, pp. 17–61.
- [13] A.-L. Barabasi and R. Albert, “Emergence of scaling in random networks,” Science, vol. 286, p. 509 512, 1999.
- [14] D. Liben-Nowell and J. Kleinberg, “The link prediction problem for social networks,” in Proc. 12th International Conference on Information and Knowledge Management (CIKM), 2003.
- [15] S. H. Yang, B. Long, A. Smola, N. Sadagopan, Z. Zheng, and H. Zha, “Like like alike: joint friendship and interest propagation in social networks,” in Proc. 20th International Conference on World Wide Web (WWW), 2011, pp. 537–546.
- [16] S. Boccaletti, V. Latora, Y. Moreno, M. Chavez, and D.-U. Hwang, “Complex networks: Structure and dynamics,” Physics Reports, vol. 424, no. 4 5, pp. 175 – 308, 2006.
- [17] S. Wernicke, “Efficient detection of network motifs,” IEEE/ACM Trans. Comput. Biol. Bioinformatics, vol. 3, no. 4, pp. 347–359, Oct. 2006.
- [18] F. Schreiber and H. Schw bbermeyer, “Frequency concepts and pattern detection for the analysis of motifs in networks,” Transactions on Computational Systems Biology, vol. 3, pp. 89–104, 2005.
- [19] N. Przulj, “Biological network comparison using graphlet degree distribution,” Bioinformatics, 2007.
- [20] W. S. Contractor, N. S. and K. Faust, “Testing multitheoretical organizational networks: An analytic framework and empirical example,” Academy of Management Review, 2006.
- [21] J. W. Berry, B. Hendrickson, R. A. LaViolette, and C. A. Phillips, “Tolerating the community detection resolution limit with edge weighting,” in arXiv, 2009.
- [22] D. Watts and S. Strogatz, “The small world problem,” Collective Dynamics of Small-World Networks, vol. 393, pp. 440–442, 1998.
- [23] J.-P. Eckmann and E. Moses, “Curvature of co-links uncovers hidden thematic layers in the world wide web,” in PNAS, 2002.
- [24] S. Boccaletti, V. Latora, Y. Moreno, M. Chavez, and D.-U. Hwang, “Complex networks: Structure and dynamics,” Physics Reports, 2006.
- [25] P. Mahadevan, D. Krioukov, K. Fall, and A. Vahdat, “Systematic topology analysis and generation using degree correlations,” in Proc. SIGCOMM, 2006, pp. 135–146.
- [26] D. M. Boyd and N. B. Ellison, “Social Network Sites: Definition, History, and Scholarship,” Journal of Computer-Mediated Communication, 2007.
- [27] A. Mislove, S. Lehmann, Y.-Y. Ahn, J.-P. Onnela, and J. N. Rosenquist, “Understanding the demographics of twitter users,” in Proc. 5th International AAAI Conference on Weblogs and Social Media (ICWSM), 2011.
- [28] Y.-Y. Ahn, S. Han, H. Kwak, S. Moon, and H. Jeong, “Analysis of topological characteristics of huge online social networking services,” in Proc. of the International Conference on the World Wide Web (WWW), 2007.
- [29] M. Cha, H. Haddadi, F. Benevenuto, and K. Gummadi, “Measuring User Influence in Twitter: The Million Follower Fallacy,” in Proceedings of the International AAAI Conference on Weblogs and Social Media (ICWSM), 2010.
- [30] S. Scellato, C. Mascolo, M. Musolesi, and V. Latora, “Distance matters: geo-social metrics for online social networks,” in Proceedings of the Workshop on Online social networks (WOSN), 2010.
- [31] M. Gjoka, C. T. Butts, M. Kurant, and A. Markopoulou, “Multigraph sampling of online social networks,” IEEE J. Sel. Areas Commun. on Measurement of Internet Topologies, 2011.
- [32] S. Kairam, M. Brzozowski, D. Huffaker, and E. Chi, “Talking in circles: selective sharing in google,” in Proc. SIGCHI Conference on Human Factors in Computing Systems (CHI), 2012, pp. 1065–1074.
- [33] R. Gonzalez, R. Cuevas, R. Motamedi, R. Rejaie, and A. Cuevas, “Google+ or google-?: dissecting the evolution of the new osn in its first year,” in Proc. 22nd International Conference on World Wide Web (WWW), 2013, pp. 483–494.
- [34] N. Z. Gong, W. Xu, L. Huang, P. Mittal, E. Stefanov, V. Sekar, and D. Song, “Evolution of social-attribute networks: measurements, modeling, and implications using google+,” in Proc. ACM Conference on Internet Measurement Conference (IMC), 2012, pp. 131–144.