On the Blue Loops of Intermediate-Mass Stars
Abstract
We consider the blue loops in the Hertzsprung-Russell diagram that occur when intermediate-mass stars begin core helium burning. It has long been known that the excess of helium above the burning shell, the result of the contraction of the convective core during core hydrogen burning, has the effect of making such stars redder and larger than they would be otherwise. The outward motion of the burning shell in mass removes this excess and triggers the loop. Hitherto nobody has attempted to demonstrate why the excess helium has this effect. We consider the effect of the local opacity, which is reduced by excess helium, the shell fuel supply, which is also reduced, and the local mean molecular weight, which is increased. We demonstrate that the mean molecular weight is the decisive reddening factor. The opacity has a much smaller effect and a reduced fuel supply actually favours blueward motion.
keywords:
stars: evolution1 Introduction
Blue loops occur when stars with masses between about and start to burn helium in their cores. At this point the star has usually developed a convective envelope and is rising up the Hayashi line in the Hertzsprung-Russel (HR) diagram. It consists of a dense core and a diffuse envelope and already possesses an energy source in the form of a thin hydrogen-burning shell just outside the core. The envelope is generally not homogeneous and has an excess of helium in the region above the burning shell. This is the result of the shrinking extent of the convective core during the earlier core hydrogen-burning phase. The core comprises a convective inner core, in which helium is gradually converted to carbon and oxygen, and a thick shell of radiative helium. The existence of two sources of fusion energy means that the star has two nuclear time-scales. How these compare will determine the evolution of the star during this phase.
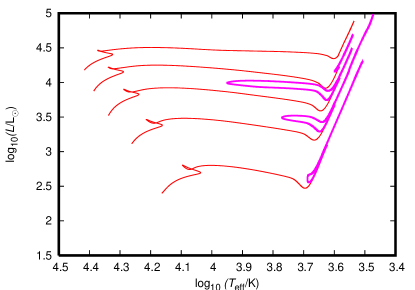
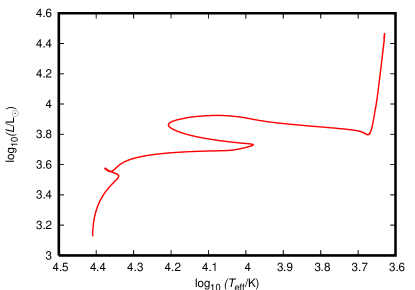
Figure 1 shows the evolution tracks for five stars with the traditional solar composition, that is, the hydrogen mass fraction is , the helium mass fraction is and the metallicity is . It should be noted that the current best estimate of solar metalicity is (Asplund et al., 2004), although there is still much uncertainty (e.g. Socas-Navarro, 2014). All evolution after the tip of the first ascent of the Hayashi line is rendered with thicker lines to emphasise the blue loops. Those stars that perform blue loops contract and heat up, moving leftward in the HR diagram. Eventually they reach a maximum effective temperature and return to the Hayashi line. The considerable variation in luminosity is largely due to changes in the output of the hydrogen-burning shell. The helium luminosity is small in comparison and merely increases monotonically (Xu & Li, 2004a). In a nutshell a blue loop consists of a period of leftward motion in the HR diagram followed by a period of rightward motion. Note that the most massive star to fully loop is an star. The star moves slightly down the Hayashi line in a vestigial loop and the star does not loop at all. This general behaviour, though it occurs over slightly-different mass ranges, is observable across the current set of stellar evolutionary codes and reasonable input physics.
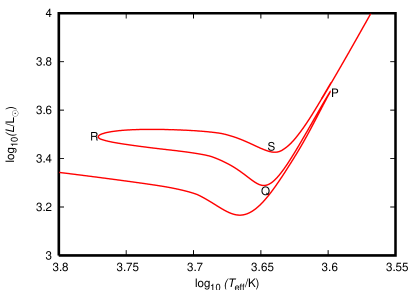
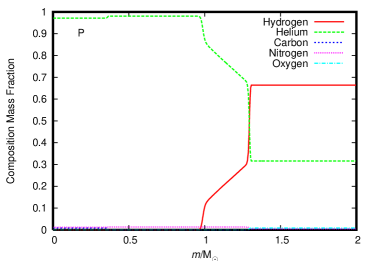
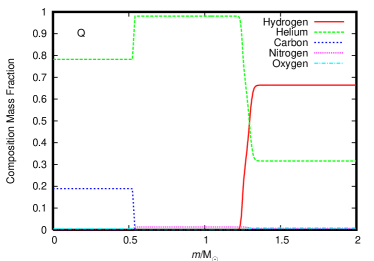
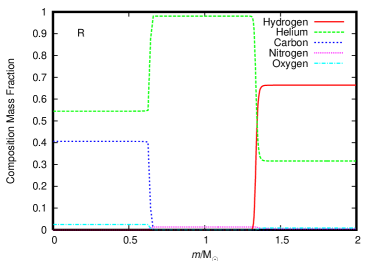
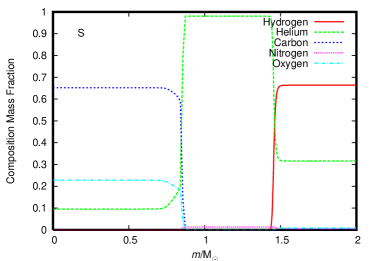
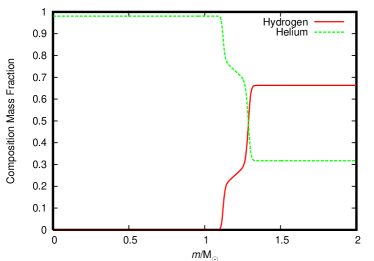
Figure 2 shows the blue loop of a star in greater detail. Four points are labelled as P, Q, R and S and their corresponding internal compositions are shown in Fig. 3. In P we can, working outwards, identify the following features. First, a convective inner core in which helium is being converted to carbon, secondly the radiative outer core, thirdly the steep increase in hydrogen that marks the hydrogen-burning shell, fourthly the steady increase in hydrogen that marks the retreat of the old convective core and finally the jump to the envelope composition. This jump is the result of first dredge-up, that is, the inward penetration of the envelope convective zone into the region affected by core hydrogen-burning. It truncates the old composition profile and redistributes the affected matter within the envelope. In Q we can see that both the inner core and the burning shell have burnt outwards in mass and this continues in R and S. The inner core changes to a mixture of helium and carbon and then to a mixture of carbon and oxygen. The burning shell eventually consumes the zone of changing composition and reaches the jump. These changes have consequences that will be discussed in the next section.
In the first part of this paper we examine previous research into the nature of blue loops. We correct several misconceptions and find that the removal of the excess helium above the core is the fundamental explanation for looping. The excess helium alters the stellar properties in different ways and we investigate them separately. We conclude by considering how the lengths of blue loops vary with the initial helium abundance and the metallicity. We find that the situation is more complicated than is generally assumed.
2 Previous Work
The first thorough studies of the blue loop phenomenon were by Lauterborn, Refsdal, & Weigert (1971) and Fricke & Strittmatter (1972). Both groups began with static shell-burning models with so-called step profiles, models for which the composition of the envelope is uniform from the surface to the core. Lauterborn et al. (1971) treated the core as entirely arbitrary by using , and as inner boundary conditions. They found that an increase in core mass at fixed core radius causes rightward motion across the Hertzsprung Gap and up the Hayashi line. An increase in core radius at fixed core mass has the opposite effect. The position of a model in the HR diagram was therefore characterised by the core potential . Fricke & Strittmatter (1972) considered static models of complete stars but came to an equivalent conclusion with regards to their position function .
Evolution alters the core in two ways. First there is the gain of material from hydrogen burning, secondly there are changes in composition due to helium burning. Fricke & Strittmatter (1972) considered how varies as a function of composition at fixed core mass and found a maximum at about . This means that the chemical evolution of the core initially favours an expansion in core radius and hence leftward motion in the HR diagram. The behaviour reverses when falls below and chemical evolution then favours core contraction, which becomes rapid when . Fricke & Strittmatter (1972) presented a theoretical justification based on the virial theorem in an appendix.
The dependence of on composition is the correct behaviour to begin and end a blue loop. However, as Lauterborn et al. (1971), point out, the magnitude of these changes to core radius is not nearly enough to account for observed loops. The overall core mass also increases monotonically during helium burning and this suppresses looping behaviour entirely. It is therefore apparent that the expected changes to the core cannot induce substantial loops, though they eventually initiate the redward motion that curtails them.
Both Lauterborn et al. (1971) and Fricke & Strittmatter (1972) came to the conclusion that the outward growth in mass of the hydrogen-burning shell is the cause of looping. This outward motion takes the shell through the composition profile left behind by the retreat of the convective core, as a comparison of Cases P and Q in Fig. 3 demonstrates. It thus causes the excess helium above the shell to decline monotonically. By contrast, both groups of authors found that adding excess helium to the region above the shell in the step profile models caused them to move rightwards in the HR diagram: the blue loop in reverse. The effect was most pronounced when the excess helium was closest to the core but it persisted beyond the extent of the burning shell. Robertson (1972) agreed and demonstrated that his models reached their bluest extent in the HR diagram at the point when the composition at the burning shell finally equalled that of the stellar surface. Whether or not a star actually performs a blue loop depends on whether this effect manages to temporarily overcome the consequences of the core evolution. It should be noted that, as can be seen in Fig. 3, the composition change between the envelope and the core never becomes entirely discontinuous. This is not permitted by the star and a perfectly vertical step profile model always relaxes somewhat to give something like Case S.
As we have already observed, the evolutionary composition profile is complicated by the effects of first dredge-up. This removes the outer part of the profile and replaces it with a near-vertical jump that marks the innermost point of convective penetration. The excess helium above the burning shell is thus reduced (see Case P in Fig. 3) and therefore anything that moves this discontinuity closer to the core produces a more extensive loop. Robertson (1972) showed this for his increased envelope opacities, which had the effect of promoting deeper convection zones. Stothers & Chin (1991) showed this for envelope convective overshooting. Stars more massive than about do not experience significant inward penetration of the convective envelope at solar metallicity and thus looping is limited to no more than slight motion down and up the Hayashi line.
The fact that excess helium above the burning shell compels a shell-burning star to be larger and redder than it would otherwise be is beyond dispute. The reader can verify this with a stellar evolution code of their choice. Perhaps as a consequence blue loops have received little attention since the seventies, despite the fact that the details of this reddening mechanism are unknown. To attempt to disentangle the chains of cause and effect involved in stellar evolution is not always straightforward.
Renzini et al. (1992) explained the expansion of intermediate-mass and massive stars to red giants as a consequence of a runaway thermal instability in the envelope. The expansion of the envelope causes it to cool, the heavy ions recombine and this increases the opacity. The envelope absorbs more energy and expands further on the thermal time-scale. The initial trigger is an increase in luminosity and similar arguments were used to explain motion in the reverse direction in the HR diagram via a drop in luminosity and subsequent contraction. This drop in luminosity was said by Sweigart et al. (1990) to be the result of the increase in local opacity as the ratio of helium to hydrogen above the burning shell decreases. Renzini et al. (1992) claimed that a blue loop would be triggered if the stellar luminosity fell below a certain threshold.
The overall theory has been heavily criticised (Faulkner, 2005). In the case of the blue loop it can be readily disproved by turning our attention to stars with very low metallicities. If sufficiently massive these stars start helium burning in the Hertzsprung gap and perform a blue loop without either ascending the Hayashi line or experiencing a drop in luminosity (Fig. 4). Renzini et al. (1992) have mistaken correlation for causation. If a star on the Hayashi line is to perform a blue loop then the motion back down the line necessarily requires a drop in luminosity if the temperature is to increase. Similarly the thermal-instability explanation confuses cause and effect. If the interior of a star changes more rapidly than the envelope can adjust then it must indeed be thermally unstable. This instability does not itself cause anything. In any case stars between about and perform blue loops without any thermal instability whatsoever.
In a similarly-mistaken vein Xu & Li (2004a) argued that whether or not a star performs a loop depends on whether the envelope is dominated by radiation or convection at the post helium-ignition luminosity minimum. They argued that a convective envelope responds to increased luminosity by developing more extensive convective zones and expanding back up the Hayashi line. A radiative envelope instead improves its conductivity by heating up and moving into the Hertzsprung gap. They suggested that a possible criterion is for the ratio of the convective envelope mass to the total envelope mass to fall below some minimum at the luminosity minimum. For solar metallicity they estimated this minimum to be between and .
Again cause and effect are confused. Convection is a response made by the envelope if it is compelled to expand beyond a certain point by the actions of the core. In no sense is it an independent property of the envelope. During both the motion down the Hayashi line and into the Hertzsprung gap the star shrinks and becomes hotter monotonically. The whole misconception appears to have arisen from a misreading of a paragraph written by Chiosi et al. (1992): ‘…a rapid contraction of the envelope readjusts the outer layers from convective to radiative and the star moves to the second region, where the remaining part of the core He-burning phase occurs. This causes the blue loops.’ This is true in the precise sense that a star cannot execute a substantial loop, i.e. greatly increase its effective temperature, without leaving the Hayashi line. This departure must necessarily be associated with the end of convection in the envelope.
Little more needs to be said about the convective envelope mass criterion. Subsequently (Xu & Li, 2004b) the authors found, unsurprisingly, that the criterion depended on stellar mass, metallicity and helium abundance. It does not point to any deeper truth.
Xu & Li (2004a) also made the mistake of attempting to find discrete explanations for the luminosity minimum and subsequent increase. They explained the initial drop in luminosity with what they called the push effect, the composition-induced initial expansion of the core. They claimed that this compels the shell to expand and cool and therefore causes the hydrogen-burning luminosity to decrease. The subsequent increase in luminosity was explained by the increased predominance of what they called T prompt and X prompt, which are respectively the heating of the shell by the increasingly-hot core and the increased availability of fuel. These explanations are superficially attractive but are based on little more than assertion. In the next section we demonstrate that loops are actually hindered by the increased fuel supply and do not require any changes to the core.
Stellar evolution is too complicated to be reduced to glib explanations. A better approach was that of Lauterborn et al. (1971), who classified their shell-burning models into three regimes according the the relative mass of the envelope. Regime I consists of blue stars with a small envelope mass, regime II of red stars with an intermediate envelope mass and regime III of blue stars with a large envelope mass. Regime I contains those stars that have lost much of their envelope and, though applicable to Wolf-Rayet stars, is not of relevance to a consideration of blue loops. Regime III contains blue loop stars that are burning helium in the Hertzsprung Gap and regime II those stars after they have moved back to the Hayashi line. Lauterborn et al. (1971) found that altering either the core potential or the excess helium could shift a star from one regime to another through a series of static models. It is apparent that excess helium has the effect of making a star that would be in regime III with a step profile behave like a star in regime II. The outward motion of the burning shell lessens this effect and causes the loop.
The different regimes represent different sets of solutions to the stellar evolution equations for shell-burning stars. If a star is in regime II then a reduction in luminosity is accompanied by an increase in temperature as it moves down the Hayashi line and contracts. If it is in regime III then an increase in temperature may well be accompanied by an increase in luminosity. Movement from regime III to regime II always involves the expansion and cooling of a star and is accompanied by a drop in luminosity at the bottom of the Hayashi line. All that can be said is that there is transition between the regimes and that some factors induce motion in one direction and some in the other. In the next section we consider the different consequences of excess helium.
3 The Varied Consequences of Excess Helium
We have established that the only solid fact about blue loops is that they are the result of the outward motion of the burning shell through a changing composition profile. This in turn is a consequence of the fact that excess helium above the burning shell has the effect of shifting a star to the right in the HR diagram. Removing it, provided that this happens faster than the evolution of the core, triggers a blue loop. The presence of the excess helium alters the local stellar properties in various ways and some of these alterations have been suggested, although not demonstrated, to be of importance.
The opacity, as invoked by Renzini et al. (1992), has already been mentioned. The replacement of a mass of helium with an equal mass of hydrogen results in an increase in the local opacity. This is to be expected: two electrons and an alpha particle provide less opacity than four protons and four electrons. It is well known that a reduction in envelope opacity makes stars bluer but this is the consequence of an alteration to the entire envelope rather than to the area immediately at and above the burning shell. Schlesinger (1977) found that if he increased the thickness of the excess helium region beyond a certain point then his stars started becoming bluer rather than redder.
Xu & Li (2004a) observed that the replacement of helium with hydrogen provides more fuel for the burning shell and suggested that this should increase the luminosity. Finally Lauterborn et al. (1971) pointed to the paper on shell homology by Refsdal & Weigert (1970), who found that the luminosity of stars on the Hayashi line depends on a high power of the mean molecular weight, which is lowered by the replacement of helium with hydrogen.
To test these possibilities we need to make some stellar models. All the models mentioned in this paper were computed with the Cambridge code, which was originally developed by Peter Eggleton in the 1960s (Eggleton, 1971). It uses a non–Lagrangian mesh, where a mesh function ensures that the points are distributed so that between them quantities of physical interest do not vary by a large amount. The code has been gradually improved and updated and the version used in this research is based on that described by Stancliffe & Eldridge (2009) and references therein. All our models use 499 mesh points because this was found to be the minimum required to consistently reproduce the evolutionary phases of interest. Models with more points are effectively identical but take longer to evolve, whereas models with fewer points have slightly different evolutionary paths. Mass loss, a very small effect in this mass range, was turned off and is ignored throughout this paper unless stated otherwise. Convective overshooting is obtained with the method of Schröder et al. (1997), with an overshooting parameter of . Overshooting is implemented in this manner throughout the star, with the consequence that inward overshooting from the envelope occurs as well as outward overshooting from the core.
There are therefore three candidates: the opacity, the fuel supply or the mean molecular weight. To test in isolation the effects of these factors we modified the code to include an additional element which we have called arbitrarium. This was inspired by the work of Stancliffe et al. (2009) who modified their code such that helium had an atomic mass of 1.5 and thus contributed in the same way as hydrogen to the mean molecular weight, with the aim of exploring the role of this quantity in the formation of red giants. The properties of arbitrarium are, needless to say, arbitrary.
We began with a star of solar composition and allowed it to evolve normally until the start of helium burning. At this point the star consisted of a helium core, a homogeneous envelope and a transition profile between the two (Fig. 7). There is an inner edge at and an outer edge at . The latter is the result of the inward motion of the convective envelope during first dredge-up and the former occurs because shell burning is in a very narrow mass range. The intermediate slope was left behind by the contraction of the convective core during hydrogen burning. To ensure a pure helium core we froze the chemical conversion of helium to carbon during the initial model run whilst leaving the energy generation rates unchanged. The model was extracted a short but finite time after the start of helium burning, with the consequence that the helium core is slightly more massive than it was at the tip of the first ascent of the Hayashi line.
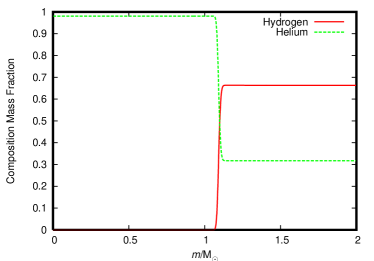
We then replaced the excess helium above the core with arbitrarium (Fig. 7) to create an initial model. The arbitrarium was given the all the properties of helium, so this change had no effect on the star. For the purpose of comparison we made another model in which the excess helium was replaced with hydrogen to give a step profile (Fig. 7).
3.1 Opacity
The effect of opacity is simply tested. The code uses opacity tables that depend on the abundance of hydrogen and helium and the metallicity. For opacity only we set the mass of helium to be
| (1) |
and that of hydrogen to be
| (2) |
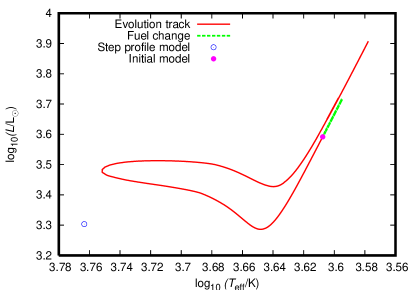
where Arb refers to arbitrarium and is a parameter that we vary between 0 and 1. When is zero the arbitrarium contributes to the opacity in the same way as helium. We gradually increase it to one in small steps, with the stepsize sufficiently small that thermal equilibrium is rapidly achieved after each change. The conversion of all chemical species is suspended so the models are otherwise static. When the arbitrarium contributes to the opacity in precisely the same way as hydrogen but is identical to helium in every other respect. The path in the HR diagram is shown in Fig. 9 together with the track for normal evolution, the initial model and a model with a helium core of the same size but a step profile composition (Fig. 7). The step profile model was created by gradually making the arbitrarium hydrogen-like in every respect.
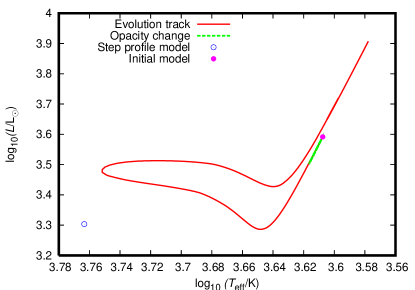
It is apparent that the increase in the opacity occasioned by replacing helium with hydrogen causes the star to move somewhat down the Hayashi line. However it is still very much redder than both the tip of the blue loop under normal evolution and a step profile model with a helium core of the same size. Opacity is part of the explanation for looping but only a minor component. If the conversion of chemical species is resumed then the final model performs a blue loop similar to that observed in the normal evolution track. The point of maximum temperature is at .
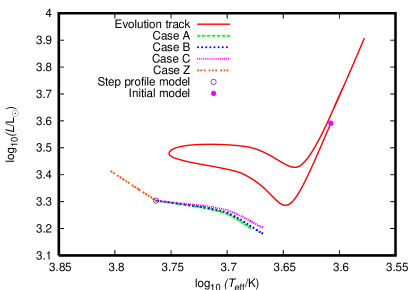
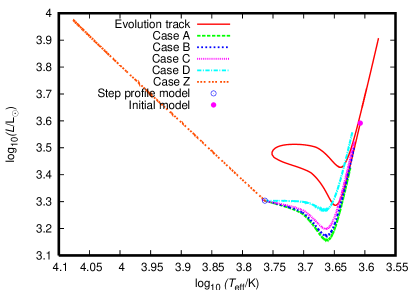
We explore the consequences of changing the opacity a little further by making some additional models. We take the step profile model and replace half the hydrogen with arbitrarium from the innermost edge at out to four different masses. These are identified as Case A, ; Case B, ; Case C, and Case Z, the surface. The arbitrarium is initially identical to hydrogen but is gradually given the opacity of helium. The results are shown in Fig. 9. Case Z shows that if one lowers the overall opacity of the envelope one compels the star to heat up and move leftwards. Changes near to the burning shell have the opposite effect and Case B is the reddest. This must mark the approximate point at which the effect of changing the local opacity reverses. Contrary to the view of Sweigart et al. (1990), a reduction in the opacity above the burning shell does not necessarily result in an increase in luminosity. In all cases the behaviour is that of regime III: a reduction in temperature accompanies a reduction in luminosity.
3.2 Fuel Supply
Replacing helium with hydrogen increases the available fuel supply in the shell. We test the effect of this by returning to the initial model and modifying the code so that the local mass of arbitrarium is added to that of hydrogen for the purposes of calculating the nuclear reaction rates. As before the parameter is set to zero and slowly increased to one.
| (3) |
The effect is shown in Fig. 11. It is apparent that increasing the fuel supply propels the star up the Hayashi line and therefore disfavours looping. This is not too surprising; the shell homology relations of Refsdal & Weigert (1970) have, for stars on the Hayashi line, the luminosity proportional to a low but positive power of the hydrogen mass fraction.
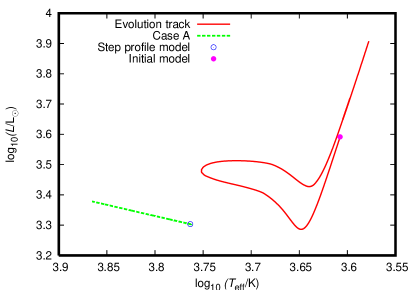
As with the opacity we consider the effect of modifying the step profile model by replacing half the hydrogen with arbitrarium out to different masses. The situation is simplified by the fact that an alteration to the arbitrarium only has an effect within the burning shell. This is very thin, extending from out to . The arbitrarium is initially identical to hydrogen but its contribution to the reaction rates is gradually reduced to zero. In Fig. 11 only Case A is shown, the others are identical. It is apparent that reducing the fuel supply propels the star to higher temperatures and luminosities, a further demonstration that the fuel supply acts to suppress looping. This contradicts the claim by Xu & Li (2004a): an increased fuel supply does not in fact cause the luminosity increase that takes a star that is performing a blue loop into the Hertzsprung Gap. A final point is that a reduction in the energy productivity via either the removal of CNO elements or an alteration to the reaction rates has the same effect.
3.3 Mean Molecular Weight
If, in the course of the evolution of a shell-burning star, changes to the opacity only slightly favour looping and to the fuel supply suppress it, then, by elimination, the primary cause must be the mean molecular weight. This depends on the proton number , the atomic weight , and the mass fraction of the component species. For an ionised gas the formula is
| (4) |
The parameters and are defined in terms of the parameter , which is slowly increased from zero to one.
| (5) |
| (6) |
The effect is to change the mean molecular weight profile to a step function and the evolutionary path is shown in Fig. 13. The star is propelled down the Hayashi line and far across the Hertzsprung Gap. The final state is considerably bluer than the step profile model, confirming our supposition that the mean molecular weight is the decisive factor.
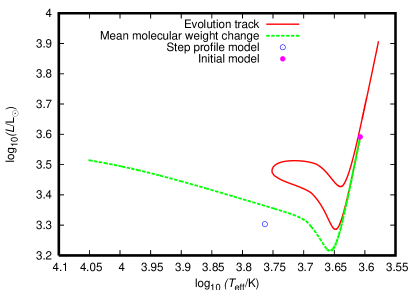
As before we modified the step profile model by replacing half the hydrogen with arbitrarium out to different masses. The arbitrarium was initially identical to hydrogen but gradually assumed the mean molecular weight contribution of helium. The mean molecular weight of the helium core was and this fell to in the envelope. The replacement of half the hydrogen with helium-like arbitrarium increased the mean molecular weight to and the results are shown in Fig. 13. The labels are the same as for the opacity with the exception of Case D, for which the replacement occurred out to . It is apparent that an increase in the mean molecular weight near the burning shell favours considerable rightward motion in the HR diagram. The zone of importance is greater in extent than the burning shell itself but less than the entire star. Increasing the mean molecular weight throughout the envelope compels the star to contract and heat up. Finally, if all other things are equal, an increase in the thickness of the modified zone causes a monotonic increase in luminosity.
4 Implications
Any discussion about the nature of blue loops would be incomplete without a reference to the observation by Kippenhahn et al. (2013) that, “the present phase is a sort of magnifying glass, also revealing relentlessly the faults of calculations of earlier phases.” It is apparent that, largely through the medium of the mean molecular weight, anything that affects the composition profile above the burning shell has a noticeable effect on the extent of the blue loop. Anything that affects the mass of the core also has an effect. This is partly because a star whose core is relatively more massive is redder, partly because a star whose core is absolutely more massive evolves faster and thus enters the loop-curtailing phase of rapid contraction faster, perhaps before the shell has burnt through the composition profile. With this in mind we consider the effect of changes to the initial helium abundance and metallicity.
4.1 The Initial Helium Abundance
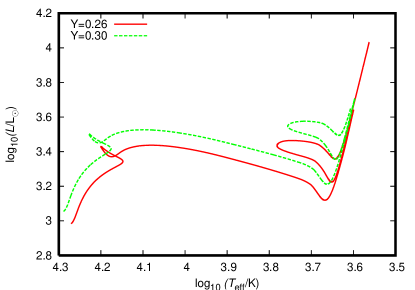
An increase in the initial helium abundance has long been associated with more extended blue loops (Robertson, 1971). Xu & Li (2004b) attributed this to the reduction in the overall opacity in the envelope. It is apparent from Case Z in Fig. 9 that such a reduction, as opposed to one localised to the vicinity of the burning shell, does indeed shift a star bluewards. Bono et al. (2000) cited the reduced opacity as a cause but also stated that the associated increase in the mean molecular weight has an effect. From Fig. 13 we can see that an overall increase in the mean molecular weight of the envelope also shifts a star bluewards. The effect is much more powerful than that exerted by the opacity. Previous authors have however neglected the final effect of additional helium in the envelope. More helium means less hydrogen and therefore a reduction in the fuel supply to the burning shell. Fig. 11 shows that this also produces a blueward shift, one that is greater than that caused by the opacity change but still less than that caused by changes to the mean molecular weight.
It should be noted that the above analysis pertains to both a fixed helium core mass and a constant composition profile. To appreciate the full effect of an increase in the initial helium content we must consider the evolution of the star from the zero-age main sequence. The first point to consider is that the helium core produced by hydrogen burning is more massive. For a star with solar metallicity the mass of the helium core at the top of the Hayashi line increases from when to when . Secondly, the base of the convective region rises from to , meaning that first dredge-up removes less excess helium.
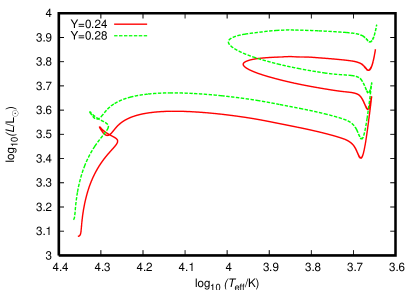
If we turn to the stellar models we find that looping, although enhanced at low metallicity (Fig. 15), is in fact retarded by an increase in at high metallicity (Fig. 14). This phenomenon was observed by Xu & Li (2004b) but they did not attempt to explain it. The cause is clear: at high metallicity the consequences of a larger core and less dredging dominate over the envelope effects. At low metallicity the stars do not move very far up the Hayashi line and first dredge-up is either limited or non-existent.
4.2 The Metallicity
It is sensible to check that the effects of a change to the opacity, the fuel supply and the mean molecular weight are the same at low metallicity. To that end we take a 6 star at tenth-solar composition ( and ) and create a step profile model. The burning shell is located between and and we replace half the hydrogen out to with hydrogen-like arbitrarium. This is then separately given the properties of helium for the three different factors. The results are shown in Fig. 16 and the picture is much the same as with the solar models.

As with an increase in the initial helium abundance, a reduction in metallicity has also long been associated with more developed loops (Robertson, 1971). Xu & Li (2004b) performed a thorough study of the variability of blue loops with metallicity and helium content and found that, for fixed and a mass of , loops become shorter as is increased from to . They attributed this to a reduction in the overall opacity and we decided to test this.
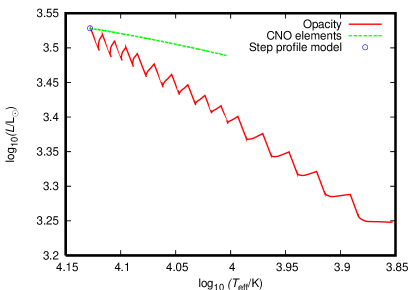
The code uses a different opacity table for each metallicity and this table is loaded when the program is started. This means that it is difficult to gradually change the opacity to reflect different metallicities. We wrote a script to copy in a new opacity table, start the program, evolve the star to thermal equilibrium, output the final model as the new input model and repeat. With this method we can give the step profile model the opacity tables. The sawtooth pattern (Fig. 17) marks the sudden drop in luminosity as the table is changed and this is then followed by the relaxation of the envelope. The intermediate opacity tables were for , , , , , , , , , , , , , and .
It is apparent that the opacity increase associated with an increase in the metallicity does indeed greatly disfavour looping. Despite this it is sensible to consider the other consequences of varying the metallicity. To that end we return to the step profile model and subtract from the helium mass fraction throughout the star. This is then replaced with helium-like arbitrarium and, when added to the metals, gives a mass fraction of . We find that changing the mean molecular weight contribution of the arbitrarium to that of metals has a negligible effect. This is not very surprising given that helium and metals have a similar mean molecular weight. When the arbitrarium does not contribute to helium burning the effect is much the same. The only modification that does have a noticeable effect is to allow the arbitrarium to contribute in the same way as the metals to the CNO cycle. We have already shown that an increase in the fuel supply in the shell suppresses looping and the same effect is apparent in Fig. 17. The effect is less important than a change to the opacity but not inconsequential.
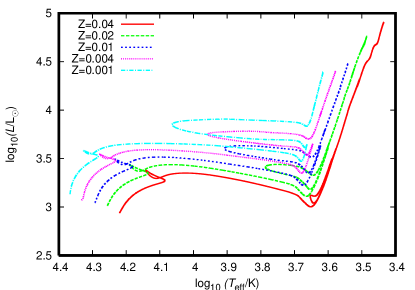
Xu & Li (2004b) found that if the metallicity is increased above then their blue loops became longer. They attributed this to the fact that first-dredge up becomes important for these stars and that the increased dredging of metal-rich stars favours looping more than the increased opacity disfavours it. This is certainly the correct explanation for their findings. However, when we make a series of models we find that the extent of looping decreases monotonically as the metallicity is increased (Fig. 18). Evidently different codes cause one to draw different conclusions. The more recent models of Bertelli et al. (2009), Lagarde et al. (2012) and Georgy et al. (2013) exhibit similar metallicity evolution to what we observe and therefore the current consensus may be said to be that blue loops become shorter at higher metallicities. We will not go beyond the observation that although the general trend is for looping to become less pronounced as metallicity is increased, we would not be surprised to find occasional deviations from this rule.
5 Conclusions
We began by considering past work. Previous authors have shown that excess helium above the burning shell shifts a star to the right in the HR diagram and makes it redder and larger than it would otherwise be. The shrinkage of the convective core during hydrogen burning means that this is the case at the start of helium burning. The outward movement of the shell in mass reduces the amount of excess helium and this is accompanied by leftward motion into the Hertzsprung Gap – the start of the loop.
Some researchers have been labouring under various misconceptions about the blue loop mechanism and that these have arisen from flawed logic. The blue loop is not the result of a thermal instability triggered by a luminosity drop; rather a star must necessarily feature a luminosity drop if it is to move back down the Hayashi line. Stars with very low metallicities can sometimes begin a blue loop in the Hertzsprung Gap and this is not accompanied by a drop in luminosity. If a star evolves rapidly then the envelope may become thermally unstable but this, as with the shrinkage and disappearance of the deep convective envelope, is an effect rather than a cause.
The presence of excess helium alters the properties of a star in different ways. Although there has been some speculation, to date nobody has attempted to make a proper comparison of the different factors under circumstances that ensure that the effect of their variation alone is observed. We considered three possibilities: the opacity, the fuel supply and the mean molecular weight. By modifying our code to include arbitrarium, an artificial element that possessed some of the characteristics of hydrogen and some of those of helium, we are able to compare these factors independently. We find that changes to the opacity, which is lowered by the excess helium, favours looping but that the effect is small. An increase in the fuel supply has the opposite effect and suppresses looping. This leaves the mean molecular weight, which turns out to be the decisive factor. Changes to the opacity and mean molecular weight over the whole envelope have the opposite effect.
We then considered the effect of changes to initial helium abundance and metallicity on the extent of looping. We showed that an increase in favours looping at low metallicity but suppresses it at high metallicity. An increase in reduces the overall opacity, increases the overall mean molecular weight and reduces the fuel supply in the shell, all of which favour blueward motion in the HR diagram. However at high metallicity the extent of looping is strongly affected by the depth of first dredge-up. This is shallower if the helium content is increased and therefore loops are shorter.
Similarly an increase in the metallicity increases the opacity and the efficiency of hydrogen burning and thus suppresses looping. However, at high metallicity a further increase leads to more extensive envelope convective zones and deeper dredging. This may succeed in making the loops bluer. Such complexity and sensitivity probably accounts for the poor fit of existing models of blue helium-burning stars to observations (McQuinn et al., 2011).
References
- Asplund et al. (2004) Asplund M., Grevesse N., Sauval A. J., Allende Prieto C., Kiselman D., 2004, A&A, 417, 751
- Bertelli et al. (2009) Bertelli G., Nasi E., Girardi L., Marigo P., 2009, A&A, 508, 355
- Bono et al. (2000) Bono G., Caputo F., Cassisi S., Marconi M., Piersanti L., Tornambè A., 2000, ApJ, 543, 955
- Chiosi et al. (1992) Chiosi C., Bertelli G., Bressan A., 1992, ARA&A, 30, 235
- Eggleton (1971) Eggleton P. P., 1971, MNRAS, 151, 351
- Faulkner (2005) Faulkner J., 2005, in The Scientific Legacy of Fred Hoyle, Gough D., ed., Cambridge University Press, pp. 149–224
- Fricke & Strittmatter (1972) Fricke K. J., Strittmatter P. A., 1972, MNRAS, 156, 129
- Georgy et al. (2013) Georgy C., Ekström S., Eggenberger P., Meynet G., Haemmerlé L., Maeder A., Granada A., Groh J. H., Hirschi R., Mowlavi N., Yusof N., Charbonnel C., Decressin T., Barblan F., 2013, A&A, 558, A103
- Kippenhahn et al. (2013) Kippenhahn R., Weigert A., Weiss A., 2013, Stellar Structure and Evolution. Springer-Verlag
- Lagarde et al. (2012) Lagarde N., Decressin T., Charbonnel C., Eggenberger P., Ekström S., Palacios A., 2012, A&A, 543, A108
- Lauterborn et al. (1971) Lauterborn D., Refsdal S., Weigert A., 1971, A&A, 10, 97
- McQuinn et al. (2011) McQuinn K. B. W., Skillman E. D., Dalcanton J. J., Dolphin A. E., Holtzman J., Weisz D. R., Williams B. F., 2011, ApJ, 740, 48
- Refsdal & Weigert (1970) Refsdal S., Weigert A., 1970, A&A, 6, 426
- Renzini et al. (1992) Renzini A., Greggio L., Ritossa C., Ferrario L., 1992, ApJ, 400, 280
- Robertson (1971) Robertson J. W., 1971, ApJ, 170, 353
- Robertson (1972) —, 1972, ApJ, 173, 631
- Schlesinger (1977) Schlesinger B. M., 1977, ApJ, 212, 507
- Schröder et al. (1997) Schröder K. P., Pols O. R., Eggleton P. P., 1997, MNRAS, 285, 696
- Socas-Navarro (2014) Socas-Navarro H., 2014, ArXiv e-prints
- Stancliffe et al. (2009) Stancliffe R. J., Chieffi A., Lattanzio J. C., Church R. P., 2009, PASA, 26, 203
- Stancliffe & Eldridge (2009) Stancliffe R. J., Eldridge J. J., 2009, MNRAS, 396, 1699
- Stothers & Chin (1991) Stothers R. B., Chin C.-W., 1991, ApJ, 374, 288
- Sweigart et al. (1990) Sweigart A. V., Greggio L., Renzini A., 1990, ApJ, 364, 527
- Xu & Li (2004a) Xu H. Y., Li Y., 2004a, A&A, 418, 213
- Xu & Li (2004b) —, 2004b, A&A, 418, 225