Effective destruction of CO by cosmic rays: implications for tracing H2 gas in the Universe
Abstract
We report on the effects of cosmic rays (CRs) on the abundance of CO in clouds under conditions typical for star-forming galaxies in the Universe. We discover that this most important molecule for tracing H2 gas is very effectively destroyed in ISM environments with CR energy densities , a range expected in numerous star-forming systems throughout the Universe. This density-dependent effect operates volumetrically rather than only on molecular cloud surfaces (i.e. unlike FUV radiation that also destroys CO), and is facilitated by: a) the direct destruction of CO by CRs, and b) a reaction channel activated by CR-produced He+. The effect we uncover is strong enough to render Milky-Way type Giant Molecular Clouds (GMCs) very CO-poor (and thus CO-untraceable), even in ISM environments with rather modestly enhanced average CR energy densities of . We conclude that the CR-induced destruction of CO in molecular clouds, unhindered by dust absorption, is perhaps the single most important factor controlling the CO-visibility of molecular gas in vigorously star-forming galaxies. We anticipate that a second order effect of this CO destruction mechanism will be to make the H2 distribution in the gas-rich disks of such galaxies appear much clumpier in CO =1–0, 2–1 line emission than it actually is. Finally we give an analytical approximation of the CO/H2 abundance ratio as a function of gas density and CR energy density for use in galaxy-size or cosmological hydrodynamical simulations, and propose some key observational tests.
1 Introduction
Using the mm/submm rotational transitions of CO, the most abundant molecule after H2 (CO/H), as tracers of the H2 distribution and average physical conditions in galaxies is now a well-established method, and indeed a main driver behind the largest ground-based astronomical facility on Earth, the Atacama Large Millimeter Array (ALMA) in Llano Chajnantor of North Chile. Ever since the first detection of a bright CO line in Orion (Wilson et al., 1970) there has been tremendous progress towards detecting ever higher- transitions of CO, in our own Galaxy as well as in others (e.g. Cronin et al., 1976; Guesten et al., 1993; Devereux et al., 1994; Dumke et al., 2001; Yao et al., 2003a, b; Mao et al., 2010; Papadopoulos et al., 2007; Papadopoulos, 2010; Leech et al., 2010) and of other molecules such as HCN, HCO+, and CS (Nguyen et al., 1992; Solomon et al., 1992; Paglione et al., 1997; Gao & Solomon, 2004; Graciá-Carpio et al., 2006, 2008; Papadopoulos, 2007; Krips et al., 2008; Greve et al., 2009; Zhang et al., 2014). The relative strengths of such lines can then be used as powerful probes of the average density, temperature, and dynamical state (i.e. gravitationally bound or unbound) of the molecular gas in galaxies (Papadopoulos et al., 2012, and references therein). A lot of effort has been focused particularly towards using the two lowest CO rotational lines as H2 gas mass tracers in galaxies via the so-called -factor (e.g. Dickman et al., 1986; Maloney & Black, 1988; Young & Scoville, 1991; Solomon et al., 1992; Bryant & Scoville, 1996; Solomon et al., 1997; Downes & Solomon, 1998). In this context higher- CO and other molecular lines remain very important since the constrains they set on the average density, thermal and dynamical state of H2 cloud ensembles111 retains its mass-tracing value only for cloud ensembles rather than cloud parts or single H2 clouds help determine and find whether it deviates from its Galactic calibrated value 222 (see Papadopoulos et al., 2012, for a recent such study).
Nevertheless, all available studies quantifying the effects of the H2 physical conditions on the (H2 mass)/(CO luminosity) ratio rely on the premise of a CO-rich H2 gas phase. Significantly lower CO/H2 ratios would render the use of CO lines as molecular gas mass tracers problematic. Extensive observational and theoretical work has indeed shown that a CO-poor phase becomes possible for ISM with low average metallicities (Z) and strong FUV fields (e.g. Maloney & Black, 1988; Madden et al., 1997; Israel, 1997; Pak et al., 1998; Bell et al., 2006a). Metallicity (Z) and the average FUV radiation field () then emerge as the two most important factors determining CO/H2 in metal-poor ISM, while models that incorporate the underlying ISM physics have been made to correct for such CO-dark H2 mass per cloud (Pak et al., 1998; Bolatto et al., 1999). These can be of help as long as: a) some CO survives in the inner cloud regions (so that CO line emission can still mark such clouds), b) the average metallicity and mean FUV radiation field are known (so that their values can be inserted in the models). Such models will obviously not work for metallicities that fall too low and/or average FUV fields that are strong enough to keep CO fully dissociated333For clarity we must emphasize here that even in the CO-rich parts of the Galaxy CO-poor regions do exist (e.g. diffuse H2 clouds, outer parts of GMCs, regions very near O, B stars), but their masses are typically too small to make any impact on the total H2 mass budget as traced by the CO-rich H2 gas. (e.g. Bolatto et al., 1999; Bell et al., 2006b).
Despite existing theoretical work that investigated the effects of CRs on ISM chemistry (e.g. Bayet et al., 2011; Meijerink et al., 2011), the effects on CO/H2 of CRs (which, unlike FUV radiation, travel nearly unimpeded through the irrespective of its dust content), or their impact on the observability of H2 gas via CO lines has not been investigated in detail. Recently, Bialy & Sternberg (2014) presented an analytical study of the importance of CRs in the abundance of the most important species under different metallicities, using isothermal calculations. In this work, we present our investigation of the effects produced by CRs starting with the ISM of metal-rich star-forming galaxies but, unlike Bialy & Sternberg (2014), we perform full thermochemical calculations (i.e. we solve for thermal balance) while using a much more extensive chemical network. We assume CRs fully penetrating the molecular clouds, with an average CR energy density scaling as (where is the average star-formation rate energy density; see Papadopoulos, 2010, and references therein for detailed arguments).
2 The effect of CRs on the CO/H2 ratio in molecular clouds
We first perform a grid of runs of one-dimensional uniform density clouds in which we vary the density, , from and the cosmic ray ionization rate, , from . The choice for the range is dictated by that deduced within the Milky Way ( s-1), and from the expected in galaxies with star-formation (SF) rate densities of (assuming where is the CR energy density, and for a CR-transparent ISM).
In order to isolate the effects of CRs on the important CO/H2 ratio we set the incident FUV field ( the average interstellar radiation field as described by Draine, 1978), and consider only Solar metallicity (Z=) gas. We chose a density range that encompasses the low-density Galactic regions where the Hi phase transition takes place in the Cold Neutral Medium (200 cm-3), to typical Galactic GMCs ( cm-3), and up to the high densities typical of SF cores ( cm-3). We then use the 3d-pdr code (see Appendix A) to conduct full thermochemical calculations on a uniform density cloud permeated by an average (that proportionally sets ) for the grid of values. The results on the CO/H2 ratio (blue lines, marking CO/H) can be viewed in Fig. 1, where we also show the Ci/CO ratio (green lines, indicating the Ci/CO ratio) since atomic carbon is the dominant species resulting from the CR-induced destruction of CO.
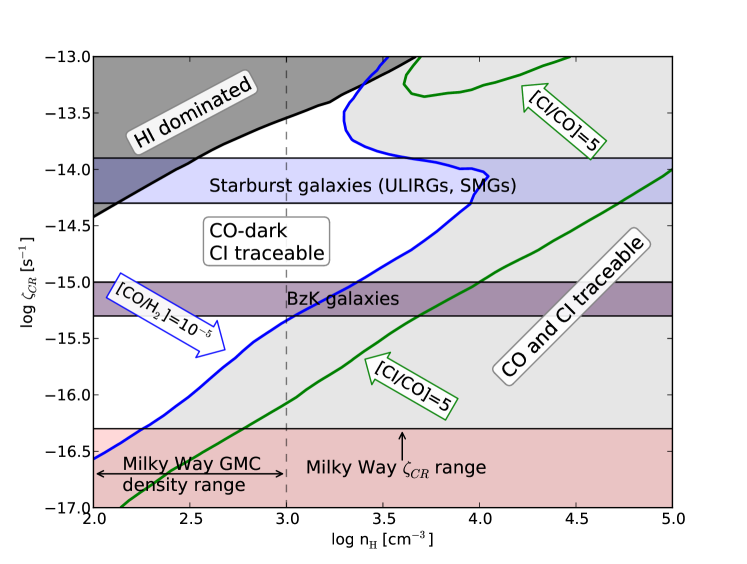
From Fig.1 it can be seen that molecular clouds with densities typical of the Galactic GMC density range ( cm-3) can become very CO-poor even in ISM environments with SFR densities (and thus ) only Galactic. This is even more the case for the ISM of gas-rich SF systems like the so-called BzK galaxies. These are isolated disks, typically at z, with Galactic, and representative of a major SF mode in the Early Universe (Daddi et al., 2010). In such systems CO/H (10 times less abundant than in the Galaxy) for much of the range of average H2 gas densities typical for Galactic GMCs. Thus, unless the molecular gas in such galaxies lies preferentially in cloud structures with , CO imaging for the purpose of revealing H2 gas disk sizes, average molecular gas physical conditions, and H2 mass distribution (e.g. Daddi et al., 2010, 2014) may be inadequate. Figure 1 also reveals that efficient CR-induced CO destruction encompasses ever increasing gas densities for higher , reaching up to for values expected in compact merger/starburst galaxies in the local Universe (ULIRGs), and similar systems like the so-called Submm Galaxies (SMGs) found at much larger numbers in the distant Universe (Smail et al., 1997; Hughes et al., 1998)
Furthermore, even in the Galaxy there seems to be a parameter space where low-density molecular gas () can be very CO-poor. Such a gas phase may indeed exist in the outer Galactic disk () where a combination of low metallicities () and low densities keep CO formation rates low while a still substantial FUV radiation field maintains high CO destruction rates. This can yield a CO-dark H2 phase that can be quite massive (Papadopoulos et al., 2002). Any additional CO destruction due to CRs (which propagate freely to the outer Galactic disk) can only further reduce CO/H2, rendering the corresponding molecular gas phase even harder to detect via CO line emission (see also Wolfire et al., 2010, for a recent study of CO-dark H2 gas in the Galaxy).
2.1 The intensity of CO =1–0, 2–1 and Ci 1–0, 2–1 lines
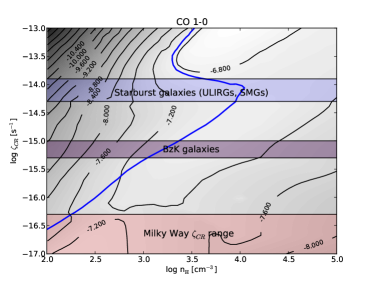
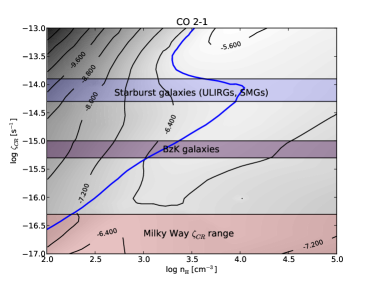
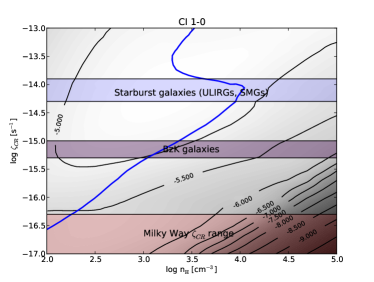
We will now examine the emergent intensities of the CO =1–0, 2–1 (115 GHz, 230 GHz) and Ci =1–0, 2–1 (492 GHz, 809 GHz) lines across the parameter space shown in Fig. 1, in order to access their detectability in CO-poor versus CO-rich gas phases. We choose only the two lowest- CO lines as the only CO transitions that are not excitation-biased, when it comes to the underlying state of the gas necessary to significantly excite them. Higher- CO lines will trace mainly warm and dense H2 gas ( cm-3, ), and are not reliable tracers of the general H2 gas distribution irrespective of its state. Thus =1–0, 2–1 are the CO lines where most observational calibrations of the so-called = factor have been performed (see Bolatto et al., 2013, for a review). The two Ci lines on the other hand are powerful alternatives for tracing the general H2 gas distribution (especially Ci =1–0), often being brighter than CO =1–0, 2–1 in CO-rich gas while remaining luminous even in CO-poor gas (Papadopoulos et al., 2004).
Figure 2 plots the line-integrated intensities of the CO =1–0 and =2–1 transitions. It can immediately be seen that these intensities fall precipitously towards the CO-poor area. Indeed, their strengths relative to those typical in the CO-rich regions range from 0.39 at the “crossing” of the blue line (used to mark the CO-rich/CO-poor transition zone in the parameter space), to only 0.025-0.15 deeper into the CO-poor regions in the upper left corner of the parameter space. Thus CO line observations conducted to yield the same S/N ratio for CO-poor molecular gas distributions would need 7-1600 longer integration time with respect to those of CO-rich regions. The Ci =1–0, 2–1 lines on the other hand shown in Fig. 3, remain bright throughout most of the parameter space, and actually much brighter than the two CO lines444This does not translate to higher S/N ratios for Ci versus CO observations as will be higher at Ci line frequencies. Nevertheless, significant gains in S/N are expected (e.g. Papadopoulos et al., 2004). This enables the two Ci lines to trace gas both in CO-poor and CO-rich regions.
There is also an area of low CO and Ci line intensities in the (high-)/(low-) region of the parameter space (lower right corner) in all plots of both Figs. 2 and 3. This is the area where non-SF, dense gas cores embedded deep into Galactic GMCs are located (e.g. Bok globules). These are very cold regions (10 K), and the reduction of CO =1–0, 2–1 line intensities with respect to the warmer gas in the (lower-)/(higher-) areas almost purely reflects a temperature drop (since CO =1–0, 2–1 are thermalized and optically thick with ). The drop of the Ci line intensity towards that area is due both to this temperature drop (that contributes non-linearly to the intensity reduction since for these lines , especially for Ci =2–1), and a [C/CO] abundance reduction. Nevertheless, given that such dense, cold gas cores contain only small mass fractions (1%) of Galactic GMCs, we do not anticipate that this (CO and Ci)-dark region of parameter space to be of any consequence when it comes to the inventory of H2 gas mass.

2.2 The effect of higher FUV fields
The choice of in our calculations was driven by our intent to isolate the effect of CRs on the average [CO/H2] abundance in molecular clouds. However ISM environments with higher SFR densities boost both the average and the average FUV field . Nevertheless, unlike the boost of the average FUV radiation field is much reduced by the dust absorption in the metal-rich ISM environments we study here. Indeed it is expected to be caped to (Papadopoulos et al., 2014), with higher values such as associated with gas regions near O, B stars that contain only small mass fractions of molecular clouds. Furthermore, in environments of high gas turbulence (typical for ISM with high SFR densities, see also discussion in §5.1) such clouds are expected to have large , much larger than found for Galactic GMCs (see Pelupessy et al., 2006). Thus we do not expect the [CO/H2] to be affected by the average FUV fields for much of the molecular gas mass, a state of affairs which may, however, change for low-metallicity ISM. We must however note that increasing the FUV will result to a higher Cii abundance (and Cii line emission) in low densities.
We nevertheless still performed calculations for and , and found that the corresponding map shown in Fig. 1 to be in excellent agreement for . In addition, we compare the gas temperature of selected simulations with those studied in Meijerink et al. (2011) who included the effect of FUV radiation and also find excellent agreement.
2.3 Comparison with other theoretical models, and a [CO/H2] sensitivity on
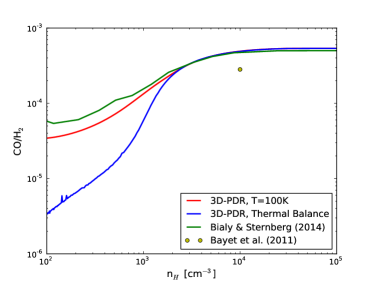
As we noted in the Introduction, theoretical models by Bayet et al. (2011); Meijerink et al. (2011); Bialy & Sternberg (2014) have examined the effects of CRs in uniform density clouds, even if they did not focus on the CR-controlled [CO/H2] abundance and its observational consequences in various extragalactic environments. Figure 4 shows a comparison between Bayet et al. (2011); Bialy & Sternberg (2014) and 3d-pdr results. Red and green lines compare 3d-pdr against Bialy & Sternberg (2014) respectively for isothermal runs at interacting with . It can be seen that the agreement is very good. We note that Bialy & Sternberg (2014) and the present work used different chemical network which can explain the discrepancy of the two curves for , while for the agreement is excellent. Switching on the thermal balance calculations (blue line) makes the CO/H2 ratio lower for while for this ratio is , differing by an order of magnitude with respect to the isothermal runs. This demonstrates the importance of thermal balance calculations in estimating the effect of CRs on CO/H2 as the latter appears to have high sensitivity on gas temperature (see also §2.6). Lower temperatures form O2 via the reaction
| (1) |
which then reacts with C to form CO as shown in Reaction 12 (see §4.1), hence increasing the abundance of the latter.
The above reaction rate can be estimated using the following equation (e.g. Millar et al., 1997):
| (2) |
with , and . For (as obtained by the 3d-pdr runs), while for , . Hence at lower temperatures, such as those found by the thermal balance iterations in this work, the abundance of CO will be higher.
Finally, the yellow circular point corresponds to a simulation presented in Bayet et al. (2011) who included thermal balance calculations but used different chemical network and initial elemental abundances of species resulting in a discrepancy between their work and the present paper. By using the Bayet et al. (2011) initial elemental abundances, we obtain excellent agreement.
2.4 A low-density CO/H2 upwards turnover at high values
The CO/H contour marks a near-linear path across the parameter space for up to . However, for higher values there seems to be a “turnover” of this CO/H2 contour value towards lower densities, i.e. low-density gas starts becoming CO-rich again despite the now exceptionally high CR energy densities. We give a full description of the underlying chemistry of this behaviour in §4.1. We must note that although such CR-intense environments are too extreme to be considered representatives of average conditions in the ISM of SF galaxies, they could be possible locally near highly energetic CR-accelerating phenomena such as supernova explosions and young SNRs.
2.5 A non-uniform cloud model embedded in a 1G∘ FUV field
While our investigation using uniform density 3d-pdr models allows a clear overview of the density-dependence of the CR-induced destruction of CO, and what type of extragalactic environments would be most affected (see Fig.1), it is obviously too simple of an approach when it comes to individual molecular clouds where hierarchical density structures are known to exist. For the present work we choose to investigate the CR-controlled CO/H2 and Ci/CO ratios for a cloud with a simple profile. In the future we will use the full capabilities of our 3d-pdr code where fractal density structures have been recently incorporated to examine the CR effects on the CO and Ci abundances in much more realistic settings (i.e. such as those examined by Walch et al., 2012).
We consider a cloud with radius embedded in an environment with different cosmic-ray ionization rates. In particular, we perform a suite of runs in which we use a density profile following the Larson (1981) power law of by adopting the density function
| (3) |
The above density distribution has the following properties: the central core of the cloud reaches densities up to while at it reaches densities down to . The total mass of the cloud is while its average density is , typical of Galactic GMCs. We also include an external FUV radiation field of intensity . Furthermore, the visual extinction at the centre of the core (measured from the edge of the sphere) is .
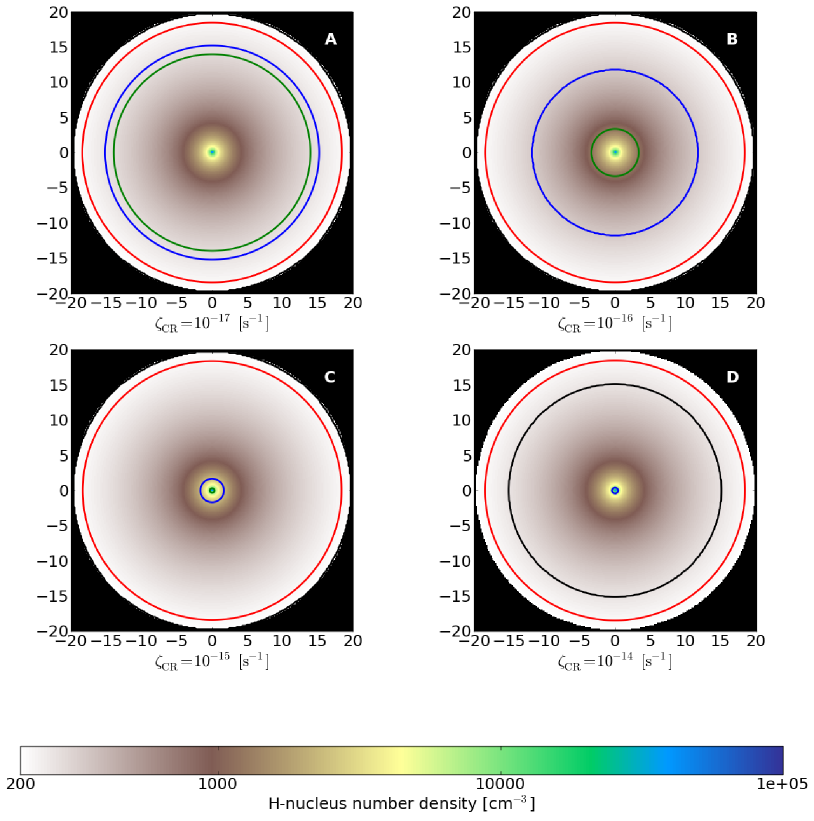
Figure 5 shows the results of the 3d-pdr calculations for different cosmic-ray ionization rates (). We can now see the effects of enhanced CRs within an inhomogeneous cloud. The red line marks a Cii/Ci=5 ratio, with the spherical shell outside that line (i.e. outer part) consisting almost entirely of Cii. The green line corresponds to Ci/CO=5 hence the shell between the red and green lines is Ci-dominated while the rest of the cloud (i.e. inner to the green line) is CO-dominated. The blue line defines the CO/H ratio and hence the maximum volume where CO can easily trace H2. Finally, we also plot the Hi/H2=1 ratio with a black line (visible only in Panel D). The volume inner to that line is H2-dominated, with the outer part where CRs have mostly destroyed H2 to form Hi.
In Table 1 we list the H2 gas mass fractions traceable by CO, Ci and Cii in each case. We find that Cii cannot trace more than 1% of the cloud in any of the cases. As increases, the H2 gas becomes Ci-rich as CO gets destroyed by the reaction with He+. At only remains CO-rich while for most of the cloud is CO-poor (but Ci-rich). Evidently, cosmic rays play a major role in controlling the CO-visibility of H2 gas while leaving the Ci lines as the only alternative molecular gas mass tracers.
| Panel | H2 M | CO & Ci (%) | Ci (%) | Cii (%) | |
|---|---|---|---|---|---|
| A | 1 | 2.47 | 55 | 44 | 1 |
| B | 10 | 2.47 | 33 | 76 | 1 |
| C | 2.47 | 1 | 99 | 1 | |
| D | 1.38 | 0.1 | 99.9 | N/A |
2.6 The importance of thermal balance
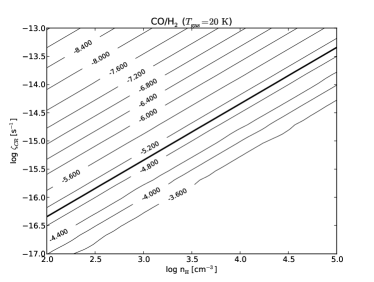
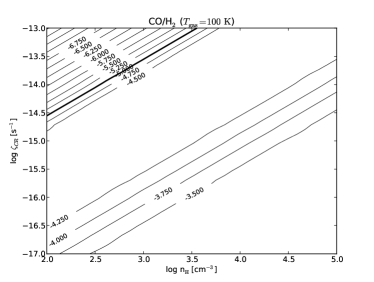
We will now briefly explore the effects of thermal balance on the results of this work. To do this, we switch off the thermal balance iteration scheme in 3d-pdr and instead we run two isothermal grids of runs. Figure 6 plots the CO/H2 ratio in the and parameter space for (left panel) and (right panel). The thick solid line corresponds to CO/H. In both cases, the CO/H2 ratio follows a linear behaviour with and thus demonstrating that the dependence of the chemical reactions on the gas temperature in such cosmic-ray dominated environments is a highly non-linear and at the same time a very important one. Indeed Bialy & Sternberg (2014), which used an analytical approach (and simpler chemical pathways) along with an isothermal assumption (at ), do not recover this behavior, nor do they find the large reduction of CO/H2 at high CR energy densities.
3 A secondary effect: clumpy low- CO emission in gas-rich SF disks?
A secondary effect that may occur in H2-rich galactic disks permeated by high backgrounds (boosted by the intense star formation typically hosted by such disks) which destroy CO more effectively at lower gas densities is to make such disks appear clumpy in low- CO line emission555Molecular gas disks in CO and higher- CO line emission are expected to appear much clumpier than in CO , because high- CO lines sample only the more compact dense and warm gas regions near SF sites while CO =1–0, 2–1 are expected to trace the entire molecular gas distribution (as long as it is CO-rich).. This can occur simply because the CR-induced destruction of CO, being more effective at lower densities, will leave only smaller and denser parts of molecular clouds to be CO-rich. The appearance of such clouds or cloud ensembles via their low- CO line emission will then be much clumpier, depending on the average background and the underlying mass-density function of the molecular clouds. Finally, if lower density molecular clouds lie preferably at larger galactocentric distances, such CR-inundated molecular gas disks could appear more compact in low- CO emission than they actually are. Such large scale CR-induced effects on the (CO-line)-visibility of the H2 gas distribution in galaxies can only be accentuated once metallicity gradients (with lower-metallicity gas found preferably at larger galactocentric distances) are also taken into account (see also §5.1).
There are now several deep CO , images available for gas-rich SF systems in the distant Universe (e.g. Daddi et al., 2010; Ivison et al., 2010; Riechers et al., 2011; Hodge et al., 2012), with clumpy gas disks often claimed (e.g. Hodge et al., 2012). In such cases it would be interesting to also conduct deep Ci =1–0, 2–1 line imaging since Ci is a by-product of the CR-induced CO destruction which remains abundant also in CO-rich molecular gas. Thus it can then trace any CO-dark gas along with its CO-rich phase (see Fig.1), and may thus reveal smoother H2 gas distributions in CR-permeated SF disks than the CO =1–0, 2–1 lines.
On the theoretical front, hydrodynamical simulations of gas-rich disks with: a) high enough resolution to track the molecular cloud turbulence (which sets their ) and b) detailed H2, CO formation/destruction chemical networks, can elucidate whether CRs can induce such a bias on the structural characteristics of H2-rich disks derived from CO =1–0, 2–1 lines (see also §5.2).
4 A chemical and analytical determination of the CO-dark H2 domain
A main result of this study is the discovery of a large area in the parameter space where gas is mostly molecular but CO-poor. In this Section we identify the responsible chemical pathways for this behaviour, then attempt to find an analytical equation that could be used in purely (hydro-)dynamical codes for determining the average CO/H2 ratio as a function of gas density and in turbulent molecular gas clouds.
4.1 The chemistry of H2 and CO
While the main chemical formation and destruction routes of both H2 and CO in the gas phase are very well known, in order to understand the region in the plane of Fig.1 where CO is destroyed but H2 is not, one needs to take into consideration several more chemical reactions as a function of these two parameters. We perform a chemical analysis of three representative such models outlining that region (their properties in tabulated in Table 2 and the rates used for the reactions presented below are shown in Table 3). We note, however, that the chemical pathway and particularly the efficiency of the reaction rates follows a non-linear behavior, therefore the analysis below is very model-dependent and hence should be taken as qualitative.
| Model ID | ||
|---|---|---|
| M1 | 2.5 | -16 |
| M2 | 2.5 | -15 |
| M3 | 3.5 | -15 |
| Reaction | |||
|---|---|---|---|
| 4 | |||
| 5 | |||
| 6 | |||
| 7 | |||
| 8 | |||
| 9 | |||
| 10 | |||
| 11 | |||
| 12 | |||
| 13 | |||
| 14 |
In M1 and M2, H2 is mainly formed by the ion-neutral reaction:
| (4) |
which contributes (70-90) % to the formation of H2. For the formation of H2 the behaviour is similar for the model M3, with the difference that the ion-neutral reactions forming H2 are:
| (5) | |||
| (6) | |||
| (7) |
H2 is then destroyed in almost equal efficiencies by recombination and cosmic rays ionization in all models:
| (8) | |||
| (9) |
Hence cosmic rays, although an efficient mean of destruction, are not necessarily the dominant route. CO on the other hand is formed mainly via neutral-neutral reactions in M1, with the two most efficient ( each) routes being:
| (10) | |||
| (11) |
with some contribution ( 15%) from:
| (12) |
In M2, the Reaction 12 is not important but the rest of CO is formed via the ion-neutral reaction:
| (13) |
Interestingly, in M3 CO forms only via the neutral-neutral reactions listed above (i.e Reactions 10–12).
However, in all models CO is always very efficiently destroyed indirectly by cosmic rays, via He+ (which forms via cosmic ray ionization) with the reaction:
| (14) |
It therefore seems that a main reason for a CO-dark H2 phase is that a higher cosmic ray ionization rate drives a higher rate of destruction of CO, but has a much less dramatic effect on H2. It is worth noting here that He+ can be destroyed by reacting with H2; this reaction has a small barrier leading to its rate coefficient becoming a factor of two higher at (i.e. the gas temperature that Bialy & Sternberg, 2014, considered) than at (i.e. the gas temperature of the M3 model), possibly reducing He+ enough to allow CO to survive at higher abundances. A thorough investigation of the chemistry, as a function of temperature, that can lead to a CO-poor/H2-rich environment is beyond the scope of this paper but it is clear that chemistry resulting from a high cosmic ray ionization rate when thermal balance is taken into account is not easily determined a priori.
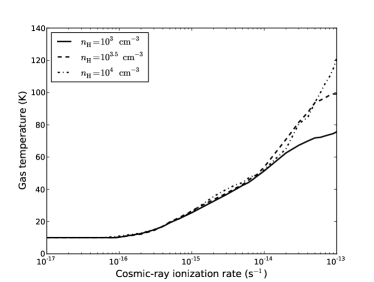
Fig.1 also shows a high regime with a small parameter space where the general trend of (higher-)(higher-n gas becoming CO-poor) is reversed. In the left panel of Fig.7 we now show how CO/H2 varies with increasing for three different number densities, while the right panel shows the corresponding gas temperatures. The left panel of Fig.7, for a density range and , shows the reversal of the aforementioned trend, with high-density gas becoming CO-rich again despite the now very high values. This reversal is much less prominent for low-density gas. We ran a chemical analysis for these models and we found that He+ is efficiently (by ) destroyed by:
| (15) |
where M stands for metals for which we used a total elemental fractional abundance of 410-5 (Asplund et al., 2009). Note that Reaction 15 is not very efficient in models where CO decreases with cosmic ray ionization rate.
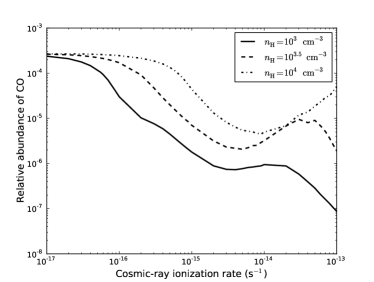
Nevertheless such extreme CR-permeated gas regions where this effect can take place are unlikely to be representative of average ISM conditions even in the most extreme merger/starbursts known, yet they could be found near or within young SNRs. In such a case the effect described here may indicate the survival of the CO molecule in dense molecular gas within some truly extreme CR-dominated regions.
4.2 An analytical approximation of the the CO-dark H2 domain
The left panel of Fig.8 is a contour plot showing 3d-pdr results of the as a function of and . The following function is best fit to our data:
| (16) |
and is plotted in the right panel of Fig.8. This equation is applicable for negligible FUV radiation within a cloud, typically for (the case for most H2 gas mass in starbursts). In cases where FUV radiation is significant this parametric equation still provides a maximum CO/H2 abundance ratio possible for a given average SFR density (since FUV can only destroy CO further while leaving the mostly self-shielding H2 intact).
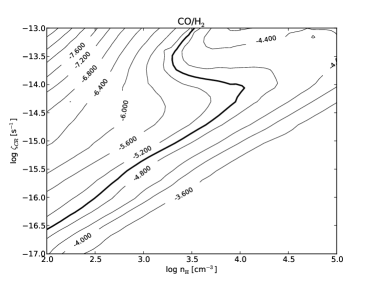
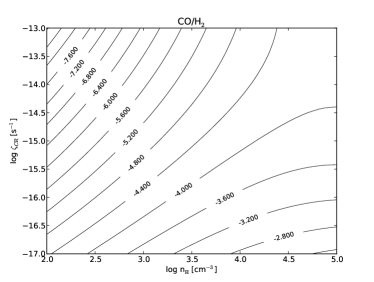
This relation cannot track the behaviour of CO/H2 as extracted from the detailed 3d-pdr models in some domains (e.g. at and very high cosmic ray ionization). However for the parameter space where most of the molecular gas mass of SF galaxies is expected to be this relation gives reasonably good results666The coefficients have a 95% confidence bounds, and a Mean Squared Error (MSE) analysis on this function yields an MSE of 0.04; and as Mean Absolute Percentage error (MAPE) of 3.5%.. It can then be used in galaxy-sized or cosmology-sized hydrodynamic simulations of atomic and molecular gas and stars where the underlying molecular cloud physicsis treated in a sub-grid fashion (Pelupessy & Papadopoulos, 2009; Narayanan et al., 2011; Lagos et al., 2012; Christensen et al., 2012). Such simulations are frequently used to predict the CO-deduced versus the true H2 gas distributions in galaxies (e.g. Pelupessy & Papadopoulos, 2009) or make predictions of CO line luminosities of galaxies in a cosmological setting (e.g. Lagos et al., 2012). Yet none currently takes into account the expected strong effects of CRs, driven by the often high and strongly evolving SFR densities found in the Early Universe.
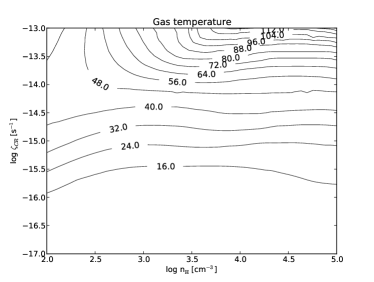
In the case of cosmological simulations used to predict CO SLEDs for galaxies in a CDM universe (e.g. Lagos et al., 2012) knowing the temperature of CR-heated gas in the CO-rich and CO-poor phases is also important. In Fig.9 we show the temperatures attained by the molecular gas within the parameter space explored. Finally, from our work is now clear that Ci =1–0, 2–1 line emission is important for recovering the CO-poor H2 gas distribution along with the CO-rich one in galaxies. Cosmological simulations of Ci line luminosities in galaxies have been recently published (Tomassetti et al., 2014), but without taking into account the important effects of CRs in regulating the CO/H2 and Ci/H2 abundance ratios.
5 Discussion
Quite unlike the FUV radiation fields incident on molecular clouds, CRs can destroy CO equally efficiently throughout their volume rather than mostly at outer cloud layers. CRs can thus be the main regulator of the CO-′′visibility′′ of molecular gas in SF galaxies with the FUV-induced CO destruction a secondary one. Only for low-metallicity molecular gas in high-intensity radiation the FUV-induced CO destruction can surpass the CR-induced one. Nevertheless, given that high average FUV fields are found in places of elevated SFR densities, and thus also of boosted , the two effects will always operate in parallel, even as the average FUV radiation fields will not follow the rise of to high values in a proportional manner in metal-rich SF environments (see Papadopoulos et al., 2014, for details).
In future work we will explore the combined effects of high and on molecular gas with a range of metallicities. Given the non-linear effects behind the FUV-induced and CR-induced CO destruction, these may be much more dramatic than either effect alone. FUV-intense environments with low average metallicities will be typical in the early Universe, either over entire galaxies (e.g. Ly-break galaxies, dwarfs) or in the outer, metal-poor, parts of SF disks in the process of building up their present-epoch Z(R) gradients.
5.1 Two caveats: CR penetration, and the effects of turbulence
Our analysis has been based on the assumption that , and that CRs penetrate into most of the volume of molecular clouds. There are good observational and theoretical arguments supporting both these assumptions, reviewed in Papadopoulos (2010). Briefly, the first assumption underlies the so-called far-IR/radio correlation established for galaxies whose radio and far-IR emission are powered by star formation, while the second one is supported by -ray observations of -rich starbursting galactic centers, and by the thermal, ionization, and chemical states observed for FUV-shielded dense molecular gas cores in the Galaxy (Bergin & Tafalla, 2007). Finally, if CRs were unable to penetrate deep inside the FUV-shielded regions of molecular clouds there would be no molecules present other than since CRs, by driving the formation in such regions, initiate the chemical network beyond the basic molecule (itself formed on dust grains).
The effects of strong turbulence on a CR-controlled CO/H2 ratio, and its consequences for the CO-′′visibility′′ of gas in SF galaxies, are difficult to assess within the static framework of our work. The necessity of a dynamical approach can be shown simply by noting that the turbulent diffusion timescales are typically shorter than chemical-equillibrium timescales , the latter approximated by the timescale needed for an Hi/H2 equillibrium to be reached (e.g. Hollenbach & Tielens, 1999). Indeed for an initially atomic Cold Neutral Medium (CNM) phase (and a canonical H2 formation rate on grains of ) it is yrs, while (with , Xie et al., 1995) ranges from yrs for quiescent GMCs (turbulent linewidths of ) to yrs for clouds typical of ULIRG environments (Papadopoulos et al., 2004, and references therein) The supersonic turbulence that dominates the velocity fields of molecular clouds is expected to influence our results in two distinct ways namely: a) by strongly “mixing” outer and inner cloud layers (and thus also the respective abundances of the various species formed in those cloud regions), and b) by controlling the molecular cloud mass fraction over the gas density range i.e. the function (Vazquez-Semadeni, 1994; Padoan & Nordlund, 2002, and references therein). Early work on the first issue by Xie et al. (1995) indicates that it is the abundances established on the outer cloud layers (i.e. the CO-poor/Ci-rich ones in CR-immersed clouds with realistic density profiles) that will act to “dilute” the inner, denser, CO-rich/Ci-poor regions. Furthermore, the typically stronger turbulence of the outer lower-density molecular cloud regions with respect to the inner more quiescent ones can only enhance such turbulent diffusion transfer of outer layer abundances inwards. These effects would then further reduce the CO-visibility of turbulent molecular clouds immersed in high CR energy density backgrounds.
Regarding the second issue, we note that galaxies with high average values like ULIRGs are typically also those with much higher levels of turbulence (and hence dense gas mass fractions which in turn “fuel” their high ). Indeed the face-on velocity dispersion of the molecular gas disks in ULIRGs is (30-140) km s-1 (Downes & Solomon, 1998), much higher than in isolated spiral disks (10 km s-1). As a result the underlying would “shift” most of the mass of a molecular cloud towards high densities ( cm-3), and thus towards the CO-rich part of the parameter space shown in Fig.1, perhaps despite the also high average expected in such environments. Only hydrodynamical simulations of molecular clouds with such high levels of turbulence and the appropriate chemical networks for CO and H2 formation and destruction can decide this issue. On the other hand it is worth pointing out that the cm-emission synchrotron disks of galaxies (rough indicators of the extend of CR propagation) are typically larger than the CO-visible molecular gas distributions. Thus starburst-originating CRs may affect the CO/H2 ratio beyond the starburst region itself, where lower-density, non-SF, molecular clouds may lie.
5.2 Some observational tests
A mainly CR-controlled CO/H2 ratio in the molecular clouds of SF galaxies has some interesting observational consequences, which can be probed using the JVLA and ALMA, the two interferometer arrays operating in cm and mm/submm wavelengths with high sensitivities. The JVLA can image the cm synchrotron radiation emitted by CR electrons (and thus serve as a probe of CR propagation through galactic disks and individual molecular clouds), while ALMA can image the spectral lines of various species emanating from CR-permeated molecular gas, to yield tests of a CR-controlled chemistry. More specifically:
-
1.
Deep imaging of the cm continuum of gas-rich SF disks along with CO =1–0, 2–1 and Ci =1–0, 2–1 line imaging can reveal the distribution of CR-permeated molecular gas, and probe the structural characteristics of the molecular gas distribution as recovered via Ci lines versus those using the two low- CO lines.
-
2.
Imaging of individual molecular clouds in nearby SF galaxies in cm synchrotron continuum as well as in CO =1–0, 2–1 and Ci =1–0, 2–1 lines in order to examine the effects of CRs in individual GMCs.
-
3.
Any molecular line observations constraining the average x(e) (ionization fraction) within molecular clouds, versus CR distribution (traced by cm continuum imaging), can reveal whether CRs penetrate throughout GMC volumes determining their chemistry (e.g. x(e) correlating with cm emission brightness).
Generally in high CR energy density environments we expect clouds to be marked by the usual CO-bright emission emanating from the regions that are dense enough to retain their CO-richness, yet having Ci line emission extending much further out than those CO-bright regions, tracing a CO-poor phase where CO has been destroyed by CRs. Given the elevated temperatures of the latter phase (see Figs.7 & 9) we expect both the Ci =1–0 (24 K) and Ci =2–1 (62 K) to be substantially excited. In principle this allows Ci line imaging observations of SF disks to access a larger co-moving volume of the Universe and serve as alternative gas distribution tracers.
6 Conclusions
In this paper we examined the impact of CRs on the average CO/H2 ratio in clouds. We find that even ordinary boosts of CR energy densities, expected in numerous SF galaxies in the Universe, can destroy CO (but not ), so effectively as to render potentially large gas reservoirs CO-poor and difficult to trace using conventional CO =1–0, 2–1, line imaging. This is a density-dependent effect, with denser regions able to retain higher CO/H2 ratios than low-density ones, for a given CR energy density (and thus CR ionization rate). This may give rise to a second order effect with gas disks that host vigorous SF, appearing clumpier in CO =1–0, 2–1 emission than they really are, their denser (and clumpier) gas regions having retained large enough CO/H2 ratios as to remain CO-visible, unlike the CO-poor lower-density ones. Furthermore, even for CR energy density backgrounds expected in the Milky Way, low-density gas () can also be very CO-poor. The CR-induced destruction of CO leaves behind a Ci-rich molecular gas phase, with only small amounts of Cii. The Ci =1–0, 2–1 lines are then the only remaining effective mass distribution tracers, encompassing both for the CO-rich and the CO-poor phase.
Strong turbulence, often found for the molecular gas of vigorously SF galaxies, can in principle help maintain much of it CO-rich (and thus CO-line-visible), by placing most of it at high average densities. Hydrodynamical simulations of highly turbulent, CR-irradiated molecular gas, which incorporate the appropriate CO, H2 formation/destruction chemical networks, are necessary to explore this issue. On the observational front deep Ci, low- CO line, and cm continuum imaging observations of SF galaxies and individual molecular clouds embedded in environments of high , are key in exploring a CR-regulated CO/H2 ratio in clouds. We expect the Ci line emission to extend well beyond that of low- CO line emission if that is indeed so.
Appendix A The numerical model
We use 3d-pdr (Bisbas et al., 2012), a three-dimensional time-dependent astrochemistry code implemented at University College London and designed for treating PDRs of arbitrary density distribution. The code has been used in various applications examining galactic and extragalactic objects (i.e. Offner et al., 2013, 2014; Bisbas et al., 2014; Gaches et al., 2014). For the purposes of this work, we perform high resolution one-dimensional uniform-density clouds as discussed in Bisbas et al. (2012). We use a subset of the UMIST 2012 network (McElroy et al., 2013) consisting of 58 species and more than 600 reactions. The abundances of species relative to hydrogen we used are [He]=, [C]=, [O]=, [Mg]=, and [S]= which correspond to undepleted solar abundances (Asplund et al., 2009). Full technical details can be found in Bisbas et al. (2012) and in Bisbas et al. (2014) for further updates.
In the simulations presented here, we use an expression for molecular line optical depths suitable for macroturbulent molecular clouds. Thus in the expression of for the line transition of
| (A1) |
(where is the Einstein coefficient, is the line frequency, the populations and , their corresponding statistical weights of levels and ), we set as:
| (A2) |
suitable for a mostly self-gravitating gas phase (Papadopoulos & Seaquist, 1999), where depends on the assumed density profile and is the total H-nucleus density. This ensures that the optical depth of the transition is a local quantity everywhere within the cloud, as expected for macroturbulent velocity fields. For this work we adopt .
References
- Asplund et al. (2009) Asplund, M., Grevesse, N., Sauval, A. J., & Scott, P. 2009, ARA&A, 47, 481
- Bialy & Sternberg (2014) Bialy, S., & Sternberg, A. 2014, arXiv:1409.6724
- Bayet et al. (2011) Bayet, E., Williams, D. A., Hartquist, T. W., & Viti, S. 2011, MNRAS, 414, 1583
- Bell et al. (2006a) Bell, T. A., Roueff, E., Viti, S., & Williams, D. A. 2006a, MNRAS, 371, 1865
- Bell et al. (2006b) Bell, T. A., Hartquist, T. W., Viti, S., & Williams, D. A. 2006b, A&A, 459, 805
- Bergin & Tafalla (2007) Bergin, E. A., & Tafalla, M. 2007, ARA&A, 45, 339
- Bisbas et al. (2012) Bisbas, T. G., Bell, T. A., Viti, S., Yates, J., & Barlow, M. J. 2012, MNRAS, 427, 2100
- Bisbas et al. (2014) Bisbas, T. G., Bell, T. A., Viti, S., et al. 2014, MNRAS, 443, 111
- Bolatto et al. (1999) Bolatto, A. D., Jackson, J. M., & Ingalls, J. G. 1999, ApJ, 513, 275
- Bolatto et al. (2013) Bolatto, A. D., Wolfire, M., & Leroy, A. K. 2013, ARA&A, 51, 207
- Bryant & Scoville (1996) Bryant, P. M., & Scoville, N. Z. 1996, ApJ, 457, 678
- Christensen et al. (2012) Christensen, C., Quinn, T., Governato, F., et al. 2012, MNRAS, 425, 3058
- Cronin et al. (1976) Cronin, N. J., Gillespie, A. R., Huggins, P. J., & Phillips, T. G. 1976, A&A, 46, 135
- Daddi et al. (2014) Daddi, E., Dannerbauer, H., Liu, D., et al. 2014, arXiv:1409.8158
- Daddi et al. (2010) Daddi, E., Bournaud, F., Walter, F., et al. 2010, ApJ, 713, 686
- Devereux et al. (1994) Devereux, N., Taniguchi, Y., Sanders, D. B., Nakai, N., & Young, J. S. 1994, AJ, 107, 2006
- Dickman et al. (1986) Dickman, R. L., Snell, R. L., & Schloerb, F. P. 1986, ApJ, 309, 326
- Downes & Solomon (1998) Downes, D., & Solomon, P. M. 1998, ApJ, 507, 615
- Draine (1978) Draine, B. T. 1978, ApJS, 36, 595
- Dumke et al. (2001) Dumke, M., Nieten, C., Thuma, G., Wielebinski, R., & Walsh, W. 2001, A&A, 373, 853
- Gaches et al. (2014) Gaches, B. A. L., Offner, S. S. R., Rosolowsky, E. W., & Bisbas, T. G. 2014, arXiv:1412.2754
- Gao & Solomon (2004) Gao, Y., & Solomon, P. M. 2004, ApJS, 152, 63
- Glover et al. (2014) Glover, S. C. O., Clark, P. C., Micic, M., & Molina, F. 2014, arXiv:1403.3530
- Graciá-Carpio et al. (2006) Graciá-Carpio, J., García-Burillo, S., Planesas, P., & Colina, L. 2006, ApJ, 640, L135
- Graciá-Carpio et al. (2008) Graciá-Carpio, J., García-Burillo, S., Planesas, P., Fuente, A., & Usero, A. 2008, A&A, 479, 703
- Greve et al. (2009) Greve, T. R., Papadopoulos, P. P., Gao, Y., & Radford, S. J. E. 2009, ApJ, 692, 1432
- Guesten et al. (1993) Guesten, R., Serabyn, E., Kasemann, C., et al. 1993, ApJ, 402, 537
- Hodge et al. (2012) Hodge, J. A., Carilli, C. L., Walter, F., et al. 2012, ApJ, 760, 11
- Hollenbach & Tielens (1999) Hollenbach, D. J., & Tielens, A. G. G. M. 1999, Reviews of Modern Physics, 71, 173
- Hughes et al. (1998) Hughes, D. H., Serjeant, S., Dunlop, J., et al. 1998, Nature, 394, 241
- Hughes et al. (2010) Hughes, A., Wong, T., Ott, J., et al. 2010, MNRAS, 406, 2065
- Israel (1997) Israel, F. P. 1997, A&A, 328, 471
- Ivison et al. (2010) Ivison, R. J., Smail, I., Papadopoulos, P. P., et al. 2010, MNRAS, 404, 198
- Krips et al. (2008) Krips, M., Neri, R., García-Burillo, S., et al. 2008, ApJ, 677, 262
- McElroy et al. (2013) McElroy, D., Walsh, C., Markwick, A. J., et al. 2013, A&A, 550, A36
- Lagos et al. (2012) Lagos, C. d. P., Bayet, E., Baugh, C. M., et al. 2012, MNRAS, 426, 2142
- Larson (1981) Larson, R. B. 1981, MNRAS, 194, 809
- Leech et al. (2010) Leech, J., Isaak, K. G., Papadopoulos, P. P., Gao, Y., & Davis, G. R. 2010, MNRAS, 406, 1364
- Madden et al. (1997) Madden, S. C., Poglitsch, A., Geis, N., Stacey, G. J., & Townes, C. H. 1997, ApJ, 483, 200
- Maloney & Black (1988) Maloney, P., & Black, J. H. 1988, ApJ, 325, 389
- Mao et al. (2010) Mao, R.-Q., Schulz, A., Henkel, C., et al. 2010, ApJ, 724, 1336
- Meijerink et al. (2011) Meijerink, R., Spaans, M., Loenen, A. F., & van der Werf, P. P. 2011, A&A, 525, AA119
- Millar et al. (1997) Millar, T. J., Farquhar, P. R. A., & Willacy, K. 1997, A&AS, 121, 139
- Narayanan et al. (2011) Narayanan, D., Krumholz, M., Ostriker, E. C., & Hernquist, L. 2011, MNRAS, 418, 664
- Nguyen et al. (1992) Nguyen, Q.-R., Jackson, J. M., Henkel, C., Truong, B., & Mauersberger, R. 1992, ApJ, 399, 521
- Offner et al. (2013) Offner, S. S. R., Bisbas, T. G., Viti, S., & Bell, T. A. 2013, ApJ, 770, 49
- Offner et al. (2014) Offner, S. S. R., Bisbas, T. G., Bell, T. A., & Viti, S. 2014, MNRAS, 440, L81
- Padoan & Nordlund (2002) Padoan, P., & Nordlund, Å. 2002, ApJ, 576, 870
- Paglione et al. (1997) Paglione, T. A. D., Jackson, J. M., & Ishizuki, S. 1997, ApJ, 484, 656
- Pak et al. (1998) Pak, S., Jaffe, D. T., van Dishoeck, E. F., Johansson, L. E. B., & Booth, R. S. 1998, ApJ, 498, 735
- Papadopoulos & Seaquist (1999) Papadopoulos, P. P., & Seaquist, E. R. 1999, ApJ, 516, 114
- Papadopoulos et al. (2002) Papadopoulos, P. P., Thi, W.-F., & Viti, S. 2002, ApJ, 579, 270
- Papadopoulos et al. (2004) —, 2004, MNRAS, 351, 147
- Papadopoulos (2007) Papadopoulos, P. P. 2007, ApJ, 656, 792
- Papadopoulos et al. (2007) Papadopoulos, P. P., Isaak, K. G., & van der Werf, P. P. 2007, ApJ, 668, 815
- Papadopoulos (2010) Papadopoulos, P. P. 2010a, ApJ, 720, 226
- Papadopoulos et al. (2010) Papadopoulos, P. P., van der Werf, P., Isaak, K., & Xilouris, E. M. 2010b, ApJ, 715, 775
- Papadopoulos et al. (2012) Papadopoulos, P. P., van der Werf, P. P., Xilouris, E. M., et al. 2012a, MNRAS, 426, 2601
- Papadopoulos et al. (2012) Papadopoulos, P. P., van der Werf, P., Xilouris, E., Isaak, K. G., & Gao, Y. 2012b, ApJ, 751, 10
- Papadopoulos et al. (2014) Papadopoulos, P. P., Zhang, Z.-Y., Xilouris, E. M., et al. 2014, ApJ, 788, 153
- Pelupessy et al. (2006) Pelupessy, F. I., Papadopoulos, P. P., & van der Werf, P. 2006, ApJ, 645, 1024
- Pelupessy & Papadopoulos (2009) Pelupessy, F. I., & Papadopoulos, P. P. 2009, ApJ, 707, 954
- Riechers et al. (2011) Riechers, D. A., Hodge, J., Walter, F., Carilli, C. L., & Bertoldi, F. 2011, ApJ, 739, LL31
- Smail et al. (1997) Smail, I., Ivison, R. J., & Blain, A. W. 1997, ApJ, 490, L5
- Solomon et al. (1992) Solomon, P. M., Downes, D., & Radford, S. J. E. 1992, ApJ, 387, L55
- Solomon et al. (1997) Solomon, P. M., Downes, D., Radford, S. J. E., & Barrett, J. W. 1997, ApJ, 478, 144
- Tomassetti et al. (2014) Tomassetti, M., Porciani, C., Romano-Díaz, E., Ludlow, A. D., & Papadopoulos, P. P. 2014, MNRAS, 445, L124
- van Dishoeck (1998) van Dishoeck, E. F. 1998, The Molecular Astrophysics of Stars and Galaxies, edited by Thomas W. Hartquist and David A. Williams. Clarendon Press, Oxford, 1998., p.53, 4, 53
- Vazquez-Semadeni (1994) Vazquez-Semadeni, E. 1994, ApJ, 423, 681
- Walch et al. (2012) Walch, S. K., Whitworth, A. P., Bisbas, T., Wünsch, R., & Hubber, D. 2012, MNRAS, 427, 625
- Wilson et al. (1970) Wilson, R. W., Jefferts, K. B., & Penzias, A. A. 1970, ApJ, 161, L43
- Wolfire et al. (2010) Wolfire, M. G., Hollenbach, D., & McKee, C. F. 2010, ApJ, 716, 1191
- Xie et al. (1995) Xie, T., Allen, M., & Langer, W. D. 1995, ApJ, 440, 674
- Yao et al. (2003a) Yao, L., Seaquist, E. R., Kuno, N., & Dunne, L. 2003, ApJ, 588, 771 (2003a)
- Yao et al. (2003b) Yao, L., Seaquist, E. R., Kuno, N., & Dunne, L. 2003, ApJ, 597, 1271 (2003b)
- Young & Scoville (1991) Young, J. S., & Scoville, N. Z. 1991, ARA&A, 29, 581
- Zhang et al. (2014) Zhang, Z.-Y., Gao, Y., Henkel, C., et al. 2014, ApJ, 784, LL31