ICMMO, UMR 8182, Université Paris Sud and CNRS, 91405 Orsay, France
Materials Sciences Division, Lawrence Berkeley National Laboratory, Berkeley, CA 94720, USA
Department of Physics, University of California Berkeley, CA 94720, USA
Rutgers Center for Emergent Materials and Department of Physics & Astronomy, Rutgers, Piscataway, New Jersey 08854, USA
Institut für Festkörperphysik, Karlsruher Institut für Technologie, D-76021 Karlsruhe, Germany
Laboratoire Leon Brillouin, CEA-Saclay, F-91191 Gif sur Yvette Cedex, France
ESRF - The European Synchrotron, CS40220, 38043 Grenoble Cedex 9, France
Hole-doped cuprate superconductors Pseudogap regime in cuprate superconductors Properties of superconductors: phonons Phonon-electron interactions Phonons in crystal lattices: Measurements X-ray scattering Neutron inelastic scattering
Observation of low energy dispersive modes in underdoped \chem(La,Nd)_2-xSr_xCuO_4
Abstract
We find excitations lower in energy than known phonon modes in underdoped La2-xSrxCuO4+δ (x=0.08), with both inelastic X-Ray scattering (IXS) and inelastic neutron scattering (INS). A non dispersive excitation at 9 meV is identified and is also seen by INS in (La,Nd)2-xSrxCuO4+δ, with 40 Nd substitution. INS also identifies a still lower energy dispersive mode at low q in the Nd free sample. These modes are clearly distinct from the longitudinal acoustic phonon and correspond in energy to the Zone Centre modes measured by optical spectroscopy and associated with stripe dynamics.
pacs:
74.72.Ghpacs:
74.72.Kfpacs:
74.25.Kcpacs:
63.20.kdpacs:
63.20.ddpacs:
78.70.Ckpacs:
78.70.NxThe relevance of exotic charge-modulation states and their co-existence with the superconducting state in underdoped high temperature superconductors is a subject of current debate. This state has now been conclusively detected in a variety of materials where this ordering is static and is linked to lattice deformations and strain [1, 2, 3, 4, 5, 6, 7]. Reports of static stripes exist also in materials like nickelates [8, 9, 10] where superconductivity is never attained while in cuprates pinning of stripes by lattice deformations is accompanied by suppression of superconductivity [2, 3, 4, 5, 6]. Available evidence of dynamical charge-modulations coexisting with superconductivity is mostly indirect [11, 12, 13, 14].
A related debate concerns the interpretation of charge-modulations in cuprates as either stripes, i.e., driven by Coulomb repulsion [2], or as Charge-Density-Waves (CDW) either driven by lattice deformations as originally claimed [14], or, more recently, by a nesting of the Fermi Surface [15, 7]. The two interpretations give completely different doping dependences of the charge modulation wave-vector: for the first one we expect an increase with hole-doping [2, 3, 4], while for the CDW nesting-driven case we expect a decrease with hole-doping [15]. Both scenarios yield comparable wave-vectors close to x 1/8 where they are most easily detected [16]. Hence it is fundamental to characterize possible signatures of such charge-modulations across the entire phase diagram of cuprates.
Optical spectroscopies such as Raman and infrared experiments have revealed the presence of two new low energy modes in underdoped La2-xSrxCuO4+δ [17, 18, 19, 20, 21]. The first mode occurs at 25 cm-1 ( 3 meV) at low temperature [17, 18, 20] and shows a strong temperature dependence: as the temperature increases the mode frequency increases up to 200 cm-1 while its intensity decreases, eventually becoming zero above 200 K [17]. The second mode occurs at higher energy, at about 80 cm-1 ( 10 meV) [18] at low temperature. More recently, time-resolved optical spectroscopy in the femto-second regime showed a resonant mode of about 2.0 THz frequency that corresponds to the same energy range ( 70 cm-1 or 8 meV) [22]. Such mode is interpreted as an amplitudon, in line with Ref. [18], suggesting a charge-density-wave like model.
The interpretation of these Raman modes is the subject of debate: do they result solely from scattering by electronic excitations [17, 19] or are they coupled charge-lattice modes [18]?
Recently IXS experiments have reported anomalies in low energy acoustic modes or additional modes at lower energies in cuprate Bi2201 [23] and oxychlorides [24]. In the ”123” family (as YBCO, NdBCO,…) acoustic phonon anomalies have been detected [25], and linked to CDW [25, 7]. However the charge modulations in the ”123” family bear distinct feature from the one of the ”214” family (e.g. \chem(La,Nd)_2-xSr_xCuO_4) we study here. In particular the ”123” family show no associated spin-fluctualtion [7] in strike contrast to what observed in the ”214” one [2, 3].
Here we report an observation of anomalous low energy modes for the first time in underdoped La2-xSrxCuO4+δ using both IXS as in the above cited studies, as well as INS, thus narrowing drastically the possible origins of the nature of the excitation and its dispersion. We identify two additional modes at energies compatibles with the results obtained by optical spectroscopies[17, 18, 20] at the zone centre, and extend the observation to the whole Brillouin Zone, as well as to the Nd substituted sample. In the y=0.4 Nd substituted sample where the charge modulation is pinned [2] we still observe a non dispersive mode while the lower energy dispersive mode is much weaker, and even not detected for reduced wave-vectors with 0.2 0.4. Using inelastic neutron scattering, we have explored the same (Q,E) region in a crystal with the same doping, x=0.08, in order to identify the possible origin of these excitations by comparing neutron and non-resonant X ray cross sections. We find strong evidence that they are coupled to lattice modes.
IXS and INS measurements were performed on two underdoped La2-xSrxCuO4+δ both with x=0.08, where Raman measurements [18] report the strongest intensities for the extra modes. The crystal for INS measurements (sample label S1) has cylindrical shape with an average diameter of about 6 mm, a height in the order of of 35 mm and Tc=20 K, while on IXS experiments we measured a second crystal with a platelet shape, about 0.5 mm thick and few mm wide, with Tc=(20.70.2) K (sample label S2). With INS we also measured a La2-x-yNdySrxCuO4+δ crystal of cylindrical shape with an average diameter of about (5 0.5) mm and a height of 25 mm grown from the melt in an image furnace by the traveling solvent floating zone method, with with x=0.08 (as above) and y=0.4 (Tc=(7.50.25) K, sample label SNd).
The sample was mounted in reflection geometry on the cold finger of a closed-loop helium cryostat. The sample crystal axis was perpendicular to the scattering plane, with a beam spot of h v 0.3 0.1 mm, while the cm3 sample for the INS experiment was completely irrigated by the neutron beam. The highly collimated X-ray beam and small sample size result in a small probed volume and an angular width of FWHM for the (4 0 0) Bragg reflection. In the neutron experiment we measured (S1) and (SNd) FWHM for the (2 0 0) reflection. Phonons were measured in the fourth Brillouin zone in the IXS experiment and from second to third zones by INS. The IXS spectrometer [26, 27] was used with simultaneous measurements from 5 analyzers, and a resolution of (see e.g. Ref. [28] for general details, and Ref. [16] for the setup specific to the present experiment). We note that IXS spectra do not have contributions from incoherent scattering or multiple scattering to their dynamical structure factor. For X-rays incoherent Compton scattering occurs above 1 eV energy transfer due to the small electron mass, while multiple scattering is strongly diminished by the high photoelectric absorption cross section of cuprates. The multiphonon part is then typically the only intrinsic background in IXS for meV energy transfers, and can be easily singled out [29]. On INS experiments we occasionally observe additional contributions in the measured energy range, mostly from higher monochromator harmonics. These can be calculated and thus easily eliminated. A standard lattice dynamical calculation using a shell model code [30] was performed to calculate the phonon dispersion and the expected intensities from inelastic scattering as described in Ref. [16].
In the left panel of Fig. 1 we plot the IXS intensity as a function of energy for reduced wave-vectors and . We detect three phonon modes which can be identified as the longitudinal acoustic mode (labeled LA, ), the first optical mode (labeled 1LO, 20 meV) and the second optical mode (2LO, 35 meV). These are expected from shell model calculations but also from earlier measurements [31, 32]. We also observe an additional low energy mode (labelled E, ) which at this wave-vector point clearly emerges as a peak with intensity comparable to the other phonon modes. The deviation from the longitudinal condition along for the spectra is negligible according to calculation, with less than 3% transverse contribution. Indeed, the data shows no visible difference with the spectra measured in exact longitudinal condition with . We also check for contribution coming from other symmetries such as transverse modes. Though the measuring geometry used forbids the measurement of transverse phonons, the non-zero solid angle covered by the analyzer may favor such a contribution. However in our case the analyzer acceptance angle is too small to account for such a parasitic signal from transverse phonons. In Fig. 1, left panel, we show the calculated IXS intensity, integrated over the whole scattering volume in reciprocal space, according to our resolution and mosaic spread, and convoluted with the experimental energy resolution, by the blue filled area 111A similar procedure has been used in Ref. [33], and described in the supplemental material, Fig. FigSI2.. The calculated intensity is concentrated under the measured phonon modes, but there are no contribution from phonon modes to the scattered intensity . The right panel of Fig. 1 shows representative IXS and INS data at for temperatures ranging from 24 to 300 K, together with the corresponding fits using a model function as described elsewhere [34, 24]. INS data are fitted to a damped harmonic oscillator convoluted with the instrumental function as calculated by a program including the spectrometer characteristics [35]. For all temperatures, we detect the phonon modes and the additional low energy excitation labelled ”E” in Fig 1, left panel. A second mode, seen by Raman [17] at lower energies, is also observed in the INS data, but only in a limited range of the Brillouin Zone, from , where it intercepts the acoustic phonon mode dispersion, at approximately 5 meV, to , where it seems to merge with the higher mode ”E” at about 10 meV.

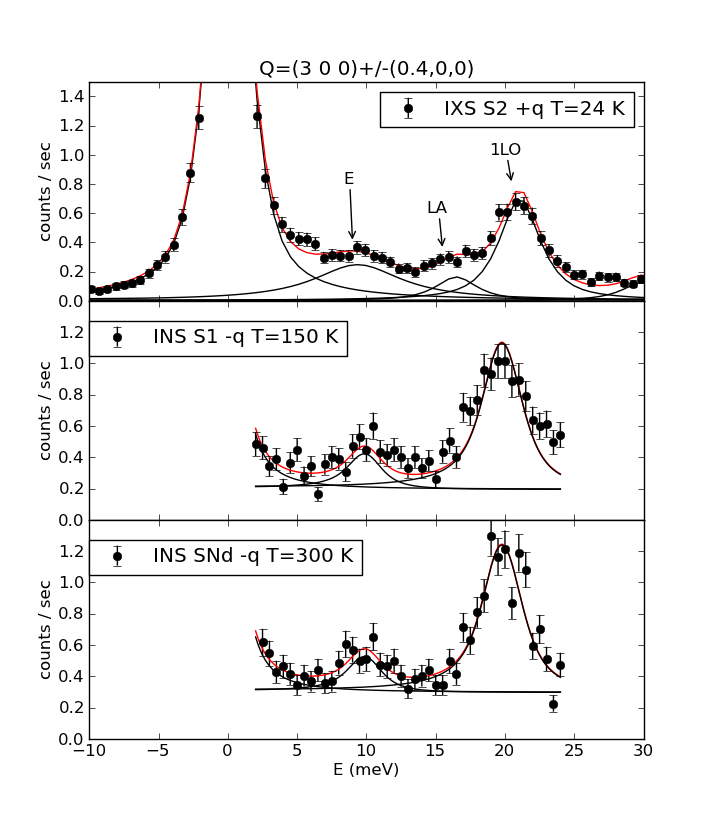

Both for IXS and INS we do not have low energy data close to the Bragg reflection. However, we have zone centre data around forbidden reflections . We represent our data in an extended Brillouin Zone, where point with reduced wav-vector for are unfolded up to these forbidden reflections, as usually done for I4/mmm-like symmetries [36]. But these points in fact can be folded back to the Zone Centre, and have been measured in the INS experiment, as shown in Fig. 2, and can be directly compared to the optical results. In that figure we show indeed how the energy found in the Raman results of Ref. [18] directly compare to our INS data, giving strong evidence that we are actually measuring the same feature. Unfortunately, such measurements are not possible with IXS, because of the presence of a strong parasitic elastic scattering, while the INS measurements are limited to E meV, due to geometrical constraint at large exchanged wave-vector, so that we can access only the excitation E, identified as an amplitudon mode in e.g. Ref. [18, 22], while the feature at low energy can not be measured at the zone centre.
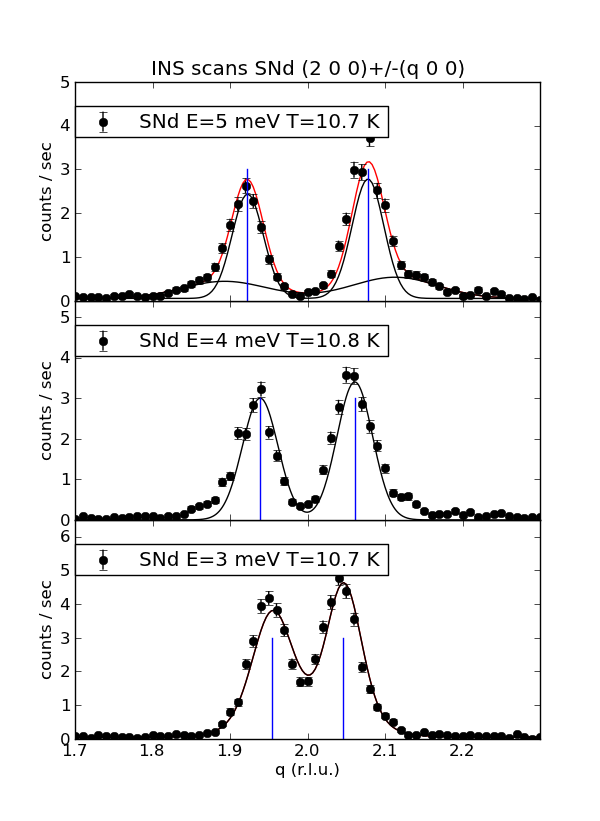
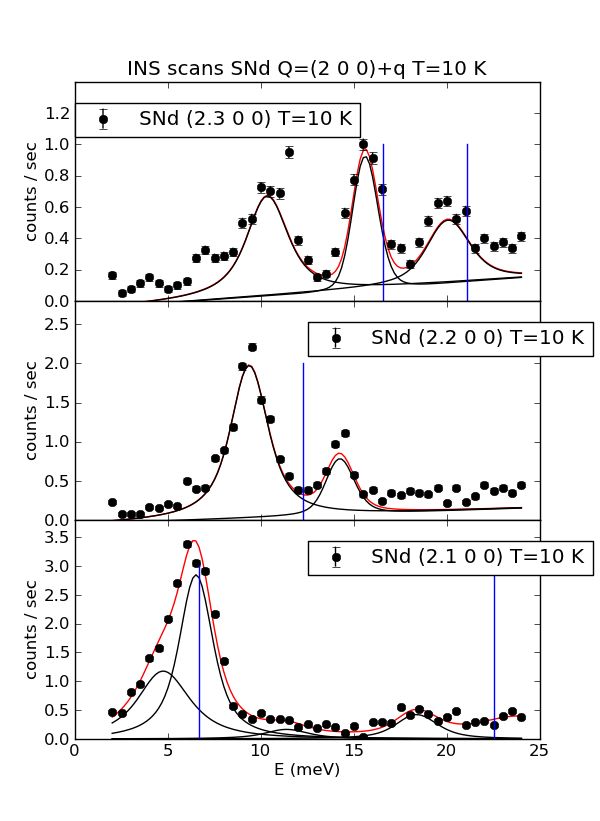
In Fig. 3 we compare INS intensities for several fixed-energy -scans (close to the Brillouin Zone Centre) and fixed- energy scans on the same sample at low temperature (10 K) with phonon modes expected from calculations. For energy losses below 5meV in the -scans of the left panel only the acoustic phonon is seen. The energy scans of the right panel clearly show a strong anomalous mode at .
In Fig. 4 we show the experimental and calculated dispersion of phonons in the extended zone in the usual representation for these systems [36]. The experimental dispersion is obtained from that of the fitted peaks in the experimental energy loss spectra as shown in Fig. 1 and 3. Phonon energies and their dispersion correspond well to the calculation in the second half of the extended Brillouin zone, from (/a, 0 0) to (2/a, 0 0) while the extra mode already shown in Fig. 1 and 3 now shows up as a flat, optical-like band. In the first half of the Brillouin zone this mode interacts strongly with the acoustic phonon opening a gap as in an avoided crossing (or anti-crossing) (see middle figure of the right panel of Fig. 3). A lower energy dispersive component also appears which increases in energy with , finally merging into the higher energy anomalous mode at .
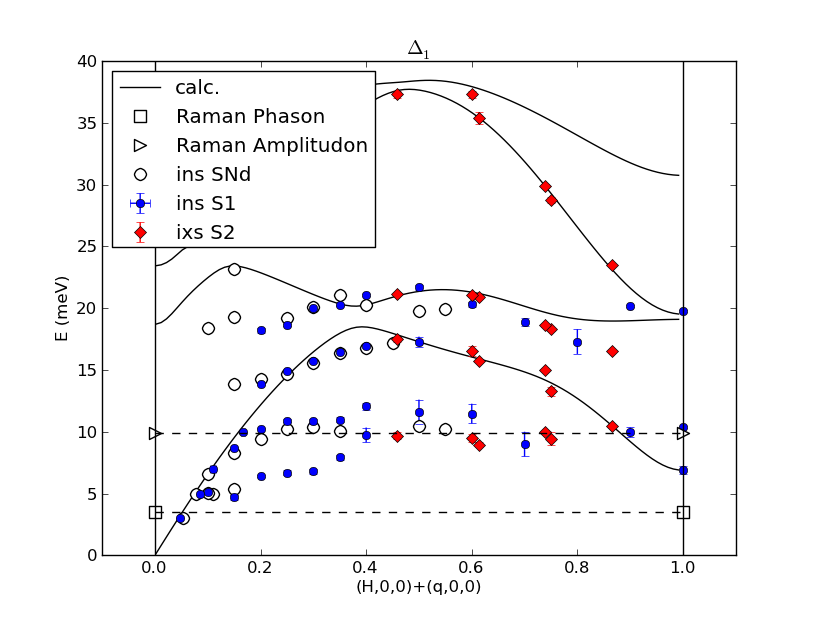
The INS measurements confirm the observations made using IXS and we clearly detect the additional mode at approximately 9-10 meV. Moreover we observe its interaction with the acoustical phonon as well as another anomalous dispersive mode at lower energy. The IXS and INS frequencies superpose well in the reduced q-range where we have access to both. This additional mode is consistently seen with different experimental set-ups and techniques, over different Brillouin zones, and on samples with different mosaic. This has several important implications:
-
a)
Any possible instrumental artefact is excluded;
-
b)
The anomalous modes are linked to the periodicity of the crystal since measurements were made in different Brillouin zones;
-
c)
The mode ”E” implies a displacement of the centre of the mass of the atoms, as it is seen both in the INS and IXS channel. In any case, a pure charge (in principle visible only by IXS) or spin (visible only by INS) excitation is excluded.
In fact, if this peak was of purely electronic origin we would not have been able to detect it with INS, and even for IXS the corresponding cross section would be several orders of magnitude smaller than that of the low energy phonon modes.
We also confirm that the additional modes appear only along (1 0 0), but not along the diagonal (1 1 0) nor in transverse configuration, where the data match previously reported experiments. In addition, we observe a clear anti-crossing with the acoustic longitudinal mode of character, indicating that the LA and the ”E” mode possess the same symmetry.
From a phenomenological point of view, parallels can be drawn between the symmetry breaking associated with stripe formation and that coming from the formation of charge density waves. This point has been recently studied by optical, time-resolved experiment [22] in the same system, as well as in a very similar experiment in YBCO [25]. In the latter case, however, a true static lattice deformation accompanies the electronic transition and has a drastic effect on the phonon spectrum: softening of phonon branches to the point where the static lattice symmetry is altered. This softening and the new symmetry generate two new modes: the acoustic like phason with a very rapid dispersion given by the softening, and the optical like amplitudon [37]. In our case we do not observe similar softening, associated to a possible ”phason” mode, even when we add Nd, that is supposed to pin the ”stripe” order. On the one hand the effects may be subtle since fluctuating stripes would not bring about a change in the static lattice symmetry. On the other at a Sr-doping quite far from 1/8, the pinning effect could be weak.
Our measurements point to a local symmetry breaking on the time-scale corresponding to THz frequencies, resulting from the coupling of the lattice with spatial charge modulations, possibly with dynamical and short range character. They correspond favorably with the Brillouin Zone Centre measurements by Raman and infrared experiments for a similar doping, where they are identified as due to stripes. An important open question has been the possible link between this phase and the lattice. We show here that the low energy lattice dynamics bears an observable fingerprint of this phase. Further studies close to the x 1/8 doping where the Nd substitution pins the charge-modulations as well as in the tetragonal phase far from structural transition will allow us to disentangle possible lattice effects from purely electronic ones.
Acknowledgements.
We thank Genda Gu for providing us the crystal (S1). We are very grateful to R. Hackl, S. Lupi and E. Cappelluti for useful discussion and D. Gambetti for technical help. This work was supported by ESRF through experiment HS-2440 and HS-2689 and by the U.S. Department of Energy under Contract No. DE-AC03-76SF00098, and LLB through experiment N. 11234. The IXS and INS work was partially supported by Berkeley Labs programs on ”Quantum Materials” funded by the US Department of Energy, Office of Science, Office of Basic Energy Sciences, Material. We acknowledge the support of the National Science Foundation through Grant No. DMR-0349361 and DMR-0405682, as well as the support from University of California, Berkeley, through France Berkeley Fund Grant.References
- [1] \NameBianconi A., Missori M., Oyanagi H., Yamaguchi H., Ha D., Nishiara Y. Longa S. D. \REVIEWEurophys. Lett.311995411.
- [2] \NameTranquada J. M., Sternlieb B. J., Axe J. D., Nakamura Y. Uchida S. \REVIEWNature3751995561.
- [3] \NameOrenstein J. Millis A. J. \REVIEWScience2882000468.
- [4] \NameKivelson S. A., Bindloss I. P., Fradkin E., Oganesyan V., Tranquada J. M., Kapitulnik A. Howald C. \REVIEWRev. Mod. Phys.7520031201.
- [5] \NameBonn D. A. \REVIEWNature Physics22006159.
- [6] \NameAbbamonte P., Rusydi A., Smadici S., Gu G., Sawatzky G. Feng D. \REVIEWNature Physics12005155.
-
[7]
\NameGhiringhelli G., Tacon M. L., Minola M., Blanco-Canosa S., Mazzoli C.,
Brookes N. B., Luca G. M. D., Frano A., Hawthorn D. G., He F., Loew T., Sala
M. M., Peets D. C., Salluzzo M., Schierle E., Sutarto R., Sawatzky G. A.,
Weschke E., Keimer B. Braicovich L. \REVIEWScience3372012pp.
821.
http://www.jstor.org/stable/23268373 - [8] \NameChen C. H., Cheong S.-W. Cooper A. S. \REVIEWPhysical Review Letters7119932461.
- [9] \NameCheong S.-W., Hwang H. Y., Chen C. H., Batlogg B., Rupp L. W. Carter S. A. \REVIEWPhys. Rev. B4919947088.
- [10] \NameYoshizawa H., Kakeshita T., Kajimoto R., Tanabe T., Katsufuji T. Tokura Y. \REVIEWPhys. Rev. B612000R854.
- [11] \NameAndo Y., Lavrov A. N. Segawa K. \REVIEWPhys. Rev. Lett.8319992813.
- [12] \NameSun X. F., Segawa K. Ando Y. \REVIEWPhysical Review Letters932004107001.
- [13] \NameNiedermayer C., Bernhard C., Blasius T., Golnik A., Moodenbaugh A. Budnick J. I. \REVIEWPhys. Rev. Lett.8019983843.
- [14] \NameBianconi A., Saini N. L., Lanzara A., Missori M., Rossetti T., Oyanagi H., Yamaguchi H., Oka K. Ito T. \REVIEWPhys. Rev. Lett.7619963412.
-
[15]
\NameWise W. D., Boyer M. C., Chatterjee K., Kondo T., Takeuchi T., Ikuta H.,
Wang Y. Hudson E. W. \REVIEWNat Phys42008696.
http://dx.doi.org/10.1038/nphys1021 - [16] \Named’Astuto M., Dhalenne G., Graf J., Hoesch M., Giura P., Krisch M., Berthet P., Lanzara A. Shukla A. \REVIEWPhys. Rev. B782008140511(R).
- [17] \NameTassini L., Venturini F., Zhang Q.-M., Hackl R., Kikugawa N. Fujita T. \REVIEWPhys. Rev. Lett.952005117002.
- [18] \NameSugai S., Takayanagi Y. Hayamizu N. \REVIEWPhys. Rev. Lett.962006137003.
- [19] \NameCaprara S., Castro C. D., Grilli M. Suppa D. \REVIEWPhys. Rev. Lett.952005117004.
- [20] \NameLucarelli A., Lupi S., Ortolani M., Calvani P., Maselli P., Capizzi M., Giura P., Eisaki H., Kikugawa N., Fujita T., Fujita M. Yamada K. \REVIEWPhys. Rev. Lett.902003037002.
- [21] \NameVenturini F., Zhang Q. M., Hackl R., Lucarelli A., Lupi S., Ortolani M., Calvani P., Kikugawa N., Fujita T., Fujita M. Yamada K. \REVIEWPhys. Rev. B662002060502(R).
-
[22]
\NameTorchinsky D. H., Mahmood F., Bollinger A. T., Božović I. Gedik N. \REVIEWNat Mater122013387.
http://dx.doi.org/10.1038/nmat3571 - [23] \NameBonnoit C. J., Gardner D. R., Chisnell R., Said A. H., Okada Y., Kondo T., Takeuchi T., Ikuta H., Moncton D. E. Lee Y. S. \BookProbing electronic order via coupling to low energy phonons in superconducting bi2sr2-xlaxcuo6+d arXiv:1202.4994 (2012).
-
[24]
\Named’Astuto M., Yamada I., Giura P., Paulatto L., Gauzzi A., Hoesch M.,
Krisch M., Azuma M. Takano M. \REVIEWPhys. Rev. B882013014522.
http://link.aps.org/doi/10.1103/PhysRevB.88.014522 - [25] \NameTacon M. L., Bosak A., Souliou S. M., Dellea G., Loew T., Heid R., Bohnen K.-P., Ghiringhelli G., Krisch M. Keimer B. \REVIEWNature Physics10201452.
- [26] \NameMasciovecchio C., Bergmann U., Krisch M., Ruocco G., Sette F. Verbeni R. \REVIEWNucl. Instrum. Meth. B1111996181.
- [27] \NameVerbeni R., Sette F., Krisch M., Bergmann U., Gorges B., Halcoussis C., Martel K., Masciovecchio C., Ribois J., Ruocco G. Sinn H. \REVIEWJ. Synchrotron Radiation3199662.
- [28] \Named’Astuto M., Calandra M., Reich S., Shukla A., Lazzeri M., Mauri F., Karpinski J., Zhigadlo N. D., Bossak A. Krisch M. \REVIEWPhysical Review B (Condensed Matter and Materials Physics)752007174508.
- [29] \NameBaron A. Q. R., Uchiyama H., Heid R., Bohnen K. P., Tanaka Y., Tsutsui S., Ishikawa D., Lee S. Tajima S. \REVIEWPhys. Rev. B752007020505(R).
- [30] \NameMirone A. \BookOpenPhonon code source available on http://www.esrf.fr/computing/scientific/ (2001).
- [31] \NamePintschovius L. Reichardt W. \BookNeutron scattering in layered copper-oxide superconductors in \BookPhysics and Chemistry of Materials with Low-Dimensional Structures, edited by \NameFurrer A. Vol. 20 (Kluwer Academic Publishers, Dordrecht) 1998 p. 165.
- [32] \NameFukuda T., Mizuki J., Ikeuchi K., Yamada K., Baron A. Q. R. Tsutsui S. \REVIEWPhysical Review B (Condensed Matter and Materials Physics)712005060501.
-
[33]
\NamePailhès S., Euchner H., Giordano, V. M., Debord R., Assy A., Gomès
S., Bosak A., Machon D., Paschen S. de Boissieu M. \REVIEWPhys. Rev.
Lett.1132014025506.
http://link.aps.org/doi/10.1103/PhysRevLett.113.025506 - [34] \NameGraf J., d’Astuto M., Giura P., Shukla A., Saini N. L., Bossak A., Krisch M., Cheong S.-W., Sasagawa T. Lanzara A. \REVIEWPhys. Rev. B762007172507.
- [35] \NameHennion B. Bourges P. \BookAfitv: Refinement program for triple axis spectrometer data.
- [36] \NameReznik D. \REVIEWAdvances in Condensed Matter Physics20102010523549.
- [37] \NameRavy S., Requardt H., LeBolloc’h D., Foury-Leylekian P., Pouget J.-P., Currat R., Monceau P. Krisch M. \REVIEWPhys. Rev. B692004115113.