]Corresponding author.
Dielectric relaxation of thin films of polyamide random copolymers
Abstract
We investigate the relaxation behavior of thin films of a polyamide random copolymer, PA66/6I, with various film thicknesses using dielectric relaxation spectroscopy. Two dielectric signals are observed at high temperatures, the -process and the relaxation process due to electrode polarization (the EP-process). The relaxation time of the EP-process has a Vogel-Fulcher-Tammann type of temperature dependence, and the glass transition temperature, , evaluated from the EP-process agrees very well with the determined from the thermal measurements. The fragility index derived from the EP-process increases with decreasing film thickness. The relaxation time and the dielectric relaxation strength of the EP-process are described by a linear function of the film thickness for large values of , which can be regarded as experimental evidence for the validity of attributing the observed signal to the EP-process. Furthermore, there is distinct deviation from this linear law for thicknesses smaller than a critical value. This deviation observed in thinner films is associated with an increase in the mobility and/or diffusion constant of the charge carriers responsible for the EP-process. The -process is located in a high frequency region than the EP-process at high temperatures, but merges with the EP-process at lower temperatures near the glass transition region. The thickness dependence of the relaxation time of the -process is different from that of the EP-process. This suggests that there is decoupling between the segmental motion of the polymers and the translational motion of the charge carriers in confinement.
pacs:
71.55.Jv; 81.05.Lg; 77.22.ChI Introduction
Amorphous materials exhibit glass transition behavior when cooled from a high temperature to a low temperature under appropriate cooling conditions glass1 . At the glass transition temperature, , the motion of the -process is almost frozen, such that the characteristic time of the motion extends to a macroscopic time scale. For polymeric systems, the physical origin of the -process is attributed to the segmental motion of the polymer chains. The freezing of the -process can usually be explained by an anomalous increase in the scale of the characteristic length of the dynamics when approaching the glass transition temperature Adam-Gibbs1965 . Dynamical heterogeneity is strongly correlated with this increase in the scale of the characteristic length, and can be regarded as the most important concept in elucidating the mechanism of the glass transition Berthier2010 . Glass transitions in confined geometry, such as thin polymer films and small molecules in nanopores, have been widely investigated to determine the scale of the characteristic length in the glass transition dynamics MaKenna2005 . Recent measurements show that for thin polymer films there is a large deviation in and related dynamics from the bulk, albeit with some exceptions Tress2010 ; Efremov2012 .
Being related to the heterogeneous dynamics near the glass transition temperature, the correlation between two different modes of molecular motion has been investigated Chang1994 ; Ediger2000 . For example, decoupling between the translational and rotational motions is usually observed in supercooled liquid states near . Similar decoupling of the translational and rotational motions has also been observed in confinement on the nanoscale Napolitano2014 .
The dependence of the glass transition on the film thickness has been investigated mainly for non-polar polymers, such as polystyrene, poly(methyl methacrylate), and so on Fukao2000 ; Napolitano2013 . In contrast, the glass transition dynamics of thin films of polar polymeric systems have not yet been investigated intensively, although there have been some reports on the dependence of glassy dynamics on the film thickness for thin films of strong polar polymers such as polysulfone Labahn2009 and poly(bisphenol A carbonate) Yin2012 . Polyamides are one of these strong polar polymers McCrum1967 . Because of their industrial importance, many experimental investigations, including dielectric measurements, have been carried out on polyamides over the last fifty years Baker1942 ; Boyd1959 ; Laredo1997 ; Neagau2000 ; Lu2006 ; Laurati2012 . The dielectric spectra of the polyamide family exhibit many processes, including -, -, and -processes related to the molecular motion of polymer chains during heating from a low temperature to a high temperature of up to 140∘C. These processes are generally attributed to local motions of the methylene groups (-process), rotations of the amide groups (-process), or segmental motions (-process) McCrum1967 . In addition to these three processes, other large dielectric signals are observed in high-temperature and low-frequency regions, and should be related to the motion of the charge carriers within the samples. The DC conductivity process, the process related to the Maxwell-Wagner-Sillar (MWS) interfacial polarization, and the electrode polarization process (EP-process) are usually observed BDS-book2003 . For polyamides, the charge carrier related to the three processes is mainly charged hydrogen, , protons, which come from the amide linkage formed via hydrogen bonding between the carbonyl group and the amino group Baker1942 . For amorphous polymers, there is no interface between the crystalline and amorphous phases. Hence, MWS polarization process is not expected to be a major process in the low-frequency and high-temperature region for amorphous polymers. In this case, the EP-process might be more important than MWS polarization process. The molecular origin of the electrode polarization is the partial blocking of charge carriers at the sample-electrode interface. This leads to a separation of the positive and negative charges, giving rise to additional polarization, as will be further explained in Sec. III.
Recent dielectric measurements of Nylon 1010 Lu2006 show that the dependence of the relaxation time of the EP-process on temperature can be described by the Vogel-Fulcher-Tammann (VFT) law. This suggests the possibility of monitoring the glassy dynamics through investigation of the EP-process. Hence, thin films of polyamide systems are expected to be suitable for the simultaneous investigation of glassy dynamics and the motion of charge carriers, as well as the correlation between the two processes. Because the translational motion of charge carriers can be determined from the EP-process, polyamides can be regarded as suitable systems for investigating the correlation between the segmental motion of polyamide chains and the diffusion motion of charge carriers in the polyamide matrix.
In this study, we investigate the dielectric behavior of thin films of an aromatic polyamide random copolymer with various film thicknesses. Dielectric relaxation spectroscopy is used to elucidate the dependence of the -process and the EP-process on the film thickness, which could lead to a better understanding of the relationship between the segmental motion and the motion of charge carriers in confinement. Following this introduction, the experimental details are given in Sec. II, and the theoretical background, especially on the EP-process, is given in Sec. III. In Sec. IV, the experimental results from dielectric relaxation spectroscopy are given, along with an analysis in terms of the model developed by Coelho. Finally, a brief summary is given in Sec. VI.
II experiments
II.1 Samples
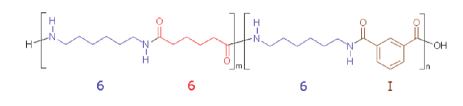
The aromatic polyamide random copolymer PA66/6I was supplied by Solvay Laurati2012 . The weight-averaged molecular weight of the copolymer is =1.5104, and the distribution of the molecular weight is given by =1.6. The chemical formula is schematically shown in Fig. 1. The glass transition temperature, , of the original material was measured using differential scanning calorimetry (DSC), and was found to be 357 K under heating at a rate of 10 K/min.
The following procedures were carried out to prepare thin films for dielectric measurements. The polyamide was first dissolved in 1,4-butanediol at 200∘C to obtain solutions of PA66/6I at concentrations of 2 wt.%, 1 wt.%, and 0.5 wt.% Kiho1986 . The solutions were then diluted at 160∘C with the same amount of chloroform. Thin films were subsequently prepared on an aluminum deposited glass substrate from the diluted solution using spin-coating. Following that, aluminum was again vacuum-deposited to serve as an upper electrode. The sample was then annealed at 160∘C for 12 hours before the dielectric measurements. The thickness of the film was controlled through the solution concentration and the speed of rotation during spin coating. The absolute film thickness was determined using atomic force microscopy measurements.
II.2 X-ray scattering measurements
X-ray scattering measurements were performed at SPring-8 BL40B2. A simultaneous measurement system utilizing small-angle X-ray scattering (SAXS) and wide-angel X-ray scattering (WAXS) was used. The measurement conditions were as follows: the camera lengths were 1757.4 mm and 90.0 mm for SAXS and WAXS, respectively; the X-ray wavelength was 0.9 ; the detector system was a CCD camera with an image intensifier for SAXS, while that for WAXS was a flatpanel.
II.3 Dielectric relaxation spectroscopy
Dielectric relaxation spectroscopy (DRS) measurements were made using an LCR meter (Agilent Technology, E4980A, 4292A) and Novocontrol AKB analyzer. The measured frequency range was from 0.01 Hz to 2 MHz and the temperature range was from 93 K to 423 K. The complex electric capacitance was obtained with the DRS measurements, where and is the frequency of the applied electric field. Because of the electric resistance of the electrode formed by the vacuum deposition of aluminum, there is an additional contribution to the electric capacitance in the high-frequency region Blum1995 . This contribution can be corrected using the assumption that the sample condenser can be described as a serial circuit of the condenser and Fukao2000 . Here, the following relation holds:
| (1) |
The complex electric capacitance thus obtained is described by , where is the geometrical capacitance and is the complex dielectric permittivity of the sample. Here, , where is the dielectric permittivity in vacuo, is the area of the sample or electrode, and is the thickness of the sample or the distance between the two electrodes. In the present measurements, =810-6m2. The complex dielectric permittivity is given by:
| (2) |
where and are the real and imaginary parts of the complex dielectric permittivity, respectively. The voltage applied to the samples for dielectric measurements was selected as follows: 1.0 V for =556 nm, 0.5 V for =114 nm, 99 nm, 56 nm, 40 nm, and 0.2 V for =20 nm. Hence, the applied electric field ranges from 2 MV/m to 12 MV/m for the present measurements.
III Theoretical models of the electrode polarization process
There are several theoretical models of the EP-process Macdonald1953 ; Coelho1983 ; Klein2006 . According to these theoretical models, the relaxation time of the electrode polarization, , and the relaxation strength of the electrode polarization, , can be described by a linear function of the distance between the two electrodes, positive and negative, which corresponds to the thickness of the thin film, .
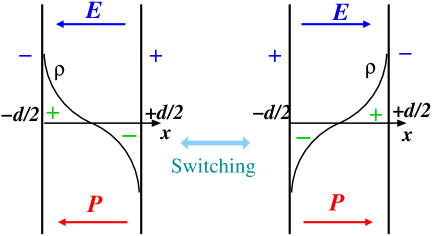
If there are mobile charge carriers in a sample, then the spatial distribution of the charges changes depending on changes in the applied electric field. In the framework of the Debye theory, the dipolar relaxation can be described as a process associated with viscous forces originating from the matrix, where the charge carriers move randomly with thermal fluctuations. In the absence of an applied electric field, the charge carriers are uniformly distributed in the sample, and the sample is thus almost electrically neutral. In the presence of a DC electric field, however, the charge carriers are separated depending on their polarity, and a heterogeneous charge distribution appears within the sample. If the direction of the applied electric field is reversed, then the charge carriers move in such a way that a new heterogeneous charge distribution is reached, as shown in Fig. 2. For an AC electric field, the dynamics of the charge carriers have been modeled by Coelho Coelho1983 , and the complex dielectric permittivity has been derived for applied electric fields with angular frequency as follows:
| (3) |
where
| (4) | |||||
| (5) |
Here, is the relaxation time characterizing the relaxation phenomena of the charge distribution or the electrode polarization upon changes in the external applied electric field, is the diffusion constant of the charge carriers, and is the Debye length, , the scale of the characteristic length of the electrostatic double layer near the electrodes. In addition, the following relations among , , , and are obtained:
| (6) | |||||
| (7) |
where is the dc-conductivity, is the equilibrium concentration of charge carriers, is the elementary electric charge, is the mobility of the charge carrier, and is the dielectric permittivity at very high frequency. Applying the Einstein relation leads to the following relation between and :
| (8) |
where is the Boltzmann constant, and is the absolute temperature Einstein1905 . This equation is an expression of the fluctuation-dissipation theorem Kubo1991 . Hence, the Debye length can be expressed as:
| (9) |
If 0 and , then the complex dielectric permittivity can be described by:
| (10) |
In real polymeric materials, there is a distribution of the relaxation times because of the heterogeneity of the materials. The dielectric permittivity due to the EP-process can be expressed as:
| (11) | |||||
| (12) |
where
| (13) | |||||
| (14) |
Using Eqns. (9), (13), and (14), we can obtain the following equations for the mobility and the equilibrium concentration of charge carriers :
| (15) | |||||
| (16) |
which relate and to the experimentally observed values of and . Here, is the relaxation time of the EP-process. Furthermore, the diffusion constant of the charge carriers, , can be determined using Eqs. (8), (13), and (14) from the values of and as follows:
| (17) |
IV Results and Discussion
IV.1 X-ray scattering measurements
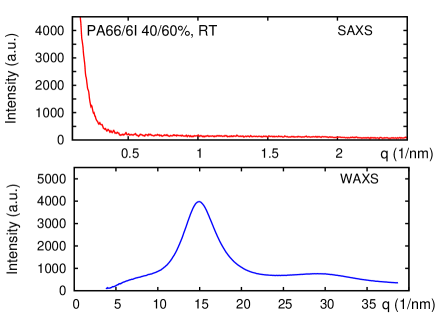
Figure 3 shows the dependence of the X-ray scattering intensity on the scattering vector at room temperature for the amorphous polyamide copolymer PA66/6I. The scattering profiles for both the SAXS and WAXS regions are shown in Fig. 3. In the WAXS region, for nm-1, there is a broad peak that is usually called an amorphous halo. This peak originates from the short-range order of the structure. The amorphous halo is one typical scattering pattern for amorphous materials. In the SAXS region, there is no peak, only a continuous decay from . Hence, we can infer that there is neither a higher-ordered structure, such as a lamellar structure, nor a crystalline structure in PA66/6I.
IV.2 Dielectric spectra in the temperature domain
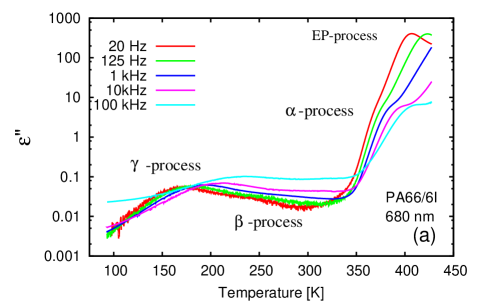
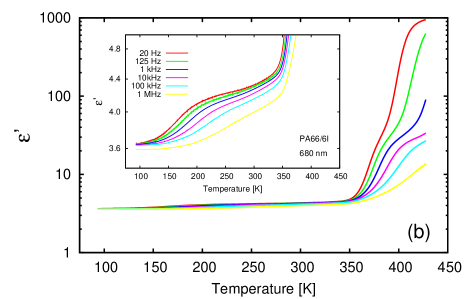
Figure 4 shows the dependence of the complex dielectric permittivity on the temperature, measured at various frequencies for the amorphous polyamide copolymer PA66/6I at a 680-nm thickness. In Fig. 4 (a), there are several contributions to the dielectric permittivity depending on the temperature and frequency. There is a dielectric loss peak due to the -process located at around 170 K for 20 Hz, and there is also a broad contribution due to the -process between 220 K and 280 K. In the low-frequency and high-temperature region, there is a very large contribution, which should be related to the motion of charge carriers. Here, this behavior can be attributed to the EP-process and/or conductivity, as there should not be a crystal-amorphous interface in this amorphous polyamide copolymer. A detailed discussion on attributing this to the EP-process is given in Sec. IV.4. In addition to the three contributions, there is the -process as a shoulder of the large peak of the EP-process. In Fig. 4(b), we can also see that there are signals in the real part of the dielectric permittivity, which correspond to the four different dynamical contributions. It should be noted that the observed data in Fig. 4 were obtained after heating above 100∘C. In other words, the results in Fig. 4 should correspond to those for the dry state Laredo1997 ; Laurati2012 . In this paper, we will concentrate on the -process and the EP-process.
IV.3 Dielectric spectra in the frequency domain
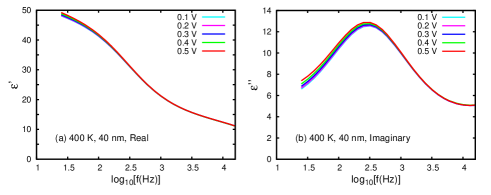
For strong polar materials, the EP-process may show a strong nonlinear effect against the applied electric field. Figure 5 shows the real and imaginary parts of dielectric permittivity in the frequnecy domain for various applied voltages from 0.1 V to 0.5 V in thin films of PA66/6I with a 40-nm thickness. In Fig. 5, the value of ranges from 2.5 MV/m to 12.5 MV/m, in which the selected range of in the present measurements is almost included. The curves observed for various applied voltages are overlapped with each other, as shown in Fig. 5. From these measurements, we can estimate possible maximum deviation due to the change in electric field as follows: for the peak frequency of the EP-process at a given temperature, possible deviation is less than 0.02, and for the peak value of of the EP-process, deivation is less than 3 %. Therefore, the observed change in peak position and height of the EP-process with change in the film thickness is much larger than these possible deviations. Therefore, it can be justified that experimental results in this paper do not depend on the value of for the range of selected in the present measurements.
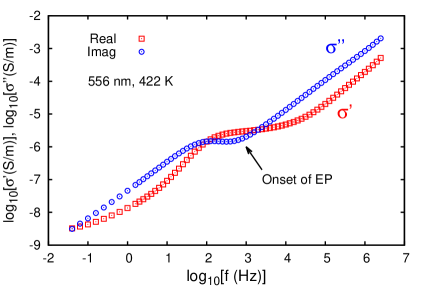
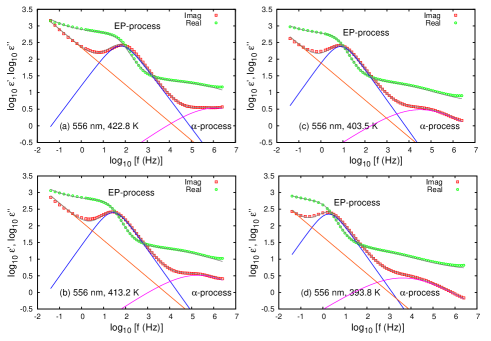
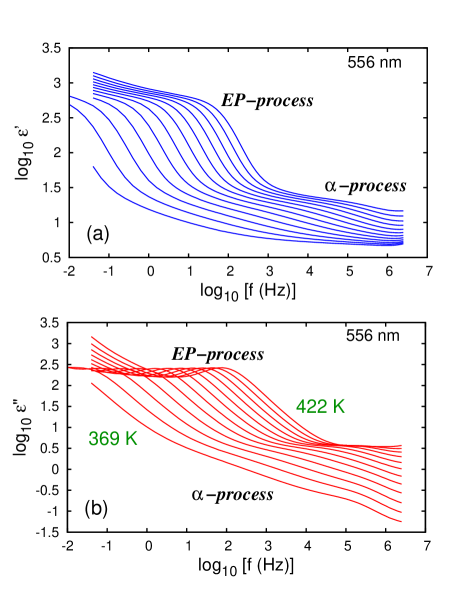
Figure 6 shows the dependence of the complex dielectric permittivity on the frequency for thin films of the amorphous polyamide copolymer PA66/6I with a 556-nm thickness. In Fig. 6, different processes including the -process and the EP-process contribute to the dielectric permittivity. These components are readily observed over the temperature range from 369 K to 422 K. Furthermore, we also show the dependence of the complex conductivity on the frequency for the thin films. Here, and are the real and imaginary parts of the complex conductivity, respectively, and the values of and are evaluated from the following relataions: and . Figure 7 shows the dependence of the logarithm of the real and imaginary parts of the complex conductivity observed at 422 K for thin films of PA66/6I with a 556-nm thickness. The value of approaches a constant value (plateau value) at ca. 104Hz with decreasing frequency, although there is no exact plateau but with a small slope because of the overlap of the -process. On the other hand, the value of shows the signal of the onset of EP-process at 103 Hz. According to the usual interpretation on the EP-process in the conductivity representation proposed by Kremer and coworkers Serghei2009 ; Sangoro2012 ; Sangoro2014 , it is reasonable to regard the “plateau” of at 104Hz as the onset of dc-conductivity, which should be required for the appearance of the EP-process. If this interpretation is valid, the physical origin of the increase in and in the low frequency region should not be due to usual conductivity. Wang et al. reported that there is an increase in and in the lower frequency region than the location of the EP-process Wang2013 . Furthermore, they attributed this contribution to imperfectness of the blocking at electrodes of the charge carriers which are responsible for the EP-process. This effect causes a deviation from the expected values from the theoretical model of the EP-process. Here, we adopt this interpretation for the increase in and with decreasing frequency in low-frequnecy region. In this case, the contributions in the low-frequency region in and are not directly related to the usual dc-conductivity.
The frequencies at which the dielectric loss peaks due to the EP- and -processes are located are shifted from the lower frequency region to the higher frequency region with increasing temperature, as shown in Fig 6. In order to investigate the dielectric properties of the components separately, the observed dependence of and on the frequency was reproduced by the following model function:
| (18) |
where is the complex dielectric permittivity due to the EP-process described by Eq. (12), is the dielectric permittivity due to the -process, and is the dielectric permittivity due to the imperfectness of the blocking at electrodes of the charge carriers. For the component of , we use simple power-law functions for both real and imaginary parts of :
| (19) |
where , , , and are constants. These functions work well, as shown in Fig. 8. As for the -process, we adopt the Havriliak-Negami equation HN1967 :
| (20) |
where is the dielectric relaxation strength, and are shape parameters, and is the relaxation time of the -process. In the present analysis, the parameter is fixed at unity because of a reduction in the free fitting parameters.
Figure 8 shows the dependence of and on the frequency at four different temperatures, 422.8 K, 413.2 K, 403.5 K, and 393.8 K, for a 556-nm-thick thin film of the amorphous polyamide copolymer PA66/6I. Calculated curves for the different components are also shown, and were obtained by fitting the observed data to the model function, Eq. (18). From Fig. 8, we can see that the observed dielectric permittivity is very well reproduced by the present model function and, as a result, several important physical quantities can be evaluated as a function of the temperature and film thickness.
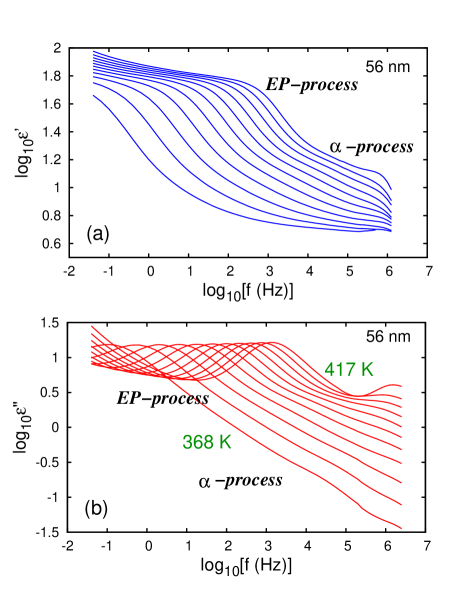
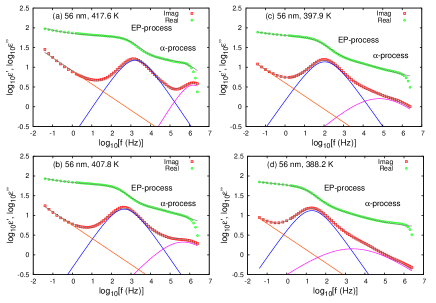
Figure 9 shows the dependence of the complex dielectric permittivity on the frequency for a 56-nm-thick thin film of the amorphous polyamide copolymer PA66/6I. In Fig. 9, we can see that the peak height of the EP-process in the curve of vs. is much smaller for the 56-nm-thick film than for the 556-nm-thick film. Furthermore, the peak positions of the EP-process in the frequency domain at a given temperature are clearly shifted to the higher frequency region for the 56-nm-thick thin film, as compared to the 556-nm-thick film. In addition, for the 56-nm-thick film, the present model function again accurately reproduces the observed dielectric permittivity as a function of frequency for various temperatures, as shown in Fig. 10.
IV.4 The electrode polarization process
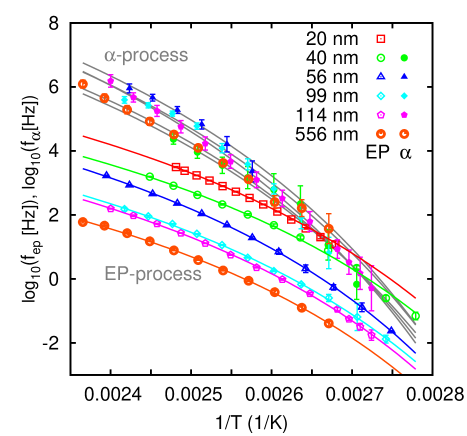
Figure 11 shows the dependence of the relaxation rate of the EP-process, , on the temperature, for thin films of the amorphous polyamide copolymer PA66/6I of various thicknesses, ranging from 20 nm to 556 nm. The value of is evaluated from the relation with the best-fitted values of obtained using Eq. (12). Here, the parameter is fixed to 1, such that the resulting frequency is equal to the frequency at which exhibits a peak. In Fig. 11, we can see that the relaxation rate of the EP-process has a stronger temperature dependence than the Arrhenius type of temperature dependence. As shown by the curves in Fig. 11, the temperature dependence of is well reproduced by the VFT law Vogel1921 ; Fulcher1925a ; Fulcher1925b ; Tammann1926 :
| (21) |
where is a positive constant, and is the Vogel temperature. At a given temperature, the relaxation rate of the EP-process increases with decreasing film thickness. In other words, the relaxation time decreases. The VFT law is usually valid for the temperature dependence of the relaxation time of the -process or the normal mode Boese1990 , and the slowing down of the dynamics when approaching the Vogel temperature is essential to glassy dynamics. Therefore, we can expect that the molecular motion of the EP-process is strongly associated with the molecular motion, the segmental motion or the normal mode, of polyamide copolymer systems. This result is consistent with the results reported in Ref. Lu2006 .
In Fig. 11, there seems to be the crossing of the temperature dependence of the rate of the EP-process and that of the -process especially for smaller values of . In the region where the two relaxation rates and come across, it is very difficult and almost impossible to seperatre the component of the -process from that of the EP-process. The extrapolated curve of the -process using the VFT-law intersects with the observed curve of the EP-process in the low-frequency region. Because the -process induces the EP-process, it is reasonable to imagine that the two curves will merge without intersection.
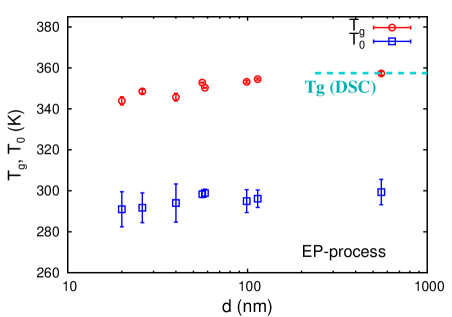
Figure 12 shows the dependence of the Vogel temperature on the film thickness, evaluated by fitting the observed temperature dependence of the relaxation rate of the EP-process to the VFT law. Here, the glass transition temperature is also evaluated, such that the relaxation time of the EP-process, , is equal to 103 sec at , and the resulting is plotted in Fig. 12. Furthermore, the glass transition temperature determined by DSC measurements is also plotted, for comparison with other results. Here, for the bulk system, the from DSC is 357 K, the evaluated from the relaxation rate of the EP-process is 357.30.8 K, and the Vogel temperature is 2996 K. The evaluated from the EP-process agrees very well with that from the DSC measurements. The difference between and is approximately 58 K, which is consistent with the empirical relation that is approximately 50 K lower than Strobl2007 . Therefore, this result suggests that the relaxation rate of the EP-process can be utilized to determine the dynamics of the segmental motion, that is, the glassy dynamics, especially near the glass transition region. In Fig. 12, we can see that both and decrease slightly with decreasing film thickness.
As shown in the above, the temperature dependence of the relaxation time of the EP-process is used to determine the glass transition temperature of the amorphous polyamide copolymer PA66/6I. Furthermore, we can use the observed temperature dependence of to determine the fragility index, which characterizes the glassy dynamics of amorphous materials. Here, we define the fragility index as follows Bohmer1992 :
| (22) |
where the relaxation time is used instead of , which should be used in the formal definition of the fragility index.
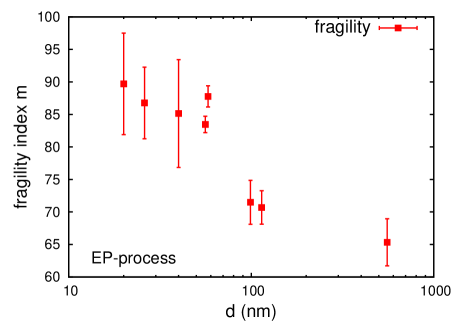
Figure 13 shows the dependence of the apparent fragility index on the film thickness, evaluated using the temperature dependence of the relaxation time of the EP-process for thin films of the amorphous polyamide copolymer PA66/6I. In Fig. 13, the fragility index increases with decreasing film thickness. Therefore, the glassy dynamics of these thin films are expected to become more fragile with decreasing film thickness, provided that this apparent fragility index can be regarded as the fragility index evaluated from the relaxation time of the -process. A more in-depth discussion on this issue is given in Sec. V.
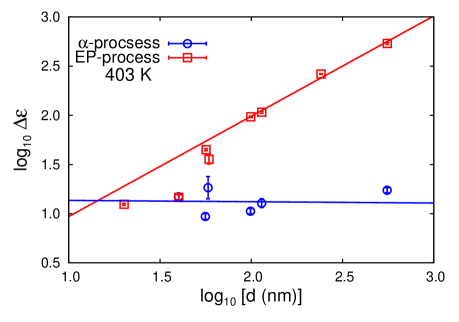
The dependence of the dielectric relaxation strength on the film thickness at 403 K for the EP-process is shown in Fig. 14, for thin films of the amorphous polyamide copolymer PA66/6I. The dielectric relaxation strength of the EP-process, , monotonically increases with increasing film thickness. Above = 100 nm, the thickness dependence of is well fitted by a straight line with a slope of unity, as shown by the red line in Fig. 14. According to the theoretical model of the electrode polarization, the dielectric relaxation strength of the EP-process can be expressed as a linear function of the thickness of the sample, i.e., the distance between the two electrodes, as shown in Eq. (13). Therefore, the linear relationship between and the film thickness can be regarded as strong evidence for the validity of attributing the EP-process to the strongest dielectric loss signal observed in the present measurements. Furthermore, it should be noted that there is a distinct deviation of the thickness dependence of from the straight line with a slope of unity. If () can be expressed as a linear function of , the Debye length and the characteristic relaxation time of the electrode polarization should be independent of the film thickness. However, if this is not the case, the values of and should depend on the film thickness. Therefore, this deviation implies that there is an intrinsic dependence on the film thickness for the physical mechanism of the EP-process, for thin films with a thickness less than a critical thickness (60 nm 100 nm ).
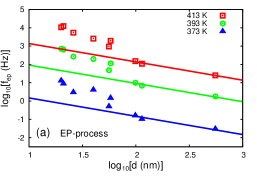
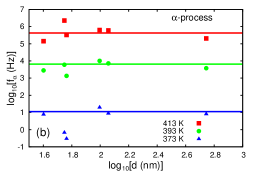
Figure 15(a) shows the dependence of the relaxation rate of the EP-process, , on the film thickness, at 413 K, 393 K, and 373 K, for thin films of the amorphous polyamide copolymer PA66/6I. For a thickness larger than , the dependence of the relaxation rate of the EP-process on the film thickness is well described by the following relation:
| (23) |
This result is consistent with Eq. (14) for the present model of the EP-process. Below , there is an intrinsic deviation from Eq. (14) in the same manner as observed for the dielectric relaxation strength of the EP-process.
IV.5 The -process
In this section, we will discuss the experimental results on the relaxation time of the -process for thin films of the amorphous polyamide copolymer PA66/6I. The dielectric relaxation strength of the -process is much smaller than that of the EP-process, as shown in Fig. 6. It is thus difficult to evaluate the physical parameters of the -process by extracting the component caused by the -process from the overall dielectric spectra. However, data fitting by Eq. (18) enables the extraction of only the component from the -process, as well as the elucidation of the temperature dependence of the relaxation rate of the -process, as shown in Fig. 11.
For thin films of PA66/6I with a given film thickness, the relaxation rate of the -process is located at a higher frequency region than that of the EP-process, at a given temperature. The deviation of the relaxation rate of the -process from that of the EP-process becomes smaller as the temperature approaches the glass transition temperature. Hence, the -process appears to merge with the EP-process with decreasing temperature. This is the reason for the difficulty in evaluating the relaxation rate of the -process. At the same time, the merging of the -process with the EP-process can be regarded as an evidence that the EP-process is strongly associated with the -process, especially at the glass transition region. In Fig. 11, the temperature dependence of the relaxation rate of the -process is well reproduced by the VFT law, under the condition that the Vogel temperature of the -process is the same as that of the EP-process for each film thickness.
As for the dependence of the -process on the film thickness, the dielectric relaxation strength and the relaxation rate of the -process are shown as functions of the film thickness at a given temperature in Fig. 14 and Fig. 15(b), respectively. Although there is some scatter in the data points, they suggest that there is almost no systematic dependence of the dielectric relaxation strength and the relaxation rate of the -process on the film thickness, for the thickness range investigated in this study. The dependence of the relaxation rate of the -process on the film thickness in comparison to that of the EP-process is discussed in Sec. V, for thin films of PA66/6I.
IV.6 Relaxation of the distribution of space charge
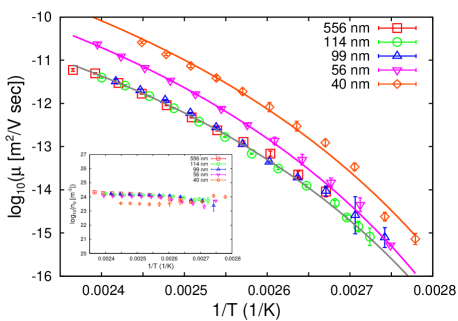
As shown in Sec. IV.4, the dielectric relaxation phenomenon of the EP-process exhibits an interesting dependence on the temperature and film thickness, for the amorphous polyamide copolymer PA66/6I. Here, we try to evaluate the intrinsic nature of the EP-process, based on the theoretical model given in Sec. III. From the observed values of and , the temperature dependence of the mobility and equilibrium concentration of charge carriers within the polymeric system can be evaluated using Eqs. (15) and (16). Figure 16 shows this dependence for thin films of PA66/6I of various thicknesses. In Fig. 16, the equilibrium concentration of charge carriers shows a weak temperature dependence (figure inset), while the mobility shows a strong temperature dependence that can be expressed by the VFT law of mobility as follows:
| (24) |
Here, and are positive constants. The Vogel temperatures obtained from are 294 K and 298 K for 40 nm and 99 nm, respectively. These values are nearly identical to those evaluated from , as shown in Fig. 12.
For the thin films with thicknesses of 556 nm, 114 nm, and 99 nm, the temperature dependences of the mobility agree well with each other, and are well reproduced by the VFT law with the same parameters. However, for the thin films with thicknesses less than , the mobility of the charge carriers at a given temperature increases with decreasing film thickness. This is consistent with the results of the relaxation rate of the EP-process in Fig. 15, that is, the crossover of from the straight line with a slope of -1 to the line with a larger slope as the film thickness decreases. Therefore, we can conclude that the intrinsic mobility of the charge carriers remains almost unchanged for a film thickness above a critical thickness , while the mobility increases with decreasing film thickness below .
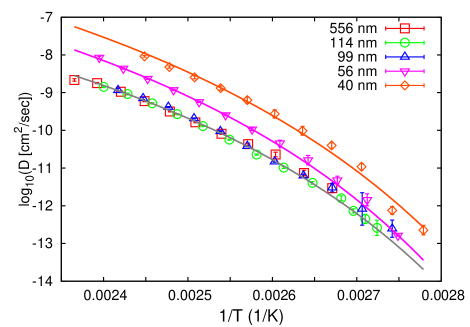
Furthermore, the diffusion constant of the charge carriers can be evaluated from the mobility (T) using Eq. (8), as shown in Fig. 17. In Fig. 17, the diffusion constant can be reproduced using the relation
| (25) |
where is a positive constant. The value of changes from 10-13 cm2/sec to 10-8cm2/sec as the temperature changes from 363 K to 410 K, for thin films of the amorphous polyamide copolymer PA66/6I with a thickness larger than . Below , an intrinsic increase in is observed, similar to that for the mobility . Therefore, the translational motion of the charge carriers is intrinsically enhanced with decreasing film thickness.
V Discussion
From the observed dielectric spectra for thin films of PA66/6I, we successfully discerned the separate contributions from the EP-process and the -process. The physical origin of the -process is due to segmental motion, which can be regarded as a rotational motion of polymeric segments, while that of the EP-process is due to the translational motion of charge carriers. Because the motion of charge carriers is activated via the molecular motion of the polyamide systems in which the charge carriers are located, the motion of charge carriers is strongly associated with the molecular motions of polymer chains.
V.1 Glassy dynamics evaluated from the EP-process
As shown in Fig. 11, the temperature dependence of is well reproduced by the VFT law. Hence, we expect that the glass transition behavior of PA66/6I can be evaluated from the EP-process. Figure 12 clearly shows that is well evaluated using . The fragility index evaluated from increases with decreasing film thickness, as shown in Fig. 13. The dependence of and the fragility index on the film thickness has been measured for the thin films and/or nanoparticles of several polymers without strong polarity Fukao2001a ; Evans2013 ; Zhang2013 . Both and the fragility index decrease with decreasing film thickness for many cases. In contrast, the present result clearly shows that as the film thickness decreases, the fragility index increases, while decreases. This inverse dependence on thickness of might be associated with the strong polarity of PA66/6I. The fragility index can be regarded as a measure of the cooperativity of the -process or segmental motion Bohmer1992 . In the case of polyamides, the formation of a network as a result of the hydrogen bonding can promote the cooperativity of the glassy dynamics, even in thin films.
V.2 Coupling or decoupling of translational and rotational motions
As shown in Fig. 15(a), the relaxation rate of the EP-process shows an intrinsic increase below a critical thickness, that is, increases with decreasing film thickness with a stronger thickness dependence than that described by the linear relationship between and . This corresponds to the enhancement in the diffusion motion of the charge carriers in the thin films with , as shown in Fig. 17. On the other hand, the relaxation rate of the -process shows almost no systematic dependence on the film thickness, for the thickness range investigated in this study, although there is scatter in the data points. This might be experimental evidence for the decoupling of the rotational motion of polymer chain segments and the translational motion of charge carriers in amorphous polyamide copolymers. More precise measurements are required in order to discuss this decoupling of the rotational motion and the translational motion in greater detail.
V.3 Origin of charge carriers
The dielectric relaxation spectra of amorphous polyamide copolymers clearly show strong signals for the EP-process. As mentioned in Sec. I, there are several possible candidates for charge carriers in polyamides. One of the most promising is ionized protons. From the present analysis of the EP-process on the basis of the theoretical model developed by Coelho Coelho1983 , the diffusion constant and equilibrium concentration of the charge carriers are obtained as shown in Figs. 16 and 17. The charge carrier concentration shows almost no significant temperature dependence for the temperature range investigated in this study, and has a value of cm-3. The concentration of hydrogen atoms in the polyamide can be evaluated as cm-3. Therefore, the ratio of the concentration of the charge carriers to that of the hydrogen atoms in the polyamide can be calculated as follows: = 0.02 %. Hence, ionized protons are possible candidates for the charge carrier in PA66/6I.
The absolute values of the diffusion constants of the charge carriers obtained in this study can be compared with those of various particles in the literature in the following mammer:
-
1.
It is well-known that there is a possibility of water uptake in polyamide. The diffusion constant of adsorbed water molecules in amorphous polyamide copolymers has been measured by neutron scattering and is estimated to be between 10-6 and 10-5cm2/sec for the temperature range from 350 K to 430 K Laurati2012 .
-
2.
The mutual diffusion constant of polystyrene (PS) chains at the interface between h-PS and d-PS has been reported in Ref. Whitlow1991 . For 105, the mutual diffusion constant of PS changes from 2.010-16 to 1.210-14cm2/sec, as the temperature increases from 396 K to 413 K.
-
3.
Similar measurements of the diffusion constant of deuterated polyethylene (PE) in a matrix of hydrogenated PE show that the diffusion cosntant at 449 K is equal to 0.2 Klein1978 . Here, for , the value of is equal to 210-9cm2/sec.
-
4.
The tracer diffusion constant of the chloride ion Cl- in polyamide-6 film has been measured in Ref. Chantrey1969 . The diffusion constant ranges from 1.410-9 to 3.410-8cm2/sec, depending on the pH at room temperature.
-
5.
The calculated diffusion constant of the hydrogen combined to the terminal amines in polyamide-6,6 is reported to be 610-13cm2/sec at 298 K Zaikov1988 .
The diffusion motion of water adsorbed on PA66/6I is much faster than the observed diffusion motion in this study. The observed diffusion constants of the chloride in polyamide-6 and the calculated ones of the combined hydrogens in polyamide-6,6 are larger than those observed in PA66/6I. On the other hand, the diffusion constants related to the reptation motion of PE chains are comparable to the observed values.
The comparison of the observed diffusion constants for PA66/6I in Fig. 17 with various diffusion constants in the literature suggests that the molecular motion of the charge carriers is strongly correlated with the motion of entire chains of the polyamide, if ionized protons are the actual charge carriers responsible for the EP-process in PA66/6I. The observed results are quite consistent with this idea, although further direct measurements of both the molecular motion of ionized protons and the reptation motion of the polyamide are required for further investigation.
VI Concluding remarks
In this study, the dynamics of the electrode polarization process (EP-process) and the -process in thin films of an amorphous polyamide copolymer were investigated using dielectric relaxation spectroscopy measurements. The obtained results are summarized as follows:
-
1.
The relaxation time of the EP-process has a Vogel-Fulcher-Tammann type of temperature dependence, and the evaluated from the EP-process agrees very well with the determined from differential scanning calorimetry measurements. The fragility index derived from the EP-process increases with decreasing film thickness.
-
2.
There is a distinct deviation from this linear law for thicknesses smaller than a critical value. This deviation corresponds to an increase in the diffusion constant of the charge carriers, which are responsible for the EP-process. The -process is located in a region of higher frequency than the EP-process at high temperatures, but merges with the EP-process near .
-
3.
The dependence of the relaxation time of the -process on the film thickness is different from that of the EP-process. This suggests that there is decoupling between the segmental motion of the polymers and the translational motion of charge carriers in confinement.
In the present study, we successfully derived the physical properties of the glassy dynamics from those of the EP-process. This means that it is possible to evaluate the glassy dynamics even if the -process cannot be observed as a result of the existence of a large signal related to the motion of charges. Molecular motion, such as the -process, may be clarified in large polar polymeric sytems through the EP-process. For crystalline polyamide systems, the Maxwell-Wagner-Sillar interfacial polarization process should appear, in addition to the EP-process. Even in such systems, the evaluation of the glassy dynamics from the EP-process should be possible in principle, although actual data analysis would be very difficult. We also showed that there is possible decoupling between the rotational motion of polyamide chain segments and the translational motion of charge carriers.
Acknowledgements.
This work was supported by a Grant-in-Aid for Scientific Research (B) (No. 25287108) and Exploratory Research (No. 25610127) from the Japan Society for the Promotion of Science. The authors would like to express their cordial thanks to Solvay for supplying them with the amorphous random copolymer PA66/6I. They also thank the anonymous reviewer for the very useful comments and suggestions. The synchrotron radiation experiments were performed at the BL40B2 of SPring-8 with the approval of the Japan Synchrotron Radiation Research Institute (JASRI) (Proposals 2013A1173 and 2014A1230).References
- (1) K. L. Ngai, in J. Mark, ed., Physical Properties of Polymers (Cambridge University Press, 2004), pp. 72–152, http://dx.doi.org/10.1017/CBO9781139165167.
- (2) G. Adam and J. H. Gibbs, J. Chem. Phys. 43, 139 (1965).
- (3) L. Berthier, G. Biroli, J.-P. Bouchaud, L. Cipelletti, and W. van Saarloos, Dynamical Heterogeneities in Glasses, Colloids, and Granular Media (Oxford University Press, New York, 2011), ISBN 978-0-19-969147-0.
- (4) M. Alcoutlabi and G. B. McKenna, J. Phys.: Condens. Matter 17, R461 (2005).
- (5) M. Tress, M. Erber, E. U. Mapesa, H. Huth, J. Müller, A. Serghei, C. Schick, K.-J. Eichhorn, B. Voit, and F. Kremer, Macromolecules 43, 9937 (2010).
- (6) M. Y. Efremov, A. V. Kiyanova, J. Last, S. S. Soofi, C. Thode, and P. F. Nealey, Phys. Rev. E 86, 021501 (2012).
- (7) I. Chang, F. Fujara, B. Geil, G. Heuberger, T. Mangel, and H. Sillescu, J. Non-Cryst. Solids 172-174, 248 (1994).
- (8) M. D. Ediger, Annu. Rev. Phys. Chem. 51, 99 (2000).
- (9) S. Napolitano and M. Wübbenhorst, in F. Kremer, ed., Dynamics in Geometrical Confinement (Springer, 2014), pp. 279–306.
- (10) K. Fukao and Y. Miyamoto, Phys. Rev. E 61, 1743 (2000).
- (11) S. Napolitano, S. Capponi, and B. Vanroy, Eur. Phys. J. E 36, 61 (2013).
- (12) D. Labahn, R. Mix, and A. Schönhals, Phys. Rev. E 79, 011801 (2009).
- (13) H. Yin, S. Napolitano, and A. Schönhals, Macromolecules 45, 1652 (2012).
- (14) N. G. McCrum, B. E. Read, and G. Williams, Anelastic and dielectric effects in polymeric solids (John Wiley, London, New York, 1967).
- (15) W. O. Baker and W. A. Yager, J. Amer. Chem. Soc. 64, 2171 (1942).
- (16) R. H. Boyd, J. Chem. Phys. 30, 1276 (1959).
- (17) E. Laredo and M. C. Hernandez, J. Polym. Sci. Part B: Polym. Phys. 35, 2879 (1997).
- (18) R. M. Neagu, E. Neagu, A. Kyritsis, and P. Pissis, J. Phys. D: Appl. Phys. 33, 1921 (2000).
- (19) H. Lu, X. Zhang, B. He, and H. Zhang, J. Appl. Polym. Sci. 102, 3590 (2006).
- (20) M. Laurati, P. Sotta, D. R. Long, L.-A. Fillot, A. Arbe, A. Alegría, J. P. Embs, T. Unruh, G. J. Schneider, and J. Colmenero, Macromolecules 45, 1676 (2012).
- (21) A. Schönhals and F. Kremer, in F. Kremer and A. Schönhals, eds., Broadband Dielectric Spectroscopy (Springer Berlin Heidelberg, 2003), pp. 59–98, ISBN 978-3-642-62809-2.
- (22) H. Kiho, Y. Miyamoto, and H. Miyaji, Polymer 27, 1542 (1986).
- (23) G. Blum, F. Kremer, T. Juworek, and G. Wegner, Adv. Mater. 7, 1017 (1995).
- (24) J. R. Macdonald, Phys. Rev. 92, 4 (1953).
- (25) R. Coelho, Rev. Phys. Appl. (Paris) 18, 137 (1983).
- (26) R. J. Klein, S. Zhang, S. Dou, B. H. Jones, R. H. Colby, and J. Runt, J. Chem. Phys. 124, , 144903 (2006).
- (27) A. Einstein, Ann. Phys. (Leipzig) 17, 549 (1905).
- (28) R. Kubo, M. Toda, and N. Hashitsume, in Statistical Physics II: Nonequilibrium Statistical Mechanics (Springer Berlin Heidelberg, 1991), ISBN 3-540-53833-X.
- (29) A. Serghei, M. Tress, J. R. Sangoro, and F. Kremer, Phys. Rev. B 80, 184301 (2009).
- (30) J. R. Sangoro and F. Kremer, Acc. Chem. Res. 45, 525 (2012).
- (31) J. R. Sangoro, C. Iacob, A. L. Agapov, Y. Wang, S. Berdzinski, H. Rexhausen, V. Strehmel, C. Friedrich, A. P. Sokolov, and F. Kremer, Soft Matter 10, 3536 (2014).
- (32) Y. Wang, C.-N. Sun, F. Fan, J. R. Sangoro, M. B. Berman, S. G. Greenbaum, T. A. Zawodzinski, and A. P. Sokolov, Phys. Rev. E 87, 042308 (2013).
- (33) S. Havriliak and S. Negami, Polymer 8, 161 (1967).
- (34) H. Vogel, Phys. Z. 22, 645 (1921).
- (35) G. S. Fulcher, J. Am. Ceram. Soc. 8, 339 (1925).
- (36) G. S. Fulcher, J. Am. Ceram. Soc. 8, 789 (1925).
- (37) G. Tammann and W. Hesse, Z. Anorg. Allg. Chem. 156, 245 (1926).
- (38) D. Boese and F. Kremer, Macromolecules 23, 829 (1990).
- (39) G. R. Strobl, in The Physics of Polymers: Concepts for Understanding Their Structures and Behavior, Third Edition (Springer Berlin Heidelberg, 2007), p. 263, ISBN 978-3-540-25278-8.
- (40) R. Böhmer and C. A. Angell, Phys. Rev. B 45, 10091 (1992).
- (41) K. Fukao and Y. Miyamoto, Phys. Rev. E 64, 011803 (2001).
- (42) C. M. Evans, H. Deng, W. F. Jager, and J. M. Torkelson, Macromolecules 46, 6091 (2013).
- (43) C. Zhang and R. D. Priestley, Soft Matter 9, 7076 (2013).
- (44) S. J. Whitlow and R. P. Wool, Macromolecules 24, 5926 (1991).
- (45) J. Klein, Nature 271, 143 (1978).
- (46) G. Chantrey and I. D. Rattee, J. Soc. Dyers & Colour. 85, 618 (1969).
- (47) G. E. Zaikov, A. L. Iordanskii, and V. S. Markin, Diffusion of Electrolytes in Polymers (CRC Press, 1988), ISBN 9789067640770.