A Population of Ultraluminous X-ray Sources with An Accreting Neutron Star
Abstract
Most ultraluminous X-ray sources (ULXs) are believed to be X-ray binary systems, but previous observational and theoretical studies tend to prefer a black hole rather than a neutron star accretor. The recent discovery of 1.37 s pulsations from the ULX M82 X-2 has established its nature as a magnetized neutron star. In this work we model the formation history of neutron star ULXs in an M82- or Milky Way-like galaxy, by use of both binary population synthesis and detailed binary evolution calculations. We find that the birthrate is around for the incipient X-ray binaries in both cases. We demonstrate the distribution of the ULX population in the donor mass - orbital period plane. Our results suggest that, compared with black hole X-ray binaries, neutron star X-ray binaries may significantly contribute to the ULX population, and high-mass and intermediate-mass X-ray binaries dominate the neutron star ULX population in M82- and Milky Way-like galaxies, respectively.
1 Introduction
Ultraluminous X-ray sources (ULXs) are off-nuclear, point-like sources with X-ray luminosities exceeding ergs-1, first discovered in nearby galaxies with Einstein (Fabbiano, 1989). More recent observations with improved X-ray telescopes, such as Chandra and XMM-Newton, have greatly increased the number of this kind of sources (Fabbiano & White, 2006; Roberts, 2007; Feng & Soria, 2011, for reviews). They are most likely X-ray binaries (XRBs), in which a compact object accretes from a donor star through Roche-lobe overflow (RLOF), but the nature of these objects has not been completely uncovered. If the radiation is isotropic and below the Eddington limit, the extremely high luminosities imply the presence of an accreting intermediate-mass () black hole (BH) (Colbert & Mushotzky, 1999). Alternatively they are believed to be stellar-mass BHs with super-Eddington accretion. For example, King et al. (2001) proposed that geometrical beaming in the case of rapid accretion could lead to a very high apparent luminosity for a stellar-mass BH. Begelman (2002) showed that the isotropic luminosity of an accreting BH can exceed the Eddington limit by a factor of about 10 due to the photon-bubble instability in the accretion disk. Recently, the masses of two ULXs were dynamically measured to be in the stellar-mass BH range (Liu et al., 2013; Motch et al., 2014).
Since the X-ray luminosities of ULXs are significantly higher than the Eddington limit (around ) for a neutron star (NS)111If the NS possesses a strong magnetic field to channel the accreting material onto its surface, the critical luminosity could be higher, about , where and are the length and the thickness of the accreting funnel, respectively (Basko & Sunyaev, 1976)., it is challenging to explain these bright X-ray sources with an accreting NS. However, the discovery of 1.37 s pulsations from the ULX M82 X-2 has provided unambiguous evidence for its NS nature (Bachetti et al., 2014), implying that accreting NSs also contribute to the ULX population.
M82 X-2 is in a 2.53 day orbit with a companion star more massive than (Bachetti et al., 2014). The extremely high (isotropic) luminosity (around ergs-1) (Feng et al., 2010) and rapid spin-up (at a rate of ss-1) (Bachetti et al., 2014) clearly indicate that the binary is undergoing rapid mass transfer. Since the companion star is significantly more massive than the NS, the mass transfer is subject to delayed dynamical instability, and must be currently in the early phase of RLOF. After that the NS will be engulfed by the transferred matter, resulting in the formation of a common envelope (CE) (Bhattacharya & van den Heuvel, 1991). The objective of this paper is to investigate how many such accreting NSs can be responsible for ULXs in a galaxy like M82 or the Milky Way (MW). We first explore the properties of the incipient NS XRBs, using a binary population synthesis (BPS) method (in Sect. 2), then calculate the detailed evolutions of these XRBs to obtain the numbers and the luminosity functions of the ULXs (in Sect. 3). We summarize our results in Sect. 4.
2 Generation of the incipient NS XRBs
To model the formation history of NS XRB-ULXs, we adopt the BPS code initially developed by Hurley et al. (2002) to calculate the evolution of a large population of the primordial binaries. We have updated and modified the code in several aspects (see Shao & Li, 2014, for details), especially the conditions for dynamically stable mass transfer and the treatments of CE evolution, which are briefly described as follows.
During the evolution of a primordial binary, the primary first evolves off the main sequence and expands in size. This can lead to RLOF onto the secondary, causing it to be spun up and rejuvenated. If the mass transfer proceeds so slowly that the secondary can remain in thermal equilibrium, the mass transfer is thought to be stable. Otherwise the secondary will get out of thermal equilibrium and expand. This expansion may finally cause the secondary to fill its own RL, leading to the formation of a contact binary (Nelson & Eggleton, 2001). A critical mass ratio is usually used to determine whether or not the mass transfer is dynamically stable in a binary. Instead of using the empirical results for of Hurley et al. (2002), Shao & Li (2014) numerically calculate it considering both the response of the secondary to mass accretion and the effect of possible mass loss. Here we use the results of Model II given by Shao & Li (2014), in which it is assumed that half of the transferred mass is accreted by the secondary, and the other half is lost from the system. This model can well fit the observational distribution of Be/X-ray binaries.
When the mass transfer is dynamically unstable, we employ the standard energy conservation equation (Webbink, 1984) to deal with the subsequent CE evolution, that is, in the spiral-in phase, the orbital energy of the secondary is used to expel the envelope of the primary. When calculating the binding energy of the stellar envelope, we include the contribution from the internal energy and adopt the fitting formulae of Xu & Li (2010) for the binding energy parameter . We assume the CE efficiency in our calculations.
The evolution of a binary is determined by the primary mass , secondary mass , and orbital angular momentum (Hurley et al., 2002). The orbit is invariably circularized before interaction by standard tidal interactions, so all binary orbits are taken to be circular. We adopt the initial mass function given by Kroupa et al. (1993) for the primary stars, and a flat distribution between 0 and 1 for the initial mass ratio of the secondary to the primary. For the initial orbital separation , we assume that is evenly distributed between and . We adopt solar metallicity in our simulations.
We consider two cases of star formation activities for star forming galaxies like M82 and late-type galaxies like the MW. We adopt a constant overall star formation rate of over the last 100 Myr (Förster Schreiber et al., 2003; Yao, 2009) in case (1) , and a constant star formation rate over the 13 Gyr period in case (2).
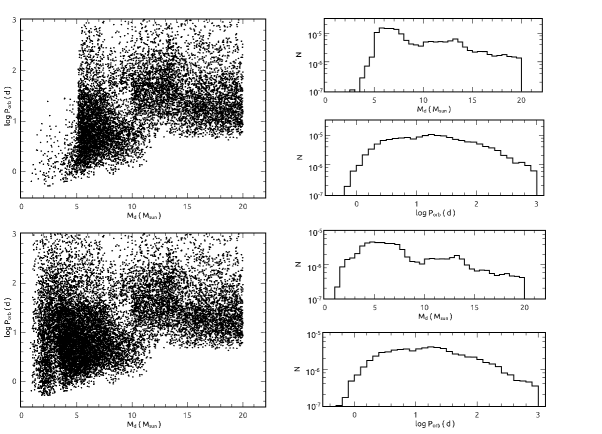
We have evolved a population of primordial binaries, and generated a subset of about and incipient XRBs containing a NS and an unevolved secondary star of mass lower than in cases (1) and (2), respectively. Note that for the mechanisms of NS formation we consider both core-collapse supernovae of massive stars and electron-capture supernovae of intermediate-mass stars, following the criterion suggested by Fryer et al. (2012). In Fig. 1 we plot the distribution of these XRBs in the donor (or secondary) mass - orbital period () plane (the left panel) and the birthrate distribution as a function of the donor mass and of the orbital period (right panel). Note that in case (1) most of the secondaries are more massive than (upper panel), because of the much shorter evolution time than in case (2) (lower panel). The total birthrates are estimated to be about and , respectively.
3 Evolution to ULXs
Based on the result in Fig. 1 we calculate the evolution of the generated NS XRBs with the TWIN version of the stellar evolution code developed by Eggleton (1971, 1972). Here the initial mass of the NS is assumed to be . We have evolved thousands of binary systems with the donor mass varying from to by steps of , and the orbital period (in units of days) increasing logarithmically from 0.5 to 3 by steps of 0.1, as obtained from Fig. 1. We use these binaries to represent all the XRBs, and their numbers are calculated by cumulating the XRBs in a specific matrix of in the plane by weighing their formation rates and life spans. Note that the XRBs are initially eccentric due to the supernova kicks, which are assumed to have a Maxwellian distribution with a dispersion kms-1 (Hobbs et al., 2005) for core-collapse supernovae and 50 kms-1 (Dessart et al., 2006) for electron-capture supernovae. Here we assume that the orbital angular momentum of an incipient XRB is conserved and then the system is quickly circularized with a new separation, which is smaller by a factor of (Bhattacharya & van den Heuvel, 1991).
In Eggleton’s code mass transfer via RLOF can be modeled as a function of the potential difference between the stellar surface and the RL surface. When one of the stars overfills its RL, the mass flux at each mesh point outside the Roche surface is given by
| (1) |
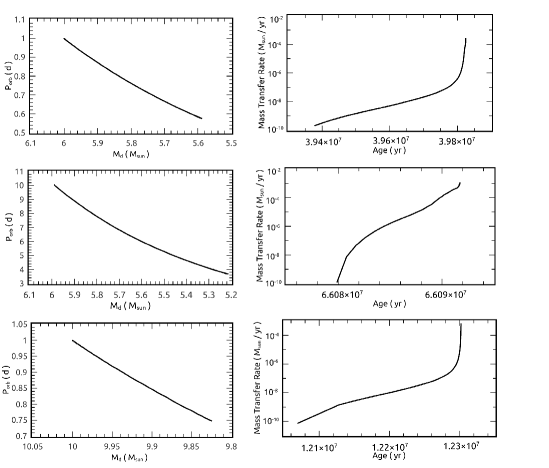
where and are the mass coordinate and the radius, respectively. The mass transfer rate is then calculated by integrating Eq. (1) over all mesh points outside the Roche surface potential. Actually before the photospheric radius of a massive donor star reaches its RL, the atmospheric matter begins to spill over towards the NS along the inner Langrangian point. This phase of beginning atmospheric RLOF precedes the main phase of RLOF until the mass transfer rate rises to the Eddington value (Savonije, 1979). Subsequently the mass transfer rate increases rapidly to become super-Eddington. In Fig. 2 we show the exampled evolutionary tracks of three binary systems. The initial parameters are and d, and d, and and d in the top, middle, and bottom panels, respectively. In the top panel, the donor evolves to overflow from the RL at the age of Myr. The mass transfer rate increases from to within a time of yr. The orbital period decays to 0.58 d, and the donor mass decreases to , which means that of the donor’s envelope is stripped before the CE occurrence. In the middle panel, a longer initial orbital period of 10 d is set for the binary. The onset of RLOF occurs at the age of 66.08 Myr, and the donor star is more evolved. The mass transfer rate rises from to within a shorter time of yr. The orbital period drops to d, and material is transferred from the donor within this time. In the bottom panel, the initial donor star is more massive (with a mass of ), and the mass transfer lasts yr. The orbital period decreases to 0.75 d when 0.17 of the donor’s envelope is transferred.
Given the mass transfer rate, we calculate the X-ray luminosity in two ways. In the first one, we calculate it with the traditional formula
| (2) |
without considering the Eddington limit. In the second, we use the same formula for sub-Eddington accretion rates. When is higher than the Eddington accretion rate , we adopt the model of King (2008) to convert the mass transfer rates into the X-ray luminosities. In this model, the accretion disk becomes geometrically thick, which influences the X-ray luminosity in two ways. First, radiation becomes less efficient and the bolometric luminosity no longer follows linearly. Second, the outgoing radiation may be collimated due to a biconical geometry at the inner part of the accretion disk. The accretion luminosity is then contributed by two parts. The region outside the so-called spherization radius where the mass inflow first becomes locally Eddington (Shakura & Syunyaev, 1973; Begelman et al., 2006) releases the accretion luminosity close to . For the region within , the accretion luminosity is about , where is the Schwarzschild radius (Frank et al., 2002). The total luminosity is then (King, 2008),
| (3) |
Because of the geometric collimation, one can see the source in directions within one of the cones, with an apparent (isotropic) X-ray luminosity
| (4) |
where is the beaming factor, possibly depending on . Here we adopt as suggested by King (2008).
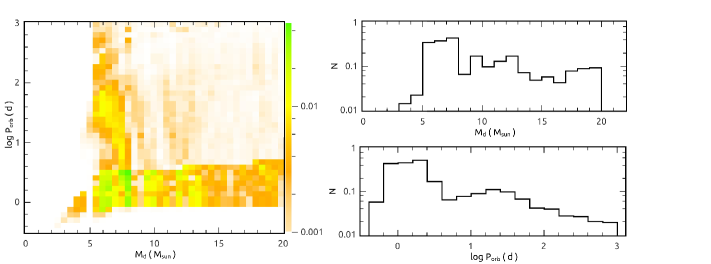
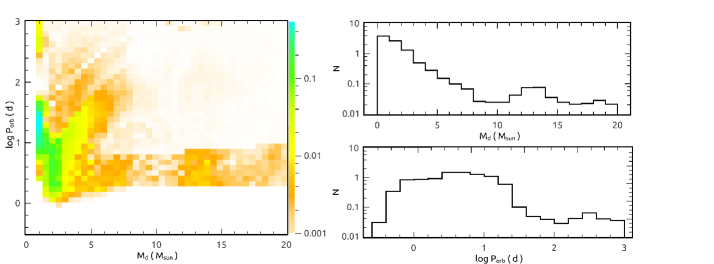
In Fig. 3 we present the number distribution of the predicted ULX population in case (1) (i.e., in a galaxy like M82) as a function of and , with greater than ergs-1. In the upper and lower panels the X-ray luminosities are calculated with Eqs. (2) and (4), respectively. As noted before, for each matrix element in the left panel, the number is calculated by multiplying the birthrate of the incipient XRBs with the evolutionary time span within the matrix element. It is seen that most ULXs tend to be high-mass XRBs in relatively short orbits (with orbital periods shorter than a few days). Figure 4 shows the same distributions in case (2) (i.e., in a MW-like galaxy). A comparison of Figs. 3 and 4 shows that in the latter case XRBs with donor of mass lower than dominate the population because of their much longer lifetime.
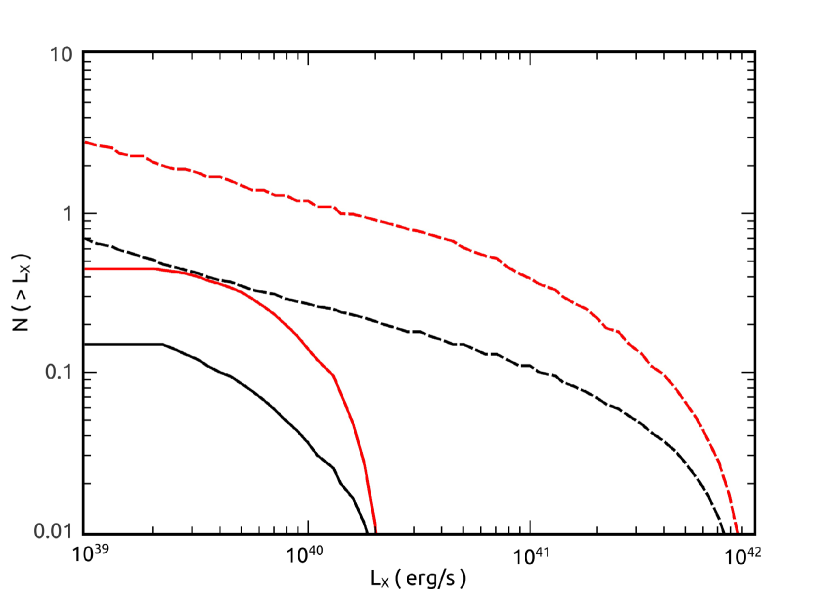
In Fig. 5 we plot the X-ray luminosity function of the ULX population in cases (1) (left) and (2) (right). The red and black curves correspond to higher than and , respectively. For the dashed and solid curves the luminosities are calculated with Eqs. (2) and (4), respectively. In case (2) the effect of anisotropic radiation on the observable number is taken into account. The predicted ULX numbers lie between a few tenths and a few in each case. Madhusudhan et al. (2008) investigated the evolution of ULXs consisting of a stellar-mass BH accretor, and found that their numbers range from 0.1 to 0.2 for higher than ergs-1 in a MW-like galaxy. Hence accreting NSs may play an important role in the formation of ULXs, compared with BHs.
4 Summary
We have calculated the formation history of NS ULXs. Our results show that, (1) compared with BH XRBs, NS XRBs may significantly contribute to the ULX population; (2) high-mass and intermediate-mass XRBs dominate the ULX population in M82- and MW-like galaxies, respectively.
References
- Bachetti et al. (2014) Bachetti, M., et al. 2014, Nature, 514, 202
- Basko & Sunyaev (1976) Basko, M. M., & Sunyaev, R. A. 1976, MNRAS, 175, 395
- Begelman (2002) Begelman, M., 2002, ApJ, 568, 97
- Begelman et al. (2006) Begelman, M. C., King, A. R., & Pringle J. E., 2006, MNRAS, 370, 399
- Belczynski et al. (2008) Belczynski, K., Kalogera, V., Rasio, F., Taam, R., Zezas, A. et al. 2008, ApJS, 174, 223
- Bhattacharya & van den Heuvel (1991) Bhattacharya, D., & van den Heuvel, E. P. J. 1991, PhR, 203, 1
- Colbert & Mushotzky (1999) Colbert, E., & Mushotzky, R. 1999, ApJ, 519, 89
- Dessart et al. (2006) Dessart, L., Burrows, A., Ott, C. D., et al. 2006, ApJ, 644, 1063
- Eggleton (1971) Eggleton, P. P. 1971, MNRAS, 151, 351
- Eggleton (1972) Eggleton, P. P. 1972, MNRAS, 156, 361
- Fabbiano (1989) Fabbiano, G. 1989, ARA&A, 27, 87
- Fabbiano & White (2006) Fabbiano, G. & White, N. E. Compact stellar X-ray sources in normal galaxies, ed. W. H. G. Lewin & M. van der Klis (Cambridge Univ. Press), 475
- Feng et al. (2010) Feng, H, Rao, F., & Kaaret, P. 2010, ApJ, 710, L137
- Feng & Soria (2011) Feng, H., & Soria, R. 2011, New A Rev., 55, 166
- Förster Schreiber et al. (2003) Förster Schreiber, N., Genzel, R. & Lutz, D. 2003, ApJ, 599, 193
- Frank et al. (2002) Frank, J., King, A. R., & Raine, D. J., 2002, Accretion Power in Astrophysics, 3rd edn. Cambridge Univ. Press, New York
- Fryer et al. (2012) Fryer, C., Belczynski, K., Wiktorowicz, G., et al. 2012, ApJ, 749, 91
- Hobbs et al. (2005) Hobbs, G., Lorimer, D. R., Lyne, A. G., & Kramer, M. 2005, MNRAS, 360, 974
- Hurley et al. (2002) Hurley, J. R., Tout, C. A., & Pols, O. R. 2002, MNRAS, 329, 897
- King (2008) King, A. R. 2008, MNRAS, 385, L113
- King et al. (2001) King, A. R., Davies., M. B., Ward, M. J., Fabbiano, G., & Elvis, M. 2001, ApJ, 552, L109
- Kroupa et al. (1993) Kroupa, P., Tout, C. A., & Gilmore, G. 1993, MNRAS, 262, 545
- Liu et al. (2013) Liu, J., Bregman, J. N., Bai, Y., Justham, S. & Crowther, P. 2013, Nature, 503, 500
- Madhusudhan et al. (2008) Madhusudhan, N., Rappaport, S., Podsiadlowski, Ph., & Nelson, L. 2008, ApJ, 688, 1235
- Motch et al. (2014) Motch, C., Pakull, M. W., Soria, R., Grisé, F., & Pietrzyński, G. 2014, Nature, 514, 198
- Nelson & Eggleton (2001) Nelson, C. A. & Eggleton, P. P. 2001, ApJ, 552, 664
- Poutanen et al. (2007) Poutanen, J., et al. 2007, MNRAS, 377, 1187
- Roberts (2007) Roberts, T. P. 2007, Ap&SS, 311, 203
- Savonije (1979) Savonije, G. J. 1979, A&A, 71, 352
- Shakura & Syunyaev (1973) Shakura, N. I., & Syunyaev, R. A. 1973, A&A, 24, 337
- Shao & Li (2014) Shao, Y. & Li, X.-D. 2014, ApJ, 796, 37
- Webbink (1984) Webbink, R. F. 1984, ApJ, 277, 355
- Xu & Li (2010) Xu, X.-J. & Li, X.-D. 2010, ApJ, 716, 114
- Yao (2009) Yao, L. 2009, ApJ, 705, 766