Exploring the intrabinary shock from the redback millisecond pulsar PSR J2129-0429
Abstract
We have investigated the intrabinary shock emission from the redback millisecond pulsar PSR J2129-0429 with XMM-Newton and Fermi. Orbital modulation in X-ray and UV can be clearly seen. Its X-ray modulation has a double-peak structure with a dip in between. The observed X-rays are non-thermal dominant which can be modeled by a power-law with . Intrabinary shock can be the origin of the observed X-rays. The UV light curve is resulted from the ellipsoidal modulation of the companion. Modeling the UV light curve prefers a large viewing angle. The heating effect of the UV light curve is found to be negligible which suggests the high energy radiation beam of PSR J2129-0429 does not direct toward its companion. On the other hand, no significant orbital modulation can be found in ray which suggests the majority of the -rays come from the pulsar.
1 Introduction
A new population of eclipsing millisecond pulsars (MSPs) has emerged in the last five years, which is characterized with an orbital period hrs and a companion mass . They are commonly referred as “redbacks” (Roberts 2013; Hui 2014). Currently, 18 redback MSPs have been discovered. 111see http://apatruno.wordpress.com/about/millisecond-pulsar-catalogue/ for updated information. Through coordinated multiwavelength searches, the population of redbacks is growing (Kong et al. 2012,2014; Hui et al. 2015). These MSPs play a crucial role in exploring the transition between rotation-powered system and accretion-powered system.
To better understand such transition, it is important to probe the interactions between MSPs and their companions. In rotation-powered state, the collision between the pulsar wind and the mass outflow from the companion can produce intrabinary shock. The non-thermal X-rays from the accelerated particles in the shock region can be modulated at the orbital period. This has been observed in various redbacks/black-widows (e.g. Tam et al. 2010; Huang et al. 2012; Hui et al. 2014).
PSR J2129-0429 is one of the poorly studied redbacks, which was discovered in the radio pulsation search of the ray source 2FGL J2129.8-0428 with the Green Bank Telescope (Hessels et al. 2011; Ray et al. 2012). The dispersion measure suggests a distance of kpc (Ray et al. 2012; Roberts 2014222http://fermi.gsfc.nasa.gov/science/mtgs/symposia/2014/program/10ARoberts.pdf). Its spin period and orbital period are ms d respectively (cf. Tab. 2 in Ray et al. 2012). Roberts (2014) have reported its surface dipolar magnetic field of G. This implies a characteristic age and spin-down luminosity at the order of yrs and erg s-1 respectively. These suggest PSR J2129-0429 to be a young energetic MSP with a relatively high surface magnetic field (Roberts 2014).
The minimum mass of its companion is found to be by radio timing (Ray et al. 2012). Optical observations suggest its companion is significantly bloated with a Roche lobe filling factor of (Bellm et al. 2013). Its X-ray position of PSR J2129-0429 has recently been constrained by using the archival Swift XRT data (i.e. source J2129B in Linares 2014). Using the data obtained by XMM-Newton, Roberts (2014) has found significant X-ray orbital modulation from this system. However, the detailed emission properties of PSR J2129-0429 have not yet been reported. In this Letter, we report the results from our investigation of PSR J2129-0429 by using the X-ray and UV data obtained by XMM-Newton. We also present the analysis of the -ray data obtained by Fermi -ray Space Telescope.
2 XMM-Newton Observation & Data Analysis
The XMM-Newton observation of PSR J2129-0429 started on 28 October 2013 with a total exposure of ks (ObsID: 0725070101; PI: Roberts). Using XMM Science Analysis Software (XMMSAS version 13.5.0), we reduced and filtered the data in a standard procedure. The effective exposures for MOS1, MOS2 and PN after filtering are found to be ks, ks and ks respectively. This X-ray observation covers orbital cycles of PSR J2129-0429. All the EPIC data are found to be unaffected by CCD pile-up.
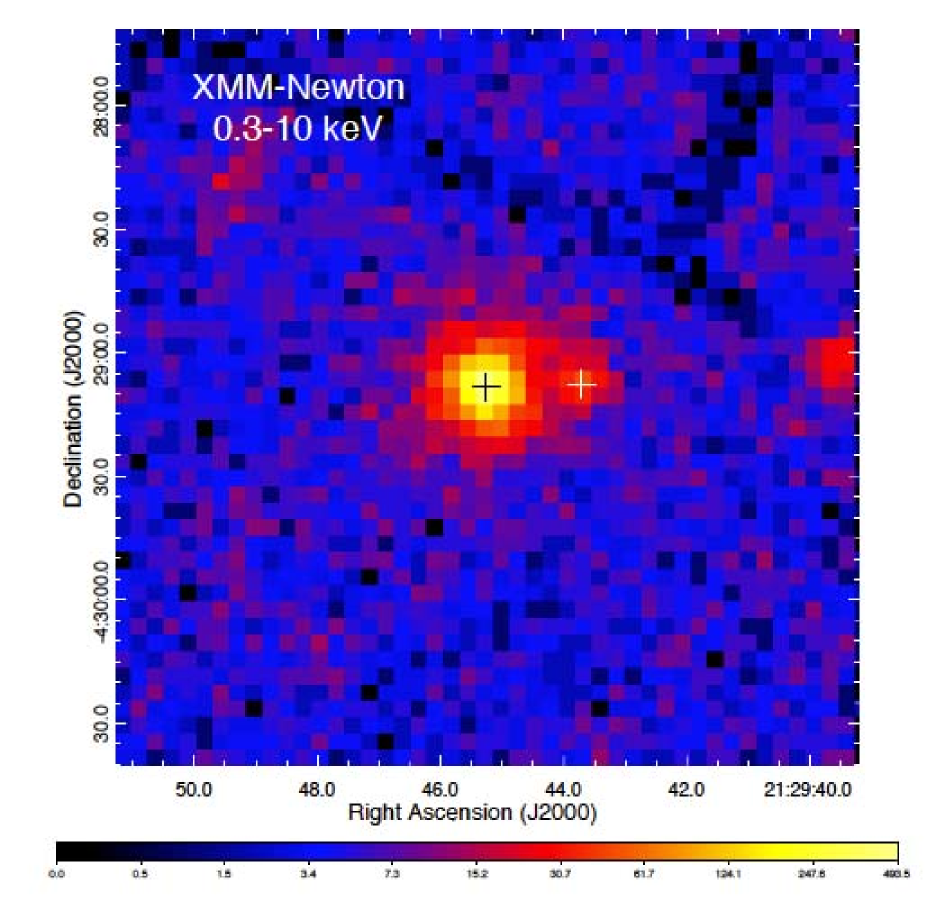
With all the EPIC data merged, we produced an X-ray image of the field around PSR J2129-0429 ( see Figure 1). With the aid of the XMMSAS task edetect_chain, the X-ray position of PSR J2129-0429 determined by this observation is RA=21h29m45.250s Dec=-04∘2907.95 (J2000) with a statistical uncertainty of .333Absolute astrometric accuracy of EPIC is . This is consistent with the X-ray source J2129B reported by Linares (2014) but with the position better constrained.
In Fig. 1, we note that the X-ray image of PSR J2129-0429 is slightly extended toward west. Such feature can also be seen in the images from individual cameras. In MOS1/2 data, it is detected as a distinct source at RA=21h29m43.749s Dec=-04∘2907.83 (J2000) with a statistical error of . We do not find any identified object within 5 from this position in SIMBAD and NED. Also, we do not find any optical/IR counterpart in the USNO-B1.0 and 2MASS point source catalogs. Within 8 around its nominal position, we have collected net counts from all cameras. We found that its spectra can be described by an absorbed power-law model with cm-2 and a photon index of . Its absorption-corrected flux in keV is erg cm-2 s-1. Given the moderate angular resolution of XMM-Newton, we cannot unambiguously determine whether this feature is indeed a distinct source or a bow-shock nebula associated with PSR J2129-0429. Since the nature of this feature is uncertain, we excluded its contribution in all subsequent analyses.
Before any temporal analysis performed, we applied barycentric correction to the arrival times of all the events by using the updated planetary ephemeris JPL DE405. We extracted the events from a circular source region of radius centered at the X-ray position of PSR J2129-0429 so as to exclude the aforementioned feature in the west. After subtracting the background by sampling the events from the source-free regions in individual cameras, there are 718 cts, 732 cts and 2382 cts extracted from MOS1, MOS2 and PN CCDs, respectively. For improving the photon statistic, we merged all the EPIC data and folded the background-subtracted X-ray light curve at the orbital period of PSR J2129-0429, which is shown in the top panel of Figure 2. Since the radio timing model of PSR J2129-0429 is not publicly available, we arbitrarily chose the day that this observation started (i.e. MJD 56593) to be phase zero throughout our investigation.
The maxima of the X-ray modulation are found at the orbital phases and . In between these two maxima, there is a dip at . We have inspected the background-subtracted light curves from individual cameras and found the dip at in all three cameras. Therefore, we confirmed that this feature is genuine. We further examined the X-ray orbital modulation of PSR J2129-0429 by dividing the EPIC data into soft band (0.3-2 keV) and hard band (2-10 keV) and investigated how does the X-ray hardness ratio, which is defined as (hard-soft)/(hard+soft), vary across the orbit. We found that the X-ray hardness ratio decreases in (see the middle panel in Fig. 2) which is apparently in unison with the decrement of X-ray intensity (top panel of Fig. 2). On the other hand, at phase where a dip has been observed, there is an indication for the enhancement of X-ray hardness.
The optical monitor (OM) on-board XMM-Newton has also observed PSR J2129-0429 in fast mode with UVW1 filter (291 nm) for a total integration time of ks. PSR J2129-0429 is the only source detected in this OM observation. This provides us with temporal and photometric information of PSR J2129-0429 in UV regime. The background-subtracted UV light curve of PSR J2129-0429 was automatically extracted by the XMMSAS tool omfchain. After barycentric correction, we folded the UV light curve at the orbital period of PSR J2129-0429 with phase zero defined at the same epoch for the X-ray light curve. The resultant UV light curve is shown in the bottom panel of Figure 2. Two UV peaks with a phase separation of are observed in one orbit. The minima at phases and apparently coincide with the dip and the minimum of the X-ray orbital modulation. For converting the magnitude into energy flux, we adopted a scale that the flux of Vega corresponds to 0.025 mag in UVW1 filter. The energy flux changes from erg cm-2 s-1 to erg cm-2 s-1 across the orbit.
For investigating its X-ray spectral properties, we extracted the source and background spectra from the same regions adopted in the temporal analysis. The spectra obtained from all three cameras are fitted simultaneously to the tested models. All the uncertainties quoted in this paper are for 2 parameters of interest (i.e. ).
We found that a simple absorbed power-law (PL) model can describe its phase-averaged X-ray spectra reasonably well ( for 59 d.o.f). The best-fit model yields a column density of cm-2, a photon index of and a normalization of photons keV-1 cm-2 s-1 at 1 keV. To investigate whether the phase-averaged spectrum requires an additional thermal component for modeling, we added a blackbody (BB) on top of the best-fit PL model. It results in a goodness-of-fit with for 57 d.o.f. which indicates that the additional BB component is required at a confidence level of . The PL+BB fit yields cm-2, , a power-law model normalization of photons keV-1 cm-2 s-1 at 1 keV, a blackbody temperature of keV with an emission radius of m, where is the distance to the pulsar in units of 1 kpc. The best-fit PL+BB model and the observed spectra are shown in Figure 3. The unabsorbed energy flux in keV is erg cm-2 s-1. The BB component contributes of the total flux in this band.
Motivated by the variation of X-ray hardness across the orbit (cf. Fig. 2), we performed a phase-resolved analysis to investigate how does the emission nature vary with orbital phase. We divided the orbit into two intervals, and , which encompass the peak and the trough of the orbital modulation respectively. For , we found that a single PL model is already sufficient for modeling the observed spectrum ( for 58 d.o.f) which yields cm-2, and a power-law model normalization of photons keV-1 cm-2 s-1 at 1 keV. Adding a BB component does not result in any improvement ( for 56 d.o.f.). The best-fit PL+BB model in this phase interval yields cm-2, , a power-law model normalization of photons keV-1 cm-2 s-1 at 1 keV, keV and m. Although the BB parameters are poorly constrained in , we note that their best-fit values are consistent with those inferred from the phase-averaged analysis.
On the other hand, in , we found that the BB component is required at confidence level. In this phase interval, the PL+BB fit yields cm-2, , a power-law model normalization of photons keV-1 cm-2 s-1 at 1 keV, keV and m. The corresponding goodness-of-fit is for 52 d.o.f. The BB parameters are fully consistent with those inferred in and the phase-averaged analysis. This suggests the thermal component provides a constant contribution in all orbital phases.
We have checked the robustness of the quoted spectral parameters by repeating all the aforementioned spectral fits with the background spectrum sampled from various source-free regions. Within errors, the parameters inferred from independent fittings are consistent.
3 Fermi LAT gamma-ray observations
Gamma-ray data were obtained, reduced and analyzed using the Fermi Science Tools package (v9r33p0), which is available from the Fermi Science Support Center 444http://fermi.gsfc.nasa.gov/ssc/data/analysis/software/. Events in the reprocessed Pass 7 “Source” class were selected and the P7REP_SOURCE_V15 version of the instrumental response functions were used. To reduce contamination from the Earth’s albedo, we excluded time intervals when the region-of-interest (ROI) was observed at zenith angles greater than 100° or when the rocking angle of the LAT was greater than 52°.
For spectral analysis, we used photons between 0.1 and 300 GeV within a ROI centered at the position of 2FGL J2129.8-0428 (Nolan et al. 2012). We performed binned likelihood analyzes with the gtlike tool. For source modeling, all 2FGL catalog sources (Nolan et al. 2012) within of the ROI center, the galactic diffuse emission (gll_iem_v05_rev1.fit) and isotropic diffuse emission (iso_source_v05_rev1.txt) were included. For sources more than 10° away from the position of 2FGL J2129.8-0428, the spectral parameters were fixed to the catalog values.
For spectral analysis, we used Fermi LAT data collected between 4 August 2008 and 17 December 2014. We modeled 2FGL J2129.8-0428 with a simple power law
| (1) |
and a power law with exponential cutoff
| (2) |
The fit with a simple power law gives and photons cm-2 s-1 above 100 MeV, and a test-statistic (TS; Mattox et al. 1996) value 238.2. The power-law spectrumis consistent with that reported in the 2FGL catalog (Nolan et al., 2012). Although the reported 2FGL spectrum is not significantly curved, we also fit 2FGL J2129.8-0428 using a power law with exponential cutoff (PLE). This gives , GeV and photons cm-2 s-1 above 100 MeV, and a TS value 258.4. The likelihood ratio test gives likelihood; therefore the PLE model is preferred over the PL model at a statistical significance of .
We also constructed a long-term light curve with 3-month bins, and did not find significant step-like flux change like the one observed for PSR J1023+0038 in July 2012 when the latter changed from a radio MSP phase to a LMXB phase (e.g. Takata, et al., 2014).
We further examine for possible gamma-ray orbital modulation using GeV photons obtained with Fermi observations over 6 years (4 August 2008 to 11 November 2014). About 2860 counts were obtained in a circular region of around 2FGL J2129.8-0428. With the same phase zero adopted in X-ray and optical investigations, the probability to randomly obtain a gamma-ray signal at least as significant as the one we obtained at the orbital period determined from optical observations, is 0.011 and 0.1 inspected through statistics () and test (=33.1 in 24 d.o.f.), respectively. So, we conclude no significant orbital modulation is detected in the gamma-ray band. The lack of orbital modulation does not support the shock origin of gamma-rays. A spectral cutoff at several GeV has been found from many gamma-ray MSPs (e.g., Abdo et al. 2009), and therefore the majority of the gamma-ray emission may come from the pulsar magnetosphere.


4 Discussion
We have investigated the X-ray and UV emission from PSR J2129-0429 with XMM-Newton. Both X-ray and UV light curves are significantly modulated at the orbital period. The X-ray emission is found to be non-thermal dominant with a small thermal contribution which presumably from the neutron star surface. While the intensity of the non-thermal emission varies across the orbit, we found the thermal component is essentially constant in all orbital phases.
The X-ray modulation has a double-peak structure with a dip in between. This is similar to the original black widow PSR B1957+20 (Huang et al. 2012), in which the dip appears when the secondary is between the pulsar and the Earth and its X-ray modulation can be explained by the Doppler boosting of the shocked pulsar wind that wraps the secondary star. Since we do not have any information of the radial velocity of the companion of PSR J2129-0429 from either optical spectroscopy or radio timing observation, we could not determine the geometry of its orbit with the current data. However, the phase of the X-ray dip/minimum align with the phase of optical minima, suggesting the X-ray dip/minimum are at either inferior conjunction or superior conjunction. In this scenario, the X-ray modulation can be caused by the Doppler boosting effect (see Huang et al. 2012 for a detailed discussion).
The optical modulation from the black widow and redback MSPs are usually observed with a single broad peak, since the hemisphere of the secondary star is heated by the irradiation of the strong pulsar radiations. The double peaks with 0.5 phase separation seen in Figure 2 suggests that the optical modulation of PSR J2129-0429 is not caused by the irradiation of the strong pulsar radiation. Hence, it is expected that PSR J2129-0429 belongs to a special case of the redback. Table 1 summaries the parameters of the redbacks in the Galactic field (see Roberts 2012; Romani & Shaw 2011; Kong et al. 2012); the projected separation between two stars (, sixth column) is calculated from (Frank et al. 2002), cm, where is the neutron star mass and with being the inferred minimum mass (fifth column) of the secondary and is the orbital inclination. In all the following estimation/modeling, we assume . We further calculate the typical size of the Roche-lobe from . The last column shows the ratio of the stellar luminosity without heating () and the pulsar luminosity deposited onto the stellar surface (), that is . Since the lack of the optical observations for most of the redbacks and the secondary star is a non-degenerate star, we infer the stellar luminosity without heating using a simple relation with for a main sequence star. For example, the effective temperature of the unheated side of the secondary is K for PSR J2339-0533 (Romani & Shaw 2011) and K for J1023+0038 (Thorstensen & Armstrong 2005). The inferred stellar luminosities are for J2339-0533 and for J1023+0038, respectively, which can be fitted by with a index . In the calculation, we used the parameter of PSR J2333-0533 for the normalization. The heating luminosity is calculated from , where . In Table 1, we see that the stellar luminosity of the secondary of PSR J2129-0429 can significantly exceed the heating luminosity, suggesting the heating effect is negligible in the optical light curve. It is also interesting to note that the redback PSR J1723-2838 has similar orbital properties to PSR J2129-0429. PSR J1723-2838 may be another candidate that shows no heating effect in the optical light curve. Apart from the pulsar wind, the irradiation of the GeV gamma-rays from the pulsar is a possible heating mechanism of the secondary star in the black widows/redbacks (c.f. Takata et al. 2010, 2012). In such a case, the absence of heating of PSR J2129-0429 suggest the gamma-ray beam does not direct toward its companion.
Assuming that the companion of PSR J2129-0429 fills the Roche-lobe, we constrain the viewing angle of the system by modeling the UV light curve. We assume the Roche-lobe filling factor to be unity and the observed UV photons are produced on the Roche-lobe surface (i.e. optical depth is unity on the Roche-lobe surface). The Roche-equipotential is given by (Frank et al. 2002)
| (3) |
where we assume two stars orbit on plane, and we used of PSR J2129-0429. The Roche-lobe surface is defined by the plane , where the inner Lagrangian point is calculated from
| (4) |
We divided the Roche-lobe surface into many segments. For the limb darkening to each segment, we used a simple linear law, (van Hamme 1993), where is the cosine of the angle between the local vector normal to the Roche-lobe surface and the Earth viewing angle. We chose a typical limb darkening coefficient . We ignored the effects of the gravity darkening (Lucy 1967) for simplicity. Hence the observed brightness of each segment is proportional to the intensity times the projected segment area. In the bottom panel of Figure 2, we compare the UV light curve and the model light curves for various Earth viewing angles , where corresponds to the edge-on view. In Fig. 2, we can see that a larger viewing angle is preferred. This can explain the presence of extensive radio eclipse and the X-ray orbital modulation caused by the Doppler boosting effect. Since the current errors of the optical data are huge, high signal-to-noise optical observations will be required to tightly constrain the viewing geometry.
| PSR | |||||||
|---|---|---|---|---|---|---|---|
| (ms) | () | (day) | (cm) | (cm) | |||
| J1023+0038 | 1.7 | 5 | 0.2 | 0.2 | 1.2 | 2.7 | 0.8 |
| J1628-32 | 3.2 | 2 | 0.21 | 0.16 | 1.2 | 2.6 | 1.2 |
| J1723-2837 | 1.9 | 5 | 0.62 | 0.4 | 2.6 | 7.2 | 6.3 |
| J1816+4510 | 3.2 | 5 | 0.36 | 0.16 | 1.7 | 3.7 | 0.4 |
| J2215+5135 | 2.6 | 6 | 0.18 | 0.22 | 1.1 | 2.5 | 0.9 |
| J2129-0429 | 7.6 | 4 | 0.63 | 0.37 | 2.6 | 7.1 | 6.4 |
| J2339-0533 | 2.3 | 2 | 0.2 | 0.075 | 1.1 | 1.9 | 0.1 |
References
- (1) Abdo, A. A., Ackermann, M., Ajello, M., et al. 2009, Science, 325, 848
- (2) Bellm, E., et al. 2013, American Astronomical Society, AAS Meeting #221, #154.10
- (3) Frank, Juhan; King, Andrew; Raine, Derek J., 2002, “Accretion Power in Astrophysics” ISBN 0521620538. Cambridge, UK: Cambridge University Press
- (4) Hessels, J. W. T., et al. 2011, RADIO PULSARS: AN ASTROPHYSICAL KEY TO UNLOCK THE SECRETS OF THE UNIVERSE. AIP Conference Proceedings, Volume 1357, pp. 40-43 (2011)
- (5) Huang, R. H. H., et al. 2012, ApJ, 760, 92
- (6) Hui, C. Y. et al. 2015, submitted to ApJ
- (7) Hui, C. Y. 2014 JASS, 31, 101
- (8) Hui, C. Y. et al. 2014, 781, L21
- (9) Kong, A. K. H. et al. 2014, ApJ, 794, L22
- (10) Kong, A. K. H. et al. 2012, ApJ, 747, L3
- (11) Li, K. L. et al. 2014, ApJ, 797, 111
- (12) Linares, M. 2014, ApJ, 795, 72
- (13) Lucy, L. B., 1967, ZA, 65, 89
- Mattox et al. (1996) Mattox, J. R., Bertsch, D. L., Chiang, J., et al. 1996, ApJ, 461, 396
- Nolan et al. (2012) Nolan, P. L., Abdo, A. A., Ackermann, M., et al. 2012, ApJS, 199, 31
- (16) Ray, P. S., et al. 2012, Fermi Symposium proceedings - eConf C110509 arXiv:1205.3089
- (17) Roberts, M. S. E. 2014, Proceedings of the Fifth International Fermi Symposium
- (18) Roberts, M. S. E. 2013, Proceedings of the International Astronomical Union, Volume 291, pp. 127-132
- (19) Romani, R.W., & Shaw, M.S. 2011, ApJL, 743, 26
- (20) Takata, J., et al. 2014, ApJ, 785, 131
- (21) Takata, J.; Cheng, K. S.; Taam, Ronald E., 2012, ApJ, 745, 100
- (22) Takata, J.; Cheng, K. S.; Taam, Ronald E., 2010, ApJ, 723, L68
- (23) Thorstensen, J. R., & Armstrong, E. 2005, AJ, 130, 759
- (24) van Hamme, W., 1993, AJ , 106, 2096