Pressure-Induced Antiferromagnetic Transition and Phase Diagram in FeSe
Abstract
We report measurements of resistance and ac magnetic susceptibility on FeSe single crystals under high pressure up to 27.2 kbar. The structural phase transition is quickly suppressed with pressure, and the associated anomaly is not seen above 18 kbar. The superconducting transition temperature evolves nonmonotonically with pressure, showing a minimum at kbar. We find another anomaly at 21.2 K at 11.6 kbar. This anomaly most likely corresponds to the antiferromagnetic phase transition found in SR measurements [M. Bendele et al., Phys. Rev. Lett. 104, 087003 (2010)]. The antiferromagnetic and superconducting transition temperatures both increase with pressure up to kbar and then level off. The width of the superconducting transition anomalously broadens in the pressure range where the antiferromagnetism coexists.
The superconductivity in FeSe has attracted growing attention since its discovery.Hsu et al. (2008) FeSe is unique among iron-based superconductors. In contrast to the iron-pnictide parent compounds such as LaFeAsO (Ref. Kamihara et al., 2008) and BaFe2As2,Rotter et al. (2008) FeSe undergoes a structural transition at K but no magnetic transition at ambient pressure. It becomes superconducting below K.Hsu et al. (2008) The transition temperature can be enhanced substantially by the application of pressure,Mizuguchi et al. (2008) the superconducting onset temperature reaching K at kbar.Medvedev et al. (2009) Moreover, single-layer FeSe films may have still higher transition temperatures.Wang et al. (2012) Recent breakthroughs in the crystal growth (Refs. Chareev et al., 2013; Böhmer et al., 2013) have led to a flurry of research activities, revealing more and more peculiarities of FeSe.Maletz et al. (2014); Shimojima et al. (2014); Huynh et al. (2014); Terashima et al. (2014); Kasahara et al. (2014); Baek et al. (2014); Nakayama et al. (2014); Böhmer et al. (2015); Audouard et al. (2015) Quantum oscillation and angle-resolved photoemission spectroscopy (ARPES) measurements have found an unexpectedly shrunk Fermi surface.Maletz et al. (2014); Terashima et al. (2014) Some other ARPES measurements have found a splitting of the and bands below ,Shimojima et al. (2014); Nakayama et al. (2014) suggesting that the structural transition is an electronic nematic order driven by orbital degrees of freedom, which is in accord with a conclusion from thermodynamic and NMR measurements.Böhmer et al. (2013); Baek et al. (2014); Böhmer et al. (2015) Thermal conductivity measurements have found a phase transition within the superconducting phase.Kasahara et al. (2014) It has also been argued that because of small Fermi energies the superconductivity in FeSe may be close to a Bardeen-Cooper-Schrieffer (BCS)–Bose-Einstein-condensation (BEC) crossover.Kasahara et al. (2014)
The absence of the antiferromagnetic order at ambient pressure may be at the heart of the FeSe enigma. Recent theoretical studies have suggested that the absence is due to the competition between spin fluctuations with different wave vectors.Lischner et al. (2015); Glasbrenner et al. (2015) Experimentally, a pressure-induced antiferromagnetic order was already suggested by early NMR measurements (Ref. Imai et al., 2009) and has been confirmed by recent SR measurements.Bendele et al. (2010, 2012) However, there is so far hardly any evidence from macroscopic measurements such as resistivity or magnetization under high pressure Mizuguchi et al. (2008); Braithwaite et al. (2009); Masaki et al. (2009); Medvedev et al. (2009); Margadonna et al. (2009); Miyoshi et al. (2009); Okabe et al. (2010); Miyoshi et al. (2014): for the pressure range of the present study, only Ref. Masaki et al., 2009 observed kinks in the temperature dependence of resistivity of polycrystalline samples at pressures above 28.5 kbar and speculated that they might be of a magnetic origin. In addition, to our knowledge, no previous studies observed both of the structural and antiferromagnetic transitions in the same sample under high pressure.
In this paper, we report resistance and ac magnetic susceptibility measurements on FeSe under high pressure up to = 27.2 kbar. Our resistance measurements clearly show anomalies that are most likely associated with the antiferromagnetic transition. This corroborates the appearance of a static long-range order under high pressure. We construct a phase diagram composed of the three phase transitions, i.e., the superconducting, antiferromagnetic, and structural ones, which displays an intriguing interplay between those orders.
We performed four-contact electrical resistance measurements on high-quality single crystals of FeSe prepared by a chemical vapor transport method (Ref. Böhmer et al., 2013) down to helium temperatures at pressures up to 27.2 kbar. The electrical contacts were spot-welded. The low-frequency ac current ( = 13 Hz) was applied in the plane. The current density was roughly in a range 6 – 8 A/cm2. Piston-cylinder type pressure cells made of NiCrAl alloy (C&T Factory, Tokyo) were used.Uwatoko et al. (2002) The pressure transmitting medium was Daphne 7474 (Idemitsu Kosan, Tokyo), which remains liquid up to 37 kbar at room temperature and assures highly hydrostatic pressure generation in the investigated pressure range.Murata et al. (2008) The pressure was determined from the resistance variation of calibrated manganin wires. We also performed ac magnetic susceptibility measurements under high pressure, where the ac excitation field ( T, = 67 Hz) was applied approximately parallel to the plane.
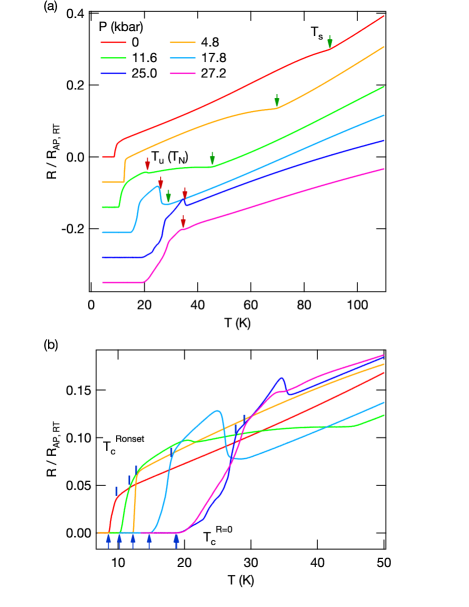
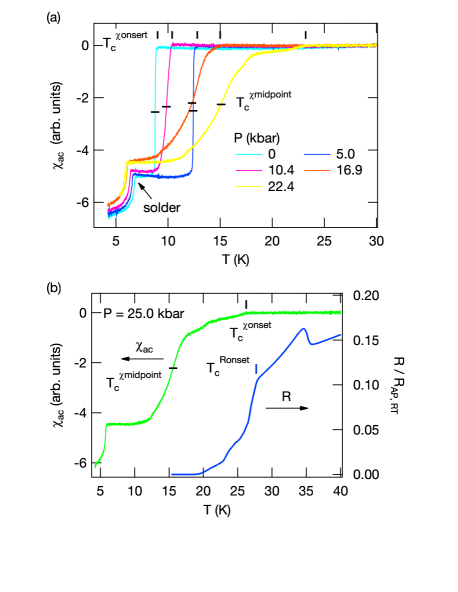
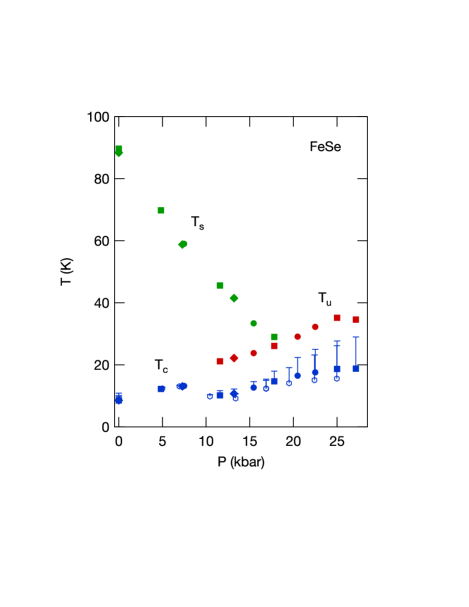
Figure 1 shows selected temperature dependences of resistance. At ambient pressure ( = 0 kbar), the anomaly associated with the structural phase transition is seen at = 89.7 K [green down-pointing arrow in (a)]. The transition temperature is rapidly suppressed as pressure is applied, reaching = 29.0 K at = 17.8 kbar. The anomaly is no longer seen above this pressure. Another anomaly appears at = 21.2 K at = 11.6 kbar [red down-pointing arrow in (a), also see (b)]. The anomaly is much clearer at = 17.8 kbar. The transition temperature increases with pressure up to 25.0 kbar, but appears to decrease slightly at = 27.2 kbar, the highest pressure of the experiment. Although the resistance increase at is fairly sudden, no clear hysteresis was found: the hysteresis width, if any, would be very small, less than 0.1 K. The superconducting transition temperature [zero-resistance criterion, up-pointing arrows in (b)] initially increases from = 8.6 K at = 0 kbar to 12.2 K at = 4.8 kbar (d/d = 0.76 K/kbar), and the transition becomes sharper. The transition temperature, however, decreases to 10.2 K at = 11.6 kbar, and the transition becomes broader. As pressure is increased further, the transition temperature increases again, but the transition width broadens further. For the evaluation of the transition width, we have defined the onset temperature as a temperature where d/d shows a negative peak [short vertical bars in (b)]. Between the two highest pressures, 25.0 and 27.2 kbar, the zero-resistance temperatures are nearly the same, though the onset temperature still shows an increase. Resistance measurements performed on two more samples gave similar observations.
Figure 2(a) shows selected temperature dependences of ac magnetic susceptibility. Note that the anomalies at about 6 – 7 K are due to the superconducting transition of solder used for wiring. As pressure is applied, the superconducting transition temperature (onset criterion, indicated by vertical bars) initially increases from 9 K at = 0 kbar to 12.8 K at 5.0 kbar, but decreases to 10.4 K at 10.4 kbar, where the transition is broader. As pressure is further increased, increases again, but the transition broadens further. At = 22.4 kbar, the diamagnetism appears at = 23.2 K but remains weak until 18 K, below which it grows faster. Figure 2(b) compares the temperature dependences of ac magnetic susceptibility and resistance at = 25.0 kbar. The diamagnetism appears at = 26.2 K, which is close to the onset temperature of the resistance drop = 27.7 K, though most of the growth of the diamagnetism occurs below the zero-resistance temperature = 18.7 K. Considering the broad transitions at high pressures, we have also defined the transition midpoints (horizontal bars in Fig. 2), which might serve as a better index of the bulk transition temperature. We note that the size of the diamagnetic signal remains nearly the same as pressure is applied, indicating bulk superconductivity up to the highest pressure of 25.0 kbar. We did not detect anomalies corresponding to or , most likely because of the low sensitivity of the present setup.
Figure 3 shows the high-pressure phase diagram of FeSe determined from the present measurements. The superconducting transition temperature initially increases, but decreases above 8 kbar and then increases again, resulting in a local minimum at 12 kbar. This is fully consistent with previous reports.Bendele et al. (2010, 2012); Miyoshi et al. (2014) Furthermore, the observation that the superconducting volume fraction hardly changes in the investigated pressure range is also consistent with those reports. The structural transition temperature is quickly suppressed by the application of pressure. This is consistent with a previous report,Miyoshi et al. (2014) though the suppression rate observed in the present study is faster. The fate of the structural transition above = 17.8 kbar is not clear and will be discussed later.
The resistance anomaly at probably corresponds to the antiferromagnetic order observed in the high-pressure SR study.Bendele et al. (2010, 2012) According to Bendele et al.,Bendele et al. (2010, 2012) a finite magnetic volume fraction appears at = 8 kbar with = 17 K, but it does not reach 100% as at this pressure. As pressure is increased above 8 kbar, the magnetic volume fraction and increase while decreases. At 12 kbar, the volume fraction reaches 100% (as ) and reaches a local minimum. Above 12 kbar, both and increase with pressure up to 24 kbar, the highest pressure of Ref. Bendele et al., 2012. The reported behavior of is basically consistent with the behavior of observed in the present study. The increase in the resistance at indicates that the Fermi surface is partially gapped by the antiferromagnetic order. The quantitative agreement between and is however not very good: = 55 K at = 24 kbar (Ref. Bendele et al., 2012) vs. = 35.2 K at 25.0 kbar. We note that in Refs. Bendele et al., 2010, 2012 is defined as the temperature where the magnetic volume fraction becomes nonzero. However, the volume fraction increases rather slowly with decreasing temperature: e.g. the magnetic volume fraction at = 24 kbar reaches 100% only below 30 K. This indicates that in the sample of Ref. Bendele et al., 2012 is distributed between 55 and 30 K, which may explain the discrepancy between the reported and the present . The present , especially above 15 kbar, is close to the temperature where the volume fraction reaches 70% in Ref. Bendele et al., 2012: the 70% line starts at 12 kbar at = 0 and reaches 35 K at 24 kbar.
Interestingly, the pressure dependence of and that of are roughly parallel: both transition temperatures increase with pressure from 12 to 25 kbar and then approximately level off. This is very different from behavior expected in usual quantum-critical-point (QCP) scenarios, which assume that the superconducting dome is centered at the QCP, i.e., is maximum at the QCP. It would be helpful to extend the pressure range to see how and evolve above 27 kbar. It would also be interesting to see how theories claiming competition between different spin fluctuations in FeSe could explain our observation.Lischner et al. (2015); Glasbrenner et al. (2015)
The width of the superconducting transition considerably broadens as increases with pressure. At high pressures, the onset of diamagnetism approximately coincides with the onset of resistance drop [Figs. 2(b) and 3]. This is quite unusual. Usually the diamagnetism develops after the zero resistance is achieved, since the zero resistance requires only a one-dimensional current path, which can be as thin as possible, but for the diamagnetism to be observed some volume must be shielded. In the present case, isolated superconducting regions appear below but their connections are prevented by some reason until the temperature becomes much lower than . This likely reflects the competition between the superconductivity and magnetism despite the simultaneous increase of and . It is interesting to note that a similar observation has been reported for FeSe thin films: the onset of the diamagnetism approximately coincides with the onset of the resistance drop for three and four unit-cell films, for which K.Deng et al. (2014) ARPES papers suggest that FeSe thin films may order antiferromagnetically with K.Tan et al. (2013); He et al. (2013)
Finally, we ask what is the fate of the structural transition above = 17.8 kbar. High-pressure structural studies suggest that the low temperature structure remains orthorhombic up to 75 kbar.Margadonna et al. (2009); Kumar et al. (2010); Uhoya et al. (2012) One scenario compatible with this is as follows: The transition line merges with the line at some pressure, above which a stripe-type antiferromagnetic order and orthorhombic distortion occur simultaneously at , as is the case with BaFe2As2, for example. On the other hand, those structural data were obtained for mixed-phase samples and might not reflect the intrinsic phase diagram.Margadonna et al. (2009); Kumar et al. (2010); Uhoya et al. (2012) Thus the following scenario, among others, is also worthy of consideration: The structural transition temperature is suppressed down to zero (continuously or in a first-order fashion) at some pressure, above which the structure remains tetragonal as . We note that the line shows no clear kink marking the point where the and transition lines meet. This might suggest that the two orders are rather decoupled, as has been suggested by ambient-pressure studies,Böhmer et al. (2013); Baek et al. (2014); Böhmer et al. (2015) and hence might support this scenario. In this case, the antiferromagnetic order would not be a stripe-type one but would have to be compatible with the tetragonal structure as has been suggested in Ref. Böhmer et al., 2015. Although Ref. Bendele et al., 2012 proposes stripe-type antiferromagnetic ordering under high pressure based on the SR data, neutron diffraction measurements have failed to confirm it. Clearly, high-pressure structural measurements on high-quality single crystals are desired.
In summary, we have found an anomaly most likely corresponding to the pressure-induced antiferromagnetic transition in our resistance measurements on FeSe. No clear hysteresis associated with this anomaly was observed. The obtained phase diagram shows intriguing relations between the three orders: The antiferromagnetic and superconducting transition temperatures show analogous pressure dependences as if the two orders are cooperative. Nevertheless, the superconducting transition width broadens in the pressure region where the antiferromagnetism coexists as if the two orders compete. The structural transition line almost meets the antiferromagnetic one at 17.8 kbar, the highest pressure where the transition was observed. The antiferromagnetic transition line smoothly evolves in the neighboring pressure range, which might suggest that the two orders are fairly independent of each other. The fate of the structural transition above this pressure deserves further investigations.
Acknowledgements.
This work has been supported by Japan-Germany Research Cooperative Program, KAKENHI from JSPS, Project No. 56393598 from DAAD, the Topological Quantum Phenomena (No. 25103713) KAKENHI on Innovative Areas from MEXT of Japan, and JSPS KAKENHI Grant Number 26400373.References
- Hsu et al. (2008) F.-C. Hsu, J.-Y. Luo, K.-W. Yeh, T.-K. Chen, T.-W. Huang, P. M. Wu, Y.-C. Lee, Y.-L. Huang, Y.-Y. Chu, D.-C. Yan, and M.-K. Wu, Proc. Nat. Acad. Sci. U. S. A. 105, 14262 (2008).
- Kamihara et al. (2008) Y. Kamihara, T. Watanabe, M. Hirano, and H. Hosono, J. Am. Chem. Soc. 130, 3296 (2008).
- Rotter et al. (2008) M. Rotter, M. Tegel, D. Johrendt, I. Schellenberg, W. Hermes, and R. Pöttgen, Phys. Rev. B 78, 020503 (2008).
- Mizuguchi et al. (2008) Y. Mizuguchi, F. Tomioka, S. Tsuda, T. Yamaguchi, and Y. Takano, Appl. Phys. Lett. 93, 152505 (2008).
- Medvedev et al. (2009) S. Medvedev, T. M. McQueen, I. A. Troyan, T. Palasyuk, M. I. Eremets, R. J. Cava, S. Naghavi, F. Casper, V. Ksenofontov, G. Wortmann, and C. Felser, Nat. Mater. 8, 630 (2009).
- Wang et al. (2012) Q.-Y. Wang, Z. Li, W.-H. Zhang, Z.-C. Zhang, J.-S. Zhang, W. Li, H. Ding, Y.-B. Ou, P. Deng, K. Chang, J. Wen, C.-L. Song, K. He, J.-F. Jia, S.-H. Ji, Y.-Y. Wang, L.-L. Wang, X. Chen, X.-C. Ma, and Q.-K. Xue, Chin. Phys. Lett. 29, 037402 (2012).
- Chareev et al. (2013) D. Chareev, E. Osadchii, T. Kuzmicheva, J.-Y. Lin, S. Kuzmichev, O. Volkova, and A. Vasiliev, CrystEngComm 15, 1989 (2013).
- Böhmer et al. (2013) A. E. Böhmer, F. Hardy, F. Eilers, D. Ernst, P. Adelmann, P. Schweiss, T. Wolf, and C. Meingast, Phys. Rev. B 87, 180505 (2013).
- Maletz et al. (2014) J. Maletz, V. B. Zabolotnyy, D. V. Evtushinsky, S. Thirupathaiah, A. U. B. Wolter, L. Harnagea, A. N. Yaresko, A. N. Vasiliev, D. A. Chareev, A. E. Böhmer, F. Hardy, T. Wolf, C. Meingast, E. D. L. Rienks, B. Büchner, and S. V. Borisenko, Phys. Rev. B 89, 220506 (2014).
- Shimojima et al. (2014) T. Shimojima, Y. Suzuki, T. Sonobe, A. Nakamura, M. Sakano, J. Omachi, K. Yoshioka, M. Kuwata-Gonokami, K. Ono, H. Kumigashira, A. E. Böhmer, F. Hardy, T. Wolf, C. Meingast, H. v. Löhneysen, H. Ikeda, and K. Ishizaka, Phys. Rev. B 90, 121111 (2014).
- Huynh et al. (2014) K. K. Huynh, Y. Tanabe, T. Urata, H. Oguro, S. Heguri, K. Watanabe, and K. Tanigaki, Phys. Rev. B 90, 144516 (2014).
- Terashima et al. (2014) T. Terashima, N. Kikugawa, A. Kiswandhi, E.-S. Choi, J. S. Brooks, S. Kasahara, T. Watashige, H. Ikeda, T. Shibauchi, Y. Matsuda, T. Wolf, A. E. Böhmer, F. Hardy, C. Meingast, H. v. Löhneysen, M.-T. Suzuki, R. Arita, and S. Uji, Phys. Rev. B 90, 144517 (2014).
- Kasahara et al. (2014) S. Kasahara, T. Watashige, T. Hanaguri, Y. Kohsaka, T. Yamashita, Y. Shimoyama, Y. Mizukami, R. Endo, H. Ikeda, K. Aoyama, T. Terashima, S. Uji, T. Wolf, H. von Löhneysen, T. Shibauchi, and Y. Matsuda, Proc. Natl. Acad. Sci. USA 111, 16309 (2014).
- Baek et al. (2014) S.-H. Baek, D. V. Efremov, J. M. Ok, J. S. Kim, J. van den Brink, and B. Büchner, Nat. Mater. 14, 210 (2014).
- Nakayama et al. (2014) K. Nakayama, Y. Miyata, G. N. Phan, T. Sato, Y. Tanabe, T. Urata, K. Tanigaki, and T. Takahashi, Phys. Rev. Lett. 113, 237001 (2014).
- Böhmer et al. (2015) A. E. Böhmer, T. Arai, F. Hardy, T. Hattori, T. Iye, T. Wolf, H. v. Löhneysen, K. Ishida, and C. Meingast, Phys. Rev. Lett. 114, 027001 (2015).
- Audouard et al. (2015) A. Audouard, F. Duc, L. Drigo, P. Toulemonde, S. Karlsson, P. Strobel, and A. Sulpice, EPL 109, 27003 (2015).
- Lischner et al. (2015) J. Lischner, T. Bazhirov, A. H. MacDonald, M. L. Cohen, and S. G. Louie, Phys. Rev. B 91, 020502 (2015).
- Glasbrenner et al. (2015) J. K. Glasbrenner, I. I. Mazin, H. O. Jeschke, P. J. Hirschfeld, and R. Valentí, arXiv:1501.04946 (2015), unpublished.
- Imai et al. (2009) T. Imai, K. Ahilan, F. L. Ning, T. M. McQueen, and R. J. Cava, Phys. Rev. Lett. 102, 177005 (2009).
- Bendele et al. (2010) M. Bendele, A. Amato, K. Conder, M. Elender, H. Keller, H.-H. Klauss, H. Luetkens, E. Pomjakushina, A. Raselli, and R. Khasanov, Phys. Rev. Lett. 104, 087003 (2010).
- Bendele et al. (2012) M. Bendele, A. Ichsanow, Y. Pashkevich, L. Keller, T. Strässle, A. Gusev, E. Pomjakushina, K. Conder, R. Khasanov, and H. Keller, Phys. Rev. B 85, 064517 (2012).
- Braithwaite et al. (2009) D. Braithwaite, B. Salce, G. Lapertot, F. Bourdarot, C. Marin, D. Aoki, and M. Hanfland, J. Phys.: Condens. Matter 21, 232202 (2009).
- Masaki et al. (2009) S. Masaki, H. Kotegawa, Y. Hara, H. Tou, K. Murata, Y. Mizuguchi, and Y. Takano, J. Phys. Soc. Jpn. 78, 063704 (2009).
- Margadonna et al. (2009) S. Margadonna, Y. Takabayashi, Y. Ohishi, Y. Mizuguchi, Y. Takano, T. Kagayama, T. Nakagawa, M. Takata, and K. Prassides, Phys. Rev. B 80, 064506 (2009).
- Miyoshi et al. (2009) K. Miyoshi, Y. Takaichi, E. Mutou, K. Fujiwara, and J. Takeuchi, J. Phys. Soc. Jpn. 78, 093703 (2009).
- Okabe et al. (2010) H. Okabe, N. Takeshita, K. Horigane, T. Muranaka, and J. Akimitsu, Phys. Rev. B 81, 205119 (2010).
- Miyoshi et al. (2014) K. Miyoshi, K. Morishita, E. Mutou, M. Kondo, O. Seida, K. Fujiwara, J. Takeuchi, and S. Nishigori, J. Phys. Soc. Jpn. 83, 013702 (2014).
- Uwatoko et al. (2002) Y. Uwatoko, S. Todo, K. Ueda, A. Uchida, M. Kosaka, N. Mori, and T. Matsumoto, J. Phys.: Condens. Matter 14, 11291 (2002).
- Murata et al. (2008) K. Murata, K. Yokogawa, H. Yoshino, S. Klotz, P. Munsch, A. Irizawa, M. Nishiyama, K. Iizuka, T. Nanba, T. Okada, Y. Shiraga, and S. Aoyama, Rev. Sci. Instrum. 79, 085101 (2008).
- Deng et al. (2014) L. Z. Deng, B. Lv, Z. Wu, Y. Y. Xue, W. H. Zhang, F. S. Li, L. L. Wang, X. C. Ma, Q. K. Xue, and C. W. Chu, Phys. Rev. B 90, 214513 (2014).
- Tan et al. (2013) S. Tan, Y. Zhang, M. Xia, Z. Ye, , F. Chen, X. Xie, R. Peng, D. Xu, H. X. Qin Fan, J. Jiang, T. Zhang, X. Lai, T. Xiang, J. Hu, B. Xie, and D. Feng, Nat. Mater. 12, 634 (2013).
- He et al. (2013) S. He, J. He, W. Zhang, L. Zhao, D. Liu, X. Liu, D. Mou, Y.-B. Ou, Q.-Y. Wang, , Z. Li, L. Wang, Y. Peng, Y. Liu, C. Chen, L. Yu, G. Liu, X. Dong, J. Zhang, C. Chen, Z. Xu, X. Chen, X. Ma, Q. Xue, and X. J. Zhou, Nat. Mater. 12, 605 (2013).
- Kumar et al. (2010) R. S. Kumar, Y. Zhang, S. Sinogeikin, Y. Xiao, S. Kumar, P. Chow, A. L. Cornelius, and C. Chen, J. Phys. Chem. B 114, 12597 (2010).
- Uhoya et al. (2012) W. Uhoya, G. Tsoi, Y. Vohra, N. Wolanyk, S. M. Rao, M.-K. Wu, and S. Weir, EPL 99, 26002 (2012).