Reducing DRIFT Backgrounds with a Submicron Aluminized-Mylar Cathode
Abstract
††Background events in the DRIFT-IId dark matter detector, mimicking potential WIMP signals, are predominantly caused by alpha decays on the central cathode in which the alpha particle is completely or partially absorbed by the cathode material. We installed a 0.9 thick aluminized-mylar cathode as a way to reduce the probability of producing these backgrounds. We study three generations of cathode (wire, thin-film, and radiologically clean thin-film) with a focus on the ratio of background events to alpha decays. Two independent methods of measuring the absolute alpha decay rate are used to ensure an accurate result, and agree to within . Using alpha range spectroscopy, we measure the radiologically cleanest cathode version to have a contamination of ppt 234U and ppb 238U. This cathode reduces the probability of producing an RPR from an alpha decay by a factor of compared to the original stainless steel wire cathode. First results are presented from a texturized version of the cathode, intended to be even more transparent to alpha particles. These efforts, along with other background reduction measures, have resulted in a drop in the observed background rate from 500/day to 1/day. With the recent implementation of full-volume fiducialization, these remaining background events are identified, allowing for background-free operation.
keywords:
DRIFT, NITPC, WIMP, Dark Matter, Radon, Uranium1 Introduction
The properties of dark matter continue to be among the greatest outstanding mysteries in cosmology and particle physics. The evidence for non-Baryonic dark matter is extensive [1], and a Weakly Interacting Massive Particle (WIMP) is a well-motivated candidate [2]. A convincing direct detection, which would both conclusively confirm the existence of WIMP dark matter and provide valuable information about its properties, proves to be elusive. Some recent [3] and older [4] experimental results are suggestive of dark matter-like signals. These signals, despite being consistent with dark matter, have been called into question, demonstrating the need for a more convincing dark matter signature such as the sidereal modulation of the direction of incoming WIMP particles [5, 6]. The Directional Recoil Identification From Tracks (DRIFT) dark matter experiment is the world’s leading directional dark matter detector and is designed to provide an unambiguous detection of dark matter. DRIFT has demonstrated directionality down to 40 keVr [7, 8] and set a spin-dependent limit (WIMP on proton) of 1.1 pb for a 100 GeV/c2 WIMP [9]. The main challenge for DRIFT over the past 8 years has been radon progeny recoils (RPRs) from the central cathode, which have resulted in background rates as large as 500 events/day [10].
Two major advances have eliminated these backgrounds, resulting in essentially background-free operation for DRIFT. The first advance has been the development of a thin film cathode that has contributed to a two-order-of-magnitude reduction in the background rate. The backgrounds and their reduction by the thin film cathode is the subject of this work. The second was the discovery of a method for fiducialization along the drift direction [11], which enabled events near the cathode to be excluded as dark matter candidates. This method was implemented underground in the DRIFT-IId detector and demonstrated to work [12, 9].
This paper begins with a description of the DRIFT detector (Section 2) and how alpha-decays at the cathode produce dark matter backgrounds in DRIFT. This will be followed (Section 3) by a description of the analysis techniques based on alpha range spectroscopy that identify both the isotopes and their location. This analysis was a critical tool in providing quantitative feedback on the efficacy of the different versions of the thin film cathode in reducing the backgrounds. Section 4 shows how the thin film cathode is expected to reduce the backgrounds in DRIFT-IId. These analysis tools were used to measure the radioactive contamination of the thin-film central cathode down to the ppt level (Section 5) and use this information to build a newer, cleaner version (Section 6). Finally, we quantify improvements made by two versions of the thin film cathode, which has culminated in a background rate of event/day.
2 The DRIFT-IId Detector
The DRIFT-IId Dark Matter detector is a 1 m3 negative-ion time projection chamber (NITPC) which, while collecting data presented here, operated at a pressure of 40 Torr [13]. The bulk of the gas was 30 Torr of CS2, an electronegative gas which captures ionized electrons, producing negative ions [14]. These negative ions drift times slower than electrons and with minimum (at the thermal limit) diffusion [15, 16]. The remaining 10 Torr of gas was CF4, chosen for its high content of 19F providing spin-dependent sensitivity [17].
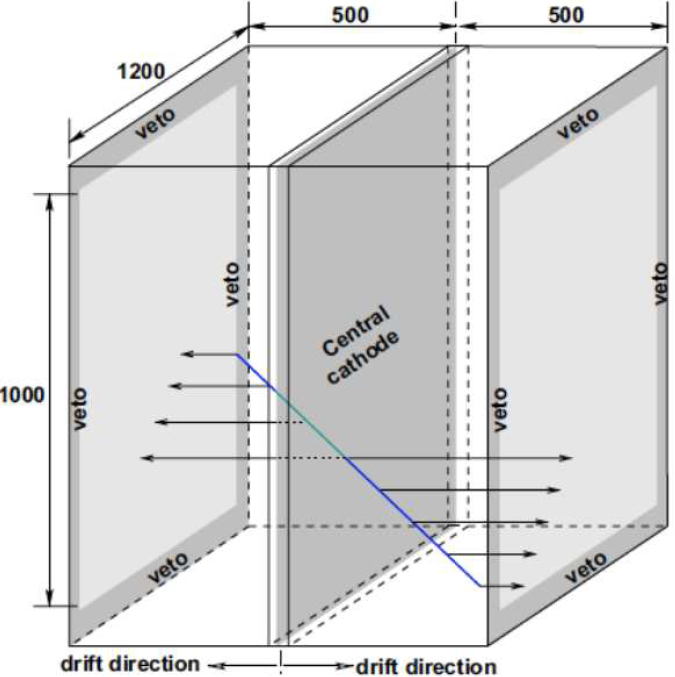

The DRIFT-IId detector (Figure 1) contains two 50-cm deep detection volumes that share a single central cathode plane. During the data collection runs analyzed in this document, the cathode plane was at -30242 V which, together with a wire field cage, defines a uniform drift field of E=550 V/cm in each volume. Each volume was terminated by a 1 m2 Multi-Wire Proportional Chamber (MWPC) which is comprised of three parallel planes separated by 1 cm. The middle anode plane was originally built from stainless steel wires at ground potential. The two outer grid planes use wires oriented perpendicular to the anodes and held at -2731 V. This voltage difference provides gas amplification with a gain of .
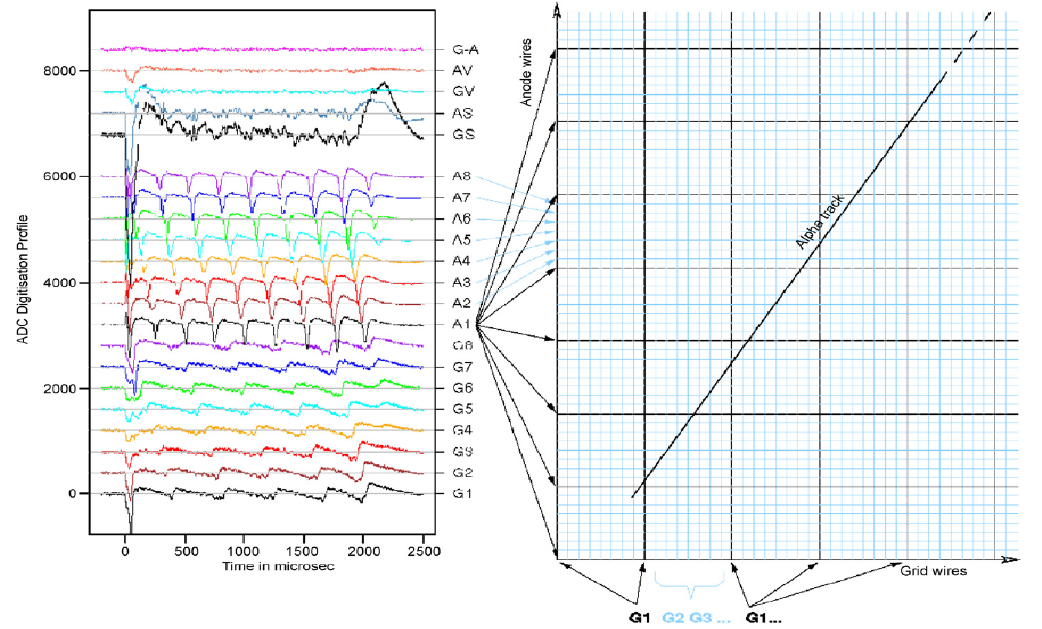
Each of these planes has 552 wires with a pitch of 2 mm. The outermost 52 (41) wires of the anode (grid) are used to identify and veto events entering the fiducial volume of the detector from the outside. The remaining 448 (459) wires in each plane, spanning a 896 mm (918 mm) fiducial length, are grouped into 8 channels such that every eighth wire is read out by the same channel; this introduces a periodicity of 16 mm in the readouts. This does not affect the WIMP search as the low energy nuclear recoils of interest have tracks that are typically less than 5 mm long. This periodicity can be seen in longer tracks, such as those from alpha particles or protons, as seen in Figure 2. The 8 anode channels measure the track along the axis while the perpendicular grid channels measure the extent of a track. The component of the length is measured by the transit of charge into the MWPC at a known drift speed of m/s. The digitization rate of 1 MHz and fast electronics correspond to a sub-mm spatial resolution along the axis, so the measurement of the track along this axis is the most precise and accurate.
The detector is located in the Boulby Underground Laboratory, at 2805 m.w.e., to shield from cosmogenics [19]. It is further shielded from rock neutrons by polypropylene pellets providing at least 35 g cm-2 of hydrogenous shielding. This is expected to reduce backgrounds from rock neutrons to less than 1/year [10].
2.1 DRIFT Backgrounds and the Thin-Film Solution
The first studies of background events in DRIFT-II observed a prohibitively high rate of WIMP-like backgrounds; around 500/day [10]. These have been attributed primarily to Radon Progeny Recoils (RPRs) produced at the 20 stainless steel wires of the cathode used at the time. Production of an RPR often begins with the emanation of 222Rn inside the vacuum vessel. The 222Rn atom diffuses into the fiducial volume and decays, emitting a 5.49 MeV alpha particle and a 218Po atom which is typically positively charged (the charged fraction and its measurement is described in Section 5.1). While this initial alpha particle track is easily identified, it is the charged 218Po that has the potential to initiate the RPR backgrounds. After the 218Po drifts to and electrodeposits on the central cathode, it alpha-decays with a half-life of 3.05 minutes, emitting a 6.00 MeV alpha and a 112 keV 214Pb atom. Alpha particles of this energy have a range of 12.4 in stainless steel and, for isotropic decays, will range out in the 20 wire of the time. The lead atom, meanwhile, is ejected into the gas and produces an RPR background.
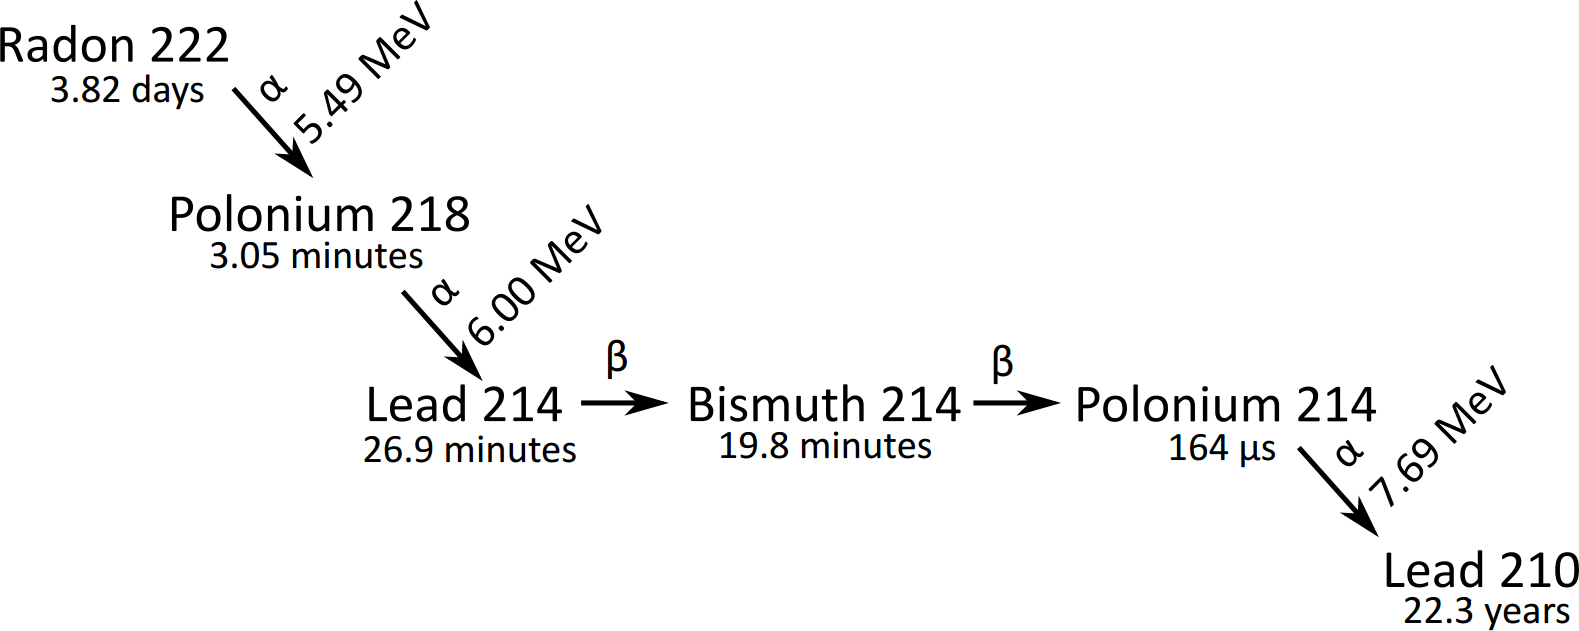
Two more RPRs are possible from the same 222Rn progenitor (see Figure 3). Over the course of an hour 214Pb undergoes two decays to become 214Po, which then alpha-decays into 210Pb and produces a 7.69 MeV alpha. This Pb atom, with a half-life of 22.3 years, may, over the life of the detector, decay by two emissions into 210Po which produces one final alpha decay. The resultant stable daughter of this chain is 206Pb. Thus, from the initial 222Rn, the 214Pb, 210Pb, and 206Pb all have potential to produce an RPR background from the central cathode of DRIFT-IId. While similar background-producing decay chains are possible from other radon isotopes (such as 220Rn), the majority of the alpha-producing radon progeny decays at the cathode are daughters of 222Rn [18], as will be shown in Section 3.111In 2007, a large population of 210Po (with a 22.2 year half-life) on the surface of the central cathode wires contributed significantly to the background rate in DRIFT-IId. This population is not present on more recent cathodes, and the long half-life of the decay limits the impact of its buildup from radon decays in the volume [20].
The RPR hypothesis is now supported by a wealth of data. These background events have been observed to suffer more longitudinal diffusion than neutron-induced nuclear recoils in the bulk of the gas, which suggests that these events originate near the cathode (the maximal drift distance) [21]. Long-term background studies have revealed a correlation between the rates of 222Rn decays and background events in DRIFT-IId [20]. A nitric acid etch of the wire central cathode, to remove radon progeny and any other alpha decay contaminants from the surface, reduced the background rate [21], while a similar etch of the MWPCs had only a minor effect on the background rate [8, 20]. Finally, the discovery of minority carriers, which resulted in the ability to fiducialize events along the drift direction, has definitively shown that the RPRs occur at the cathode [12, 9].
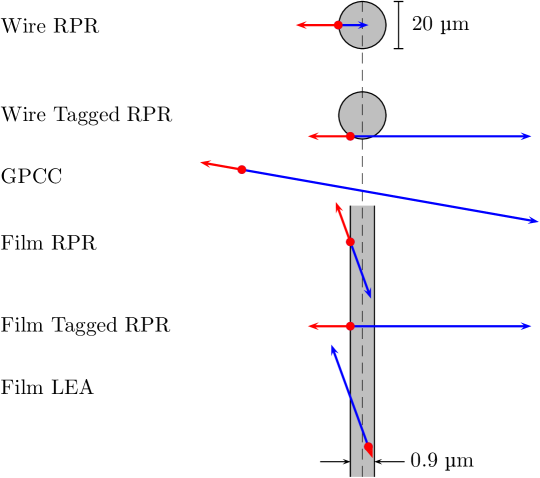
As shown in Figure 4, an RPR event at the cathode requires both that the alpha is fully absorbed in the cathode and that the Pb recoil enters and deposits a detectable amount of energy in the gas. Due to the short range ( Å)) of the Pb recoil in the cathode [22], the RPR must originate at or very near to the surface of the cathode. Given the double-sided chamber employed in DRIFT-IId, there are other event topologies possible due to alpha decays at or in the central cathode (see Figure 4). These will be discussed later (Sections 3 and 4.1), but it is important to mention the tagged RPR which is present in all DRIFT cathodes. This is identical to a regular RPR except that the alpha particle is also observed on the opposite side of the detector. The observation of the alpha particle track in coincidence with the RPR allows us to tag the RPR and exclude it as a WIMP candidate. Studying this and other classes of identifiable alpha decays at the central cathode provides useful information as described in the following sections.
The DRIFT collaboration has devised various strategies to mitigate and eliminate these background events. The first was to identify and replace radon-emanating materials with less radioactive ones. In addition, we performed a nitric etch of the wire cathode, which removed long-lived surface contaminants introduced in the manufacturing as well as accumulated 210Po [8]. This, together with the replacement of radon-emanating materials, reduced the background rate from 500/day to 130/day in 2009 [21]. Efforts to reduce the rate of radon emanation in DRIFT have continued, culminating in a factor of 10 reduction since 2005 [23].
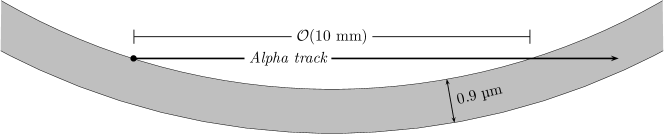
The strategy described in this work is the replacement of the wire central cathode with a 0.9 aluminized thin film that is nearly transparent to the alphas produced in the radon progeny decays. This greatly reduces the chance that an RPR at the cathode will go untagged by the coincident alpha produced in the decay. This cathode has provided a further factor of 30 reduction in the background rate, down to 1/day. With the z-fiducialization described above, the remaining RPRs are now identified and removed from the dark matter data, enabling DRIFT to operate with zero backgrounds while preserving a good nuclear recoil efficiency.
As we describe results from the various generations of cathodes it is useful to define a figure of merit for the cathode’s efficacy to reject alpha-decay backgrounds. Our definition is the ratio of observed background events at the cathode that are classified as nuclear recoils to the total number of alpha decays occurring on or in the cathode:
| (1) |
As more RPRs are tagged with alphas, this quantity will decrease indicating a reduction in backgrounds due to an improved cathode. This definition is insensitive to differences in the RPR rate due to radon emanation changes in the detector that occurred over the same time-scale as the cathode R&D. The numerator of this figure of merit, the measured backgrounds, is obtained from an independent nuclear recoil analysis similar to that presented in [21]. The results are in agreement, with the exception that a higher threshold is employed here to focus on backgrounds due to alpha decays. The region of interest used here is 1000-4000 NIPS (Number of Ion Pairs), calibrated against the 237 NIPS produced by a 5.9 keV X-ray from a 55Fe source [24].
To derive the total alpha decay rate for the denominator in the figure of merit, a knowledge of the detection efficiency for alphas in DRIFT is required to convert the observed alpha counts to an absolute number of decays. This is a new analysis that is central to this work, and is described in the next section. There we also show how DRIFT’s 3D alpha range measurements can be used to do spectroscopy that gives detailed information on the specific isotopes that are responsible for the backgrounds and their location.
3 Alpha Range Spectroscopy
Over the years, alphas have provided an excellent tool to study backgrounds in DRIFT [18]. Many radioactive contaminant decay chains, such as the 222Rn chain, provide identifiable alphas. Furthermore, as described above, DRIFT’s backgrounds come directly from alpha decays occurring on or in the central cathode. The basis of the alpha analysis to follow is the identification and measurement of alpha tracks in the DRIFT-IId detector. Alphas are used for spectroscopy based on their range rather than their energy. Alpha particle energy is difficult to measure with DRIFT’s readout scheme, which has been optimized for much shorter and less energetic nuclear recoil events.
For each event the eight anode lines on both sides of the detector are scanned for voltage excursions from ionization. A hit is the signal on an anode wire beginning when the signal last rose above 0 before reaching for at least and lasting until it once more crosses the baseline. The baseline gaussian noise, , is calculated independently for each of the 32 signal and 4 veto channels.
Within the detector volume, ionization resulting from an alpha particle track can reach up to 56 cm long and is typically much longer than the 2 mm anode wire separation. To compile the relevant hits from a single ionization event within DRIFT, we collect all hits on one side which overlap in time. This collection is a track and contains all of the data from one side of the detector corresponding to a single ionization event.
These tracks are analyzed to classify them into well-understood categories including nuclear recoils, electron recoils, sparks and, most relevant to this work, alphas. Any track long enough to produce 10 consecutive hits (2 cm in ), which does not reach a threshold of mV on either veto channel, and which does not cross the MWPC is classified as a contained alpha track. Events crossing an MWPC are identified by a sharp rise time as ionization is produced in the high-field region of the MWPC. If a track is otherwise contained but does cross the central cathode, appearing as an alpha track on each MWPC, then it is called a Gold-Plated Cathode Crosser (GPCC) as shown in Figure 4.
The length components along all three axes are measured for each alpha track. The length, along the drift direction, is calculated as , where is the time difference between the start of the first hit and the end of the last hit in the track. The drift speed, m/s, is measured in-situ by the timing of alpha particles from 214Po decays at the central cathode which cross an MWPC and are therefore known to travel exactly 500 mm in .
The length, perpendicular to the anode wires, is determined by multiplying the number of hits on the anode by the wire spacing, 2 mm. In a similar fashion the length, which is along the axis perpendicular to the grid wires, is measured by counting pulses on each wire and multiplying this sum by the wire spacing, which is again 2 mm. Here, a pulse is defined as a peak in the waveform extending forward and backward until the signal falls off by (, discussed above, is the gaussian noise on the channel). is used here to avoid induced signals from neighboring wires.
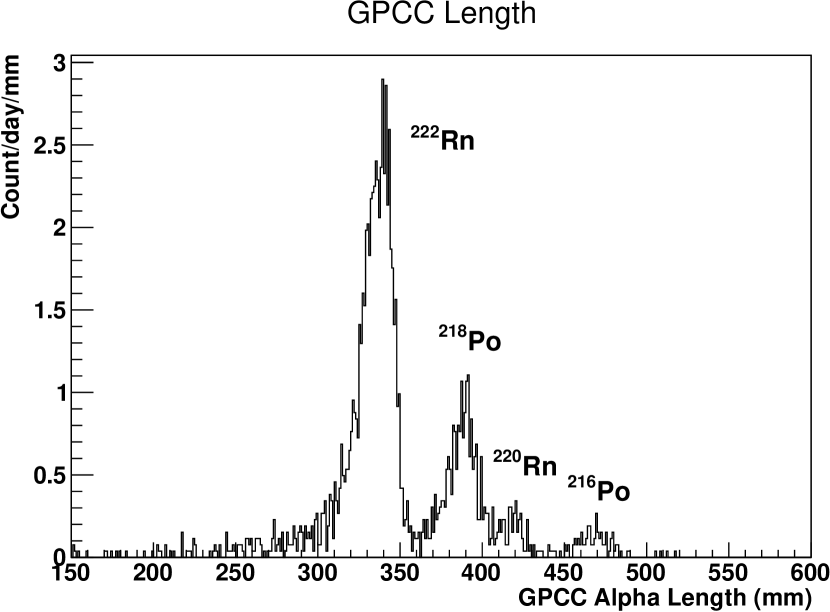
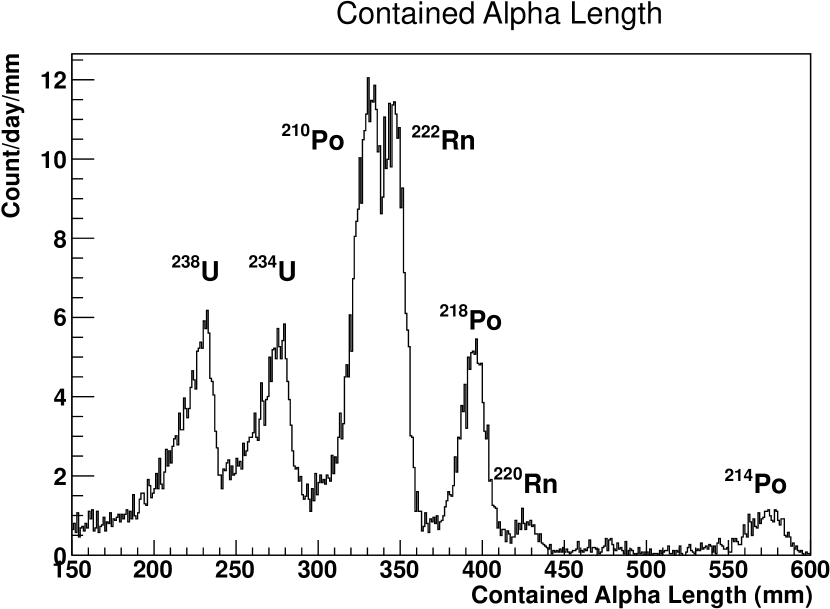
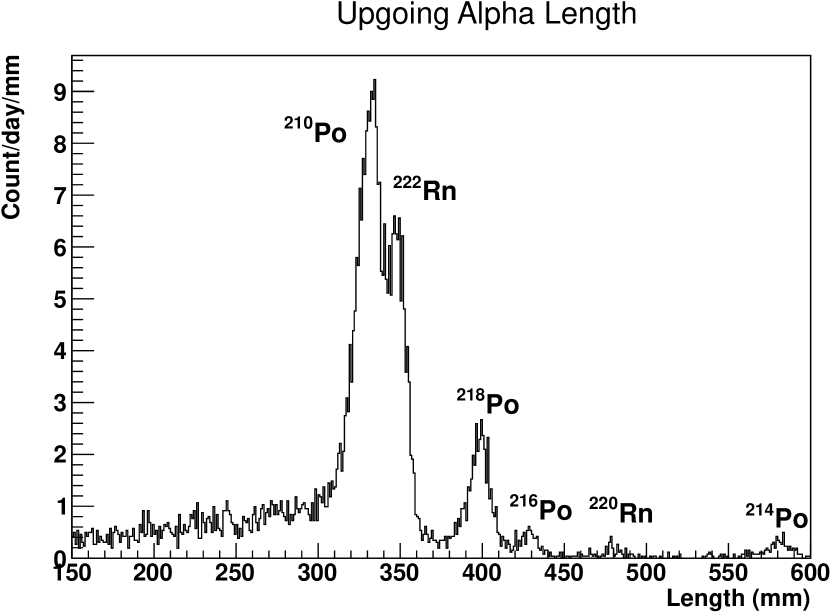
Using this measure of the alpha length along all three axes, we histogram the full 3-d lengths of both contained and GPCC alphas within the detector (see Figures 3-6). The spectrum of peaks in the histogram can be identified as decays from particular isotopes using the mean length of the alpha particle’s range, obtained from SRIM [22]. This technique can measure the 3D range of alpha particle tracks in the detector with resolution. Due to the overlapping nature of many of the populations, the number of observed decays is calculated by integrating over the best fit Crystal Ball function [25, 26, 27].222The long tail of the Crystal Ball function fits the range distribution from tracks which are partially absorbed by the thin-film cathode.
The GPCC events shown in Figure 3 are due to decays occurring in the gas and show that the radon diffusing into the fiducial volume of DRIFT-IId is dominated by 222Rn, with only a small amount of 220Rn. Conversely, the contained alpha distribution shows contributions from alpha decays occurring in the gas as well as at the cathode and MWPCs. The appearance of the uranium and lead isotopes points to contamination at the latter sites. We will show how to isolate the contributions of each population after discussing the alpha efficiency analysis in the next section.
3.1 Alpha Measurement Efficiencies
There are two major sources of inefficiency for alpha detection. First, the entire length of the alpha track must be contained in the fiducial volume of the detector. This is derived entirely from the geometry of the detector and the particle track and is called the Geometric Acceptance (GA). Second, the alpha must be correctly identified and classified as an alpha by the analysis. This is affected by features of the detector’s data acquisition and the subsequent analysis and is called the Analysis Efficiency (AE). Both are inherently geometrical, with the first being due to the alpha track crossing a detector boundary, whereas the second arises due to different orientations of the alpha track with respect to the detector’s principle axes. In the following we describe these in greater detail.
For brevity, only the calculations for 222Rn GPCC alphas are presented, although efficiencies for other categories of alpha track are presented in Table 1.
3.1.1 Geometric Acceptance
The GA is the probability that an alpha particle produced by a decay in the fiducial volume remains contained within it. The fraction of alpha tracks that are contained is determined analytically and checked against a simple geometric simulation. In the simulation, the origin of alpha particles are chosen randomly within the fiducial volume of the detector. They are each propagated in an isotropically distributed random direction, with a distance given by the average length for that isotope as measured by the range spectra (Figures 3-6). If the end point is still within the fiducial volume and the track crossed the central cathode, it is classified a GPCC. The fraction of 348 mm alpha tracks from 222Rn decay which produce GPCCs that are fully contained is . This is the first of the two geometrical efficiencies discussed above.
3.1.2 Analysis Efficiency
When an alpha track is oriented parallel to either the anode or grid wires, the individual periodic (see Section 2) hits on a single channel overlap and become difficult to distinguish. Likewise, tracks oriented parallel to the drift direction () have hits that are very long in time and are skewed by the electronics which have been designed for short nuclear recoils. Furthermore, such a track may not produce hits on all eight channels, as required for it to be classified as an alpha track. Both of these effects make it difficult or impossible to identify these as alpha tracks and introduces an angle-dependent loss of efficiency. This is further divided into the efficiency along , the zenith angle, and , the azimuthal angle of the track.
These efficiencies are determined analytically, by calculating the distribution of angles for 222Rn GPCC alpha particles and comparing with the observed distributions (see Figs 7 - 8). For each distribution, a range of angles is chosen over which the identification efficiency is assumed to be .333This assumption is verified by the agreement with the efficiency calculated using an independent method in Section 3.1.3 The measured distribution is scaled to match the calculation and the overall efficiency over that dimension is taken to be the ratio of areas of the distributions. The efficiency for detecting GPCC alphas from222Rn decays is over and over . Only statistical uncertainties are quoted here; systematic uncertainties will be estimated in Section 3.1.3.
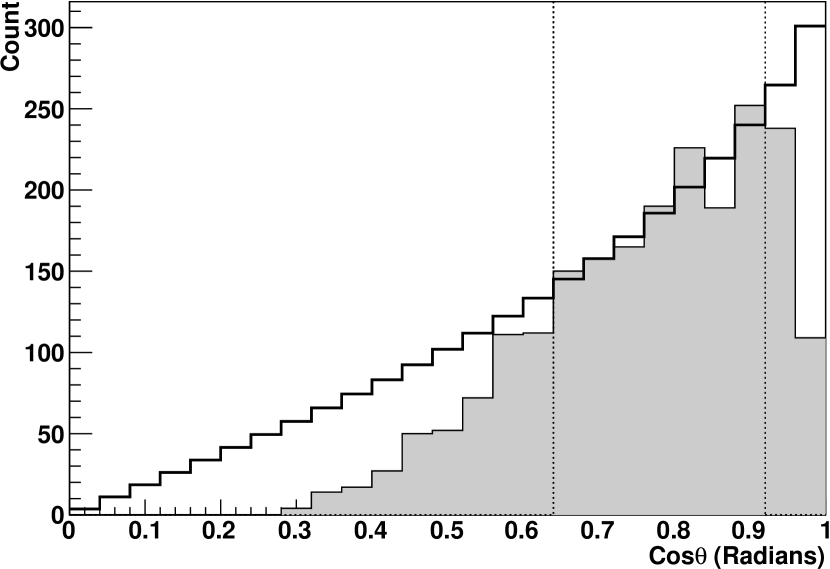
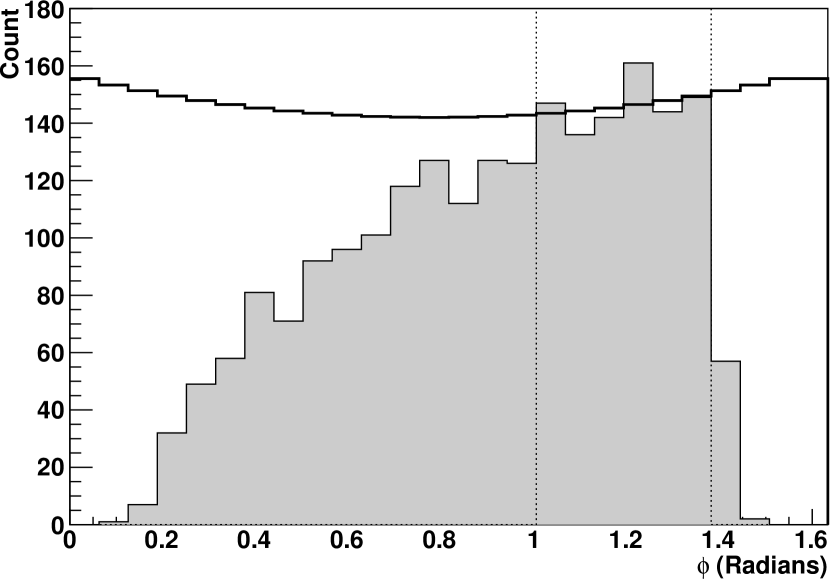
The total AE, assuming the two angular efficiencies are uncorrelated, is the product of the efficiencies along these two orthogonal angles, . This assumption introduces a systematic error of into the calculation, estimated by running a simulation with input angles that are tailored to match measured distributions rather than isotropic. The total identification efficiency for 222Rn GPCCs is obtained by taking the product of the AE (0.472) and the GA (0.121), yielding . This efficiency is the probability for the production and subsequent identification of a 222Rn GPCC. In order to find the absolute number of radon decays in DRIFT’s fiducial volume, one would take the observed number of GPCCs and divide by this efficiency.
| Category | Length | Geom. | Total | ||
|---|---|---|---|---|---|
| 222Rn GPCC | 348 | 0.121 | 0.733 | 0.582 | |
| 218Po GPCC | 396 | 0.130 | 0.772 | 0.618 | |
| 218Po Cath | 396 | 0.599 | 0.597 | 0.700 | |
| 238U Cath | 234 | 0.753 | 0.630 | 0.792 | |
| 234U Cath | 279 | 0.709 | 0.566 | 0.731 |
3.1.3 Time Correlation
The method of deriving the alpha detection efficiency described above relies on the critical assumption that there are regions of the and parameter space where the efficiency is (see Figures 7 and 8). To test this, we have developed a second independent method that is based on examining correlations in time between consecutive alpha decays in the 222Rn decay chain. For example, 222Rn will alpha-decay, producing 218Po and a 5.49 MeV alpha. This polonium atom decays with a half-life of 3.05 minutes, producing a second alpha particle. Because these alpha particles have different lengths and may follow different spatial distributions, they are assumed to have different probabilities for detection, and , respectively. Due to the nature of the decay chain and the short half-life relative to the gas flow rate (usually 1 volume/day), we assume that the same absolute number of each decay occurs within the fiducial volume.
The number of observed decays is the product of the total number of decays and the efficiency of observing that particular category of alpha. The probability of observing the alphas from both the decays of 222Rn and its daughter, 218Po, is then . The efficiency of detecting one particular category (e.g. 222Rn) is equal to the number of parent-daughter pairs () observed divided by the total number () of the other category observed (e.g. 218Po):
| (2) |
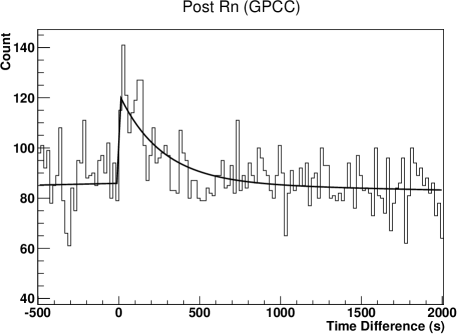
A contains a more rigorous derivation. The number of pairs () can be measured through timing correlations. In this example we take timing differences between all possible pairs of 222Rn and 218Po decays. Only the true parent-daughter pairs give the characteristic exponential timing correlation with the 3.05 minute half-life of Po-218; the rest should be uncorrelated. Figure 9 shows a histogram in the timing difference of all observed 222Rn and 218Po pairs. This distribution is fit to an exponential decay starting at with a second-order polynomial background, symmetric around zero, to model the uncorrelated decays. Here the exponential fit integrates to 505 identified event pairs above the background. Compared with the 8830 218Po alphas observed, this corresponds to a identification efficiency for 222Rn. However, in order to compare this efficiency with that obtained in Section 3.1, it is necessary to account for the potential difference in spatial distributions of decays, described above.
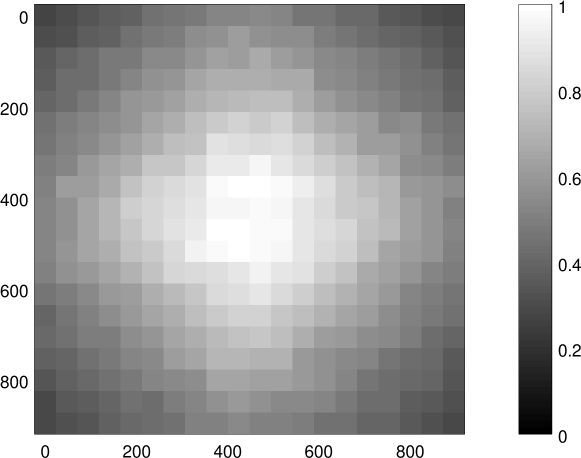
The derivation above measures the probability of detecting a particular 222Rn given that the subsequent 218Po alpha is also observed. However, because the focus lies on the two consecutive decays from the same parent 222Rn atom, there is necessarily a spatial correlation between the two events. This is particularly true here because the 218Po atom is positively charged about of the time (see Section 5.1) and follows the electric field lines to the central cathode with negligible diffusion, thus maintaining the - position of the atom. This spatial correlation is important to consider because alpha tracks which originate near the center of the detector are much more likely to remain contained than tracks which originate near a fiducial boundary. We account for this correlation by reusing the simulation which we used in Section 3.1.1 to calculate that 0.121 of the 222Rn decays produce GPCCs. Here we simulate 218Po alpha decays from the central cathode and record the original - position of the decay when the track is contained - the results of this are shown in Figure 10. Finally, we once again model alphas from 222Rn decays but use the distribution from Figure 10, rather than a homogeneous distribution, to choose the starting position of the atom. This results in a fraction of 0.130, rather than 0.121, for the production of GPCCs from 222Rn decays for which the subsequent 218Po alpha is later observed. This indicates that the spatial correlation shifts this efficiency measurement high by .
After correcting for this shift, the efficiency calculated by this technique for 222Rn falls to 0.054. This result is higher than the efficiency of 0.052 derived using the method described in Sections 3.1.1-3.1.2. In comparing the efficiencies obtained by these two different methods for both contained and GPCC populations of 222Rn alpha tracks, the largest disagreement is . This is conservatively taken to be the systematic uncertainty in the absolute efficiency for observing and identifying alpha particle tracks.
The time correlation technique can only be used in DRIFT-IId to measure the efficiency of detecting alpha particles from 222Rn decays; however it may be useful to other low-background experiments that have backgrounds caused by radioactive decay chains with short half-lives. The uranium isotopes have half-lives that are too long, and the polonium atoms are complicated by being present both in the gas and on the central cathode. The efficiencies used in this document, presented in Table 1, are calculated using the method described in Sections 3.1.1-3.1.2. The assumptions from this method, however, are validated by this second, entirely independent efficiency calculation by time correlation.
4 Thin-Film Cathode
With the alpha analysis presented above we now have the tools needed to characterize the contaminations and backgrounds due to alpha decays at the central cathode. Here we also introduce the thin film cathode as a method of reducing the backgrounds produced by these decays.
As described in Section 2.1 and Figure 4, an RPR occurs when an alpha decay at the cathode is misidentified as a nuclear recoil because the alpha particle is lost in the cathode material. In the case when the alpha also enters the gas volume, it is used to tag and veto the event; such events are classified as “tagged-RPRs.”
The original 20 wire cathode had a large RPR background, resulting from a significant fraction of un-tagged RPRs. The most common isotopes in the 222Rn chain to decay at the cathode are 218Po (214Po), which decay to produce 6.00 (7.69) MeV alpha particles. These have a path length of 12.4 (17.8) in stainless steel [22]. By geometrical calculation, this corresponds to 34% (24%) of the alpha particles lost in the wire, producing RPR background events. A thinner central cathode that is almost transparent to alpha particles would greatly increase the probability that an RPR is tagged by the alpha track, essentially eliminating the RPR.
The most promising material candidate is biaxially-oriented polyethylene terephthalate (mylar) with a Å layer of aluminum vacuum-deposited on each side for electrical conductivity. This material reduces the likelihood for an alpha particle to be fully absorbed from around to or less. The DRIFT collaboration installed a new central cathode constructed of this thin-film in March 2010 and collected 26.22 live-time days of shielded data.
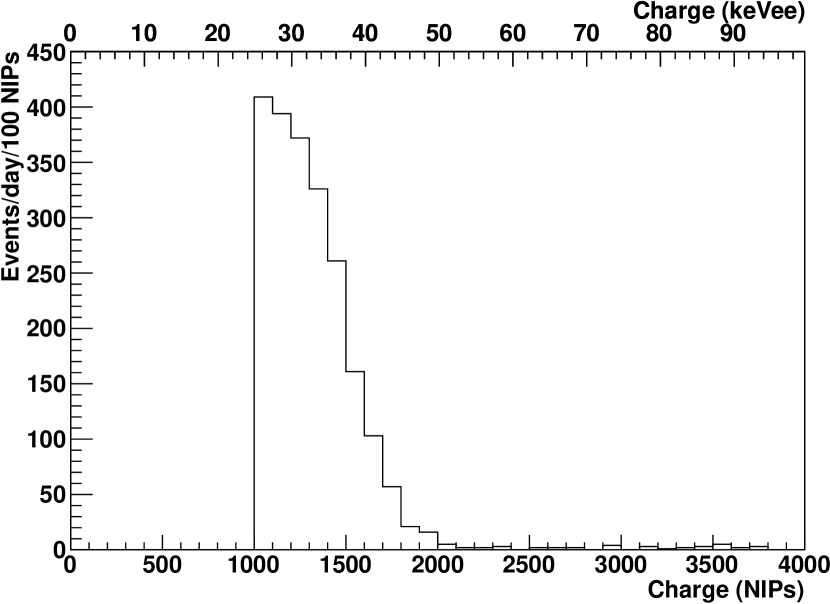
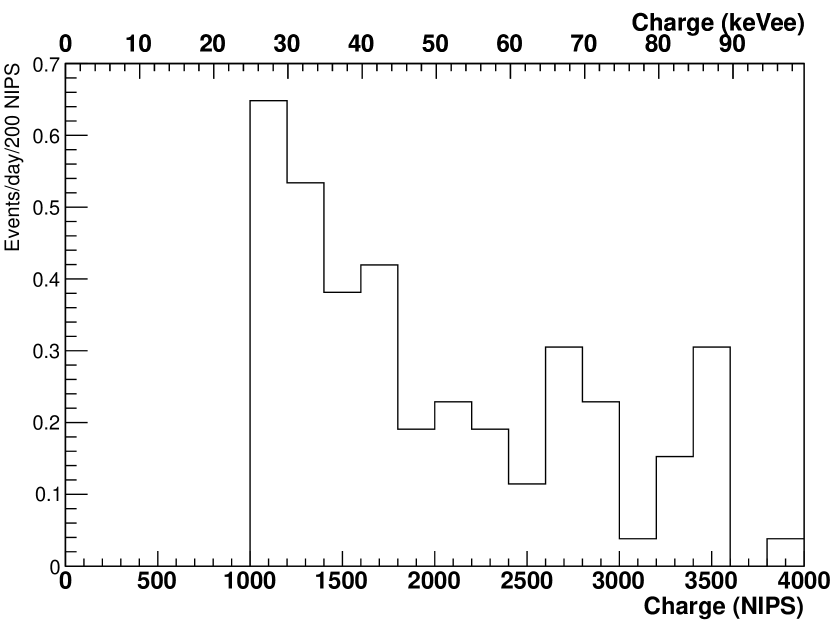
The installation of the thin-film cathode led to an immediate reduction in background rate, however, it was only a factor 19 instead of the factor 30 predicted above from geometry. In addition, the distribution of background events also changed in unexpected ways. The population of RPRs was easily recognizable, if reduced, but the background events from the central cathode now extended past the upper limit in energy for RPRs (see Figs 11 and 12). These were suspected to be Low-Energy Alphas (LEAs).
4.1 Low-Energy Alphas
As shown in Figure 4, an LEA is an event where only a short segment of an alpha track projects out of the cathode into the gas on one side of the detector volume, with no ionization appearing on the other side. Such an event may be misidentified as a nuclear recoil only if the alpha range in the gas is mm. This can be thought of as the inverse of an RPR event. There, the alpha must be absorbed to prevent tagging of RPRs, whereas for an LEA the recoil must be entirely absorbed in the cathode material in order for charge to fall on only one side of the detector.444DRIFT’s WIMP analysis checks for ionization on the opposite side of the detector and coincident in time to exclude exactly this type of event.
The alpha particle, which initially carries far too much energy to be mistaken for a nuclear recoil, must lose most of its energy by passing through the cathode material along its path. While there are many potential geometries for this to occur, we present two here to illustrate possibilities. Figure 13 shows the emission of an alpha particle at a shallow angle from the surface of the thin-film cathode. The alpha particle is oriented into the gas while the daughter atom embeds itself in the cathode, producing no ionization in the gas. Because the thin-film cathode is not perfectly flat, the alpha particle may cross a trough and later re-enter the cathode, thus producing only a short track of ionization in the gas. Similarly, Figure 4 shows an LEA created by the emission of an alpha particle from an atom buried below the surface of the cathode. The daughter atom never exits the film while the alpha particle, traveling nearly parallel to the plane of the cathode, exits near the end of its track to deposit only a small amount of ionization before ranging out in the gas.
The buried atoms necessary for the second process were common in this DRIFT-IId cathode. Uranium, present in the aluminum layer of the thin-film cathode (see Section 5.2), is typically buried. Radon progeny can also end up being buried in the cathode material. While 218Po, produced by 222Rn decays in the gas, can only be deposited onto the cathode surface, its daughters by alpha decay can be embedded. After 218Po decays at the surface, the resultant 214Pb atom will be directed into the film half of the time. With 112 keV of kinetic energy, it can embed itself up to 400Å deep into the aluminum layer of the film. This atom, which rapidly beta-decays into the alpha-producing 214Po, is now buried in the cathode and can produce an LEA.
While RPRs have a distinct energy spectrum rarely creating more than 2000 NIPs,5552000 NIPs is above the mean energy for 210Pb recoils, which are the highest-energy RPRs in DRIFT. (see Figure 11) LEAs do not have such a limitation. They instead exhibit a nearly flat energy distribution across DRIFT’s entire signal region. This feature allows populations of LEAs to be distinguished from RPRs. LEAs are present in data taken with both the wire and the thin-film cathodes; however with the wire cathode the RPR rate swamps the LEAs [10]. The thin-film considerably reduces rate of RPRs such that the LEAs become a significant contributor to the background rate of the experiment.
With the discovery of the LEAs in the thin-film cathode data, the analysis focused on determining the decaying isotopes and their locations. Figure 6 begins to provide a method for determining where a type of alpha-decay occurred. These data were taken with the thin film cathode in place and show large uranium contributions. It was suspected that these were from the cathode; however, using alpha range spectroscopy it is possible to pin down the location of the radio impurities.
5 Contamination Location
In Section 2.1, Equation 1, we defined a figure of merit to assess the efficacy of different cathodes for rejecting alpha-decay backgrounds at the cathode. The denominator of this quantity is the sum of all alpha decays which occur on or in the central cathode. While some populations of alpha-decaying contaminants, such as uranium isotopes, are present only at the cathode, others, for example 222Rn, are present in the gas and do not contribute backgrounds in DRIFT-IId. The contaminants of interest, as identified in Figures 3 and 6, are radon’s daughters 214Po and 218Po (Section 5.1) as well as two isotopes of uranium (Section 5.2). The Po atoms present on the central cathode contribute to the figure of merit, while some fraction is neutrally-charged and remains in the gas. Below we show the measurement of neutral fractions for 218Po and 214Po fractions, from which we deduce their contribution to the alpha-decays at the cathode.
5.1 Polonium Neutral Fraction
When an atom undergoes an alpha decay, the recoiling nucleus loses its outer shell of electrons and then, as it comes to rest, regains some or all of them [28]. If it is positively charged when it comes to a stop, it will follow the electric field lines and electrodeposit onto the central cathode. If instead it is neutral, it will remain in the gas, potentially producing a GPCC if it does later alpha-decay.
| Isotope | Absolute Count | Neutral Fraction () |
|---|---|---|
| 222Rn | ||
| 218Po | ||
| 214Po |
Alpha particles emitted by a particular isotope are selected from the population of GPCC alpha tracks by their lengths, and counted. The absolute count of decays by this isotope in the gas is calculated by dividing this observed number by the identification efficiency for that isotope, described in Section 3.1. Due to the short half-lives of the Po and Bi isotopes, the 214Po and 218Po are in equilibrium with 222Rn.666Gas flow reduces Po concentration by less than The neutral fraction of each polonium isotope is therefore the ratio of Po decays in the gas to 222Rn decays in the gas. The absolute counts and resultant neutral fractions are provided in Table 2. Decay counts of polonium atoms on the cathode are obtained by using this neutral fraction and extrapolating from the known absolute count of 222Rn decays. This is used to calculate the figure of merit below in Section 8.
There is a considerable difference in the measured neutral fraction between 218Po () and 214Po (). This is likely to be due to the chain of radioactive decays between the 218Po and 214Po alpha emissions. 218Po is created by alpha emission of 222Rn in the gas. When 218Po decays, it produces an alpha particle and a 214Pb atom which is either neutral or positively charged. An atom which is neutral will remain in the gas until, with min, it undergoes a decay to produce 214Bi. By emitting an electron, the resultant bismuth atom naturally obtains a positive charge, and it is carried to the cathode by the electric field.
5.2 Uranium
There are generally three possibilities for the location of the contamination in DRIFT-IId: the gas, the cathode, or the MWPCs. There is no mechanism by which uranium should enter the gas,777This is supported by the absence of uranium GPCCs in DRIFT-IId. which leaves the MWPCs and the central cathode. These can be distinguished by using the vector direction of the alpha particle track.
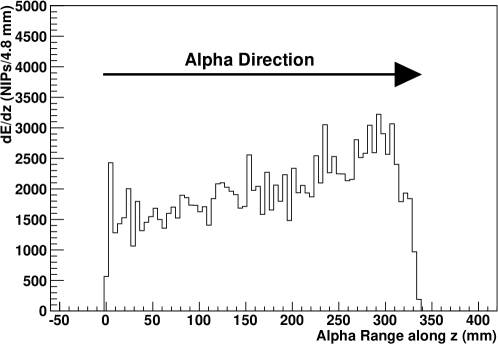
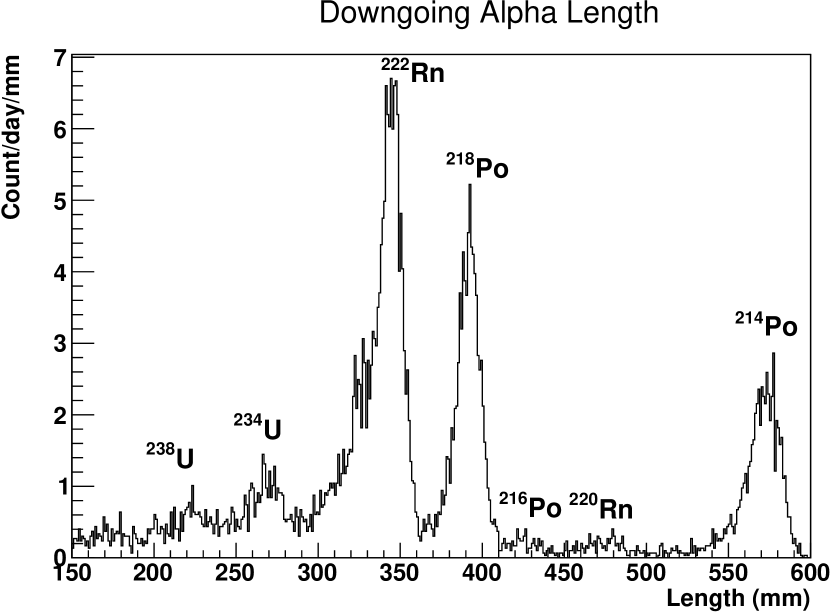
Alpha particle tracks exhibit a Bragg peak in which they produce more ionization near the end of the track (see Figure 14). This is used to distinguish between the origin and the end of a track, and to then categorize it as either traveling toward the central cathode (“up-going”) or away from the central cathode (“down-going”). Figures 15 and 10 show the length distribution of up-going and down-going contained alpha tracks, respectively. These reveal that all of the uranium is on or in the central cathode because every alpha emitted by a uranium decay is oriented away from the central cathode. Alpha particles which originate from decays in the gas, like those due to the decay of 222Rn, are present in equal quantities in both up-going and down-going distributions. Finally, isotopes that are present on both the MWPCs and the central cathode are also present in both populations, although typically in unequal quantities. For example, alpha particles from the decay of 210Po are almost entirely up-going, indicating contamination of the MWPCs.888 A dirty MWPC can be identified by further dividing the up-going population into decays which occur on the left and right sides of the detector.
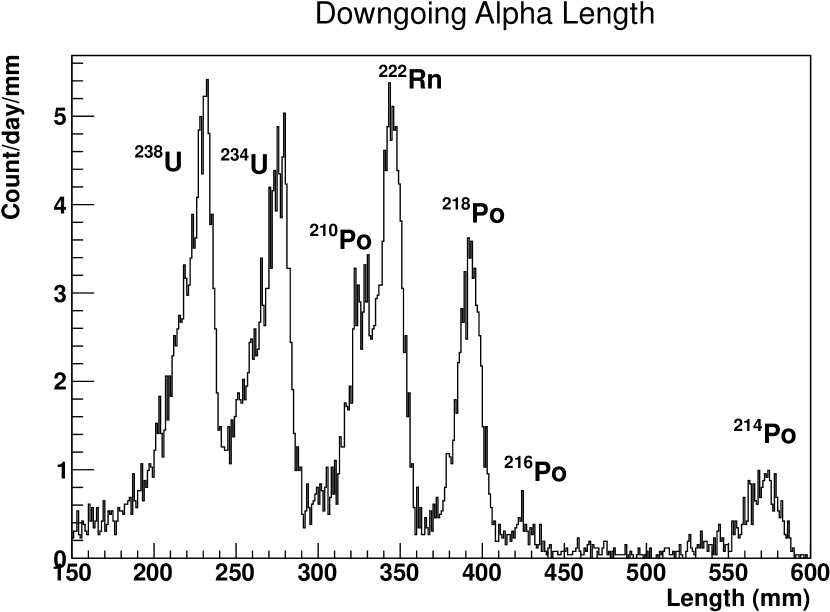
This uranium contamination of the central cathode can be quantified. Using the efficiency calculations of Section 3.1 we obtain an absolute count of uranium decays from the central cathode and, from this, an absolute number of atoms of each isotope. Present in the 1.1 g of thin film within the cathode’s fiducial area, this corresponds to a contamination of ppt 234U and ppb 238U. This value is consistent with an independent assay done at SNOLAB [29], which measured ppb 238U. With contamination on the thin-film cathode, DRIFT-IId has the advantage of measuring the uranium atom’s decay directly, rather than the decay of a daughter isotope, and with high () efficiency.
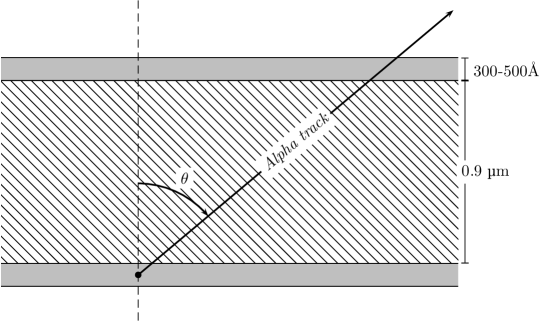
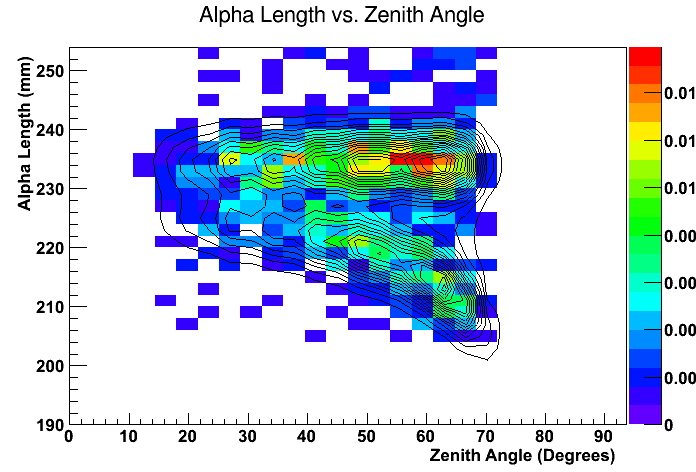
The uranium contamination, now known to be located only at the central cathode, can be removed by replacing this component with a cleaner version. To do this, however, it is important to know if the uranium is present in the aluminum layer, the mylar layer, or both. The location of the uranium can be pinpointed by examining the relationship between the alpha angle () and the alpha length in the gas. For alphas originating at or near to the surface of the cathode and exiting directly into the gas without passing through the cathode, the length is nearly independent of . If, instead, the surface-originating alpha passes through the higher-density cathode before entering into the low-density the gas on the opposite side (Figure 17), the length will decrease by . Thus, if uranium contamination is restricted to the thin surface layers of aluminum, a bimodal length vs. distribution would be expected. If instead the contamination is restricted to the mylar, this distribution will be unimodal.
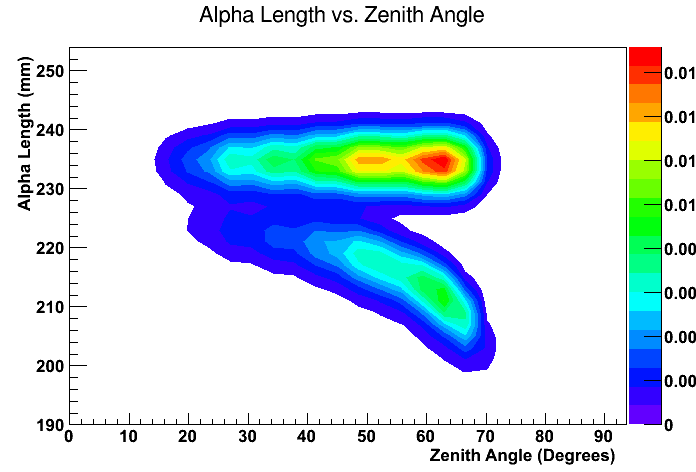
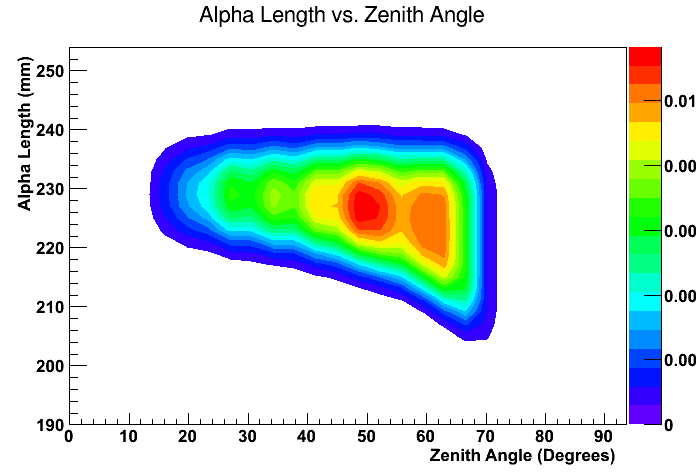
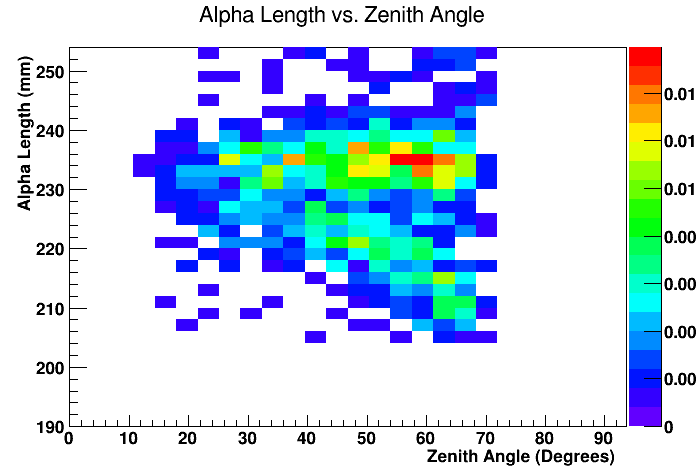
To quantify this, the length vs. distribution was modeled with the uranium contamination being either in the aluminum or in the mylar. Alphas from uranium decays were generated isotropically with absorption coefficients obtained from SRIM [22], and their final lengths were convolved with a Gaussian to account for longitudinal straggling and measurement error. The resulting length vs. distribution is also modulated by DRIFT’s efficiency over for detection (Section 3.1.2). For the model corresponding to uranium in the aluminum layer, another angle-dependent efficiency is included to account for the probability that the recoiling thorium atom leaves the film and “vetoes” the alpha track. The resultant models are shown in Figure 18(a) and 18(b).
The data shown in Figure 18(c) clearly shows the bimodal distribution expected from the aluminum-only contamination model. A 2-parameter fit is performed matching a superposition of the two model distributions to that obtained from the data. In the best fit model (Figure 18(d)), 85 of the uranium contamination is in the aluminum and is in the mylar. With this, we were able to unambiguously pinpoint the location of the majority of the uranium contamination to the Å layers of aluminum, allowing us to focus on that component for the next version of the thin-film cathode.
6 Clean Thin-Film Cathode
Following the confirmation that the uranium contamination was primarily in the aluminum layer, the DRIFT collaboration manufactured a new set of aluminized mylar cathode panels, this time using ultra-pure aluminum. This new cathode was installed in April of 2012 and DRIFT collected 29.69 livetime-days of shielded data. The 238U contamination level dropped from to ppb (see Table 3), confirming the measurement in Section 5.2 which located the majority of the contamination in the aluminum layer. The background rate also dropped further - these results are presented and discussed in detail in Section 8.
| Isotope | Dirty | Clean |
|---|---|---|
| 234U | ppt | ppt |
| 238U | ppb | ppb |
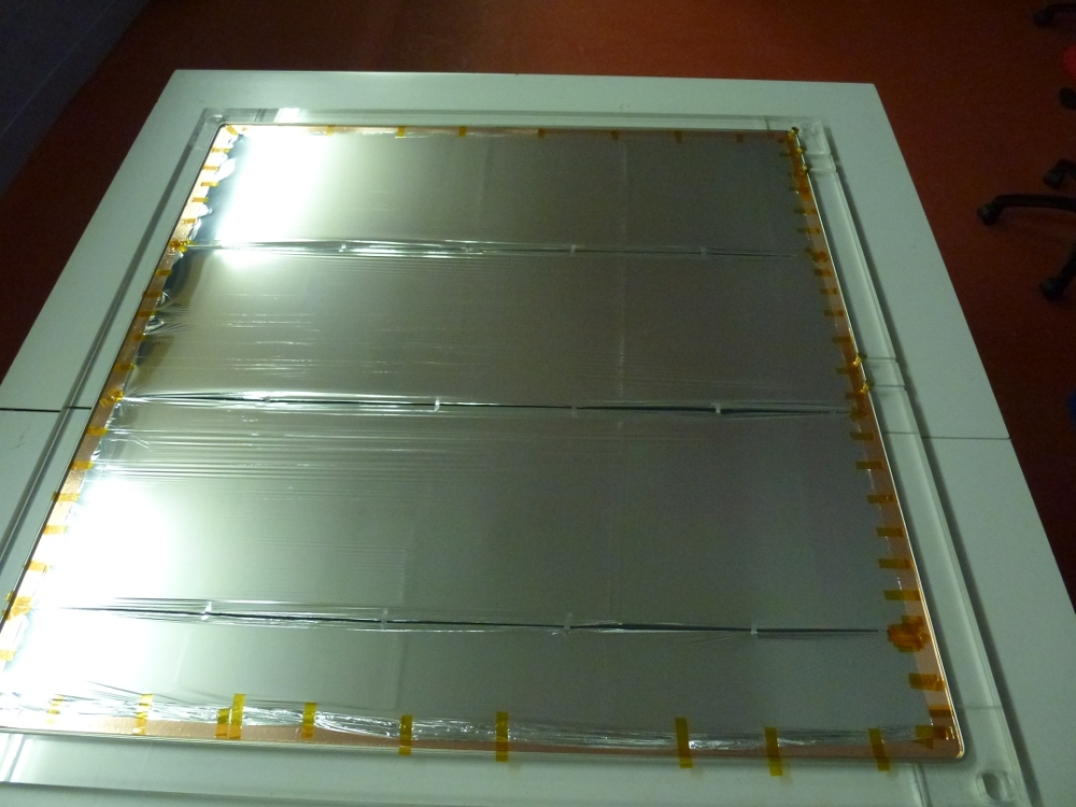
Figure 19 shows the thin-film installed on a cathode frame. The aluminized mylar has only been available in 1-ft widths, so 4 strips (three full and one narrow) have been used to span the full 1 m width of the cathode frame. Each panel is attached only on its short end, so it is taut longitudinally but not laterally. This results in ripples present in the film, with peaks running lengthwise along each panel. In this version an attempt was made to reduce the impact of these ripples in the film on LEA production by flattening the panels better. In between each pair of panels four small ( cm2) tabs were used to connect them to allow the application of lateral tension as well. This reduced the ripples, but did not eliminate them. The area of these tabs is of the total cathode area which, due to the increased thickness in these regions, is expected to increase the overall background rate by around 3%.
7 Texturized Thin-Film
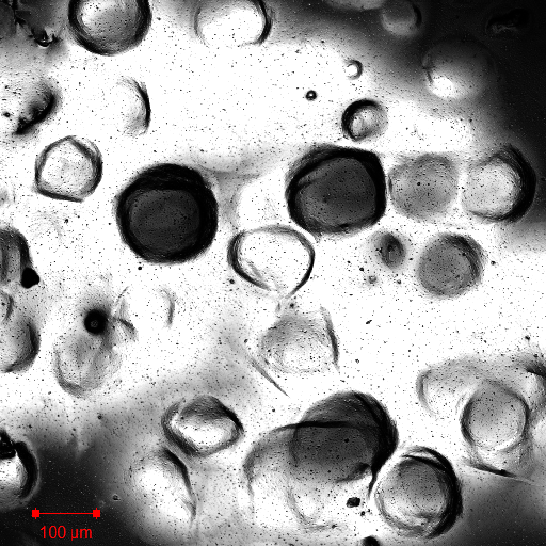
Any reduction of the probability for an alpha to be fully absorbed in the cathode will result directly in a reduction of background rate in DRIFT-IId. While handling even thinner cathodes is impractical, it is possible to imprint the thin-film with a 3-dimensional pattern to guarantee that there are no straight-line paths in the film long enough to absorb an entire alpha track (see Figure 22). There are industrial applications which micro-texturize thin films, but not films thinner than 25 .
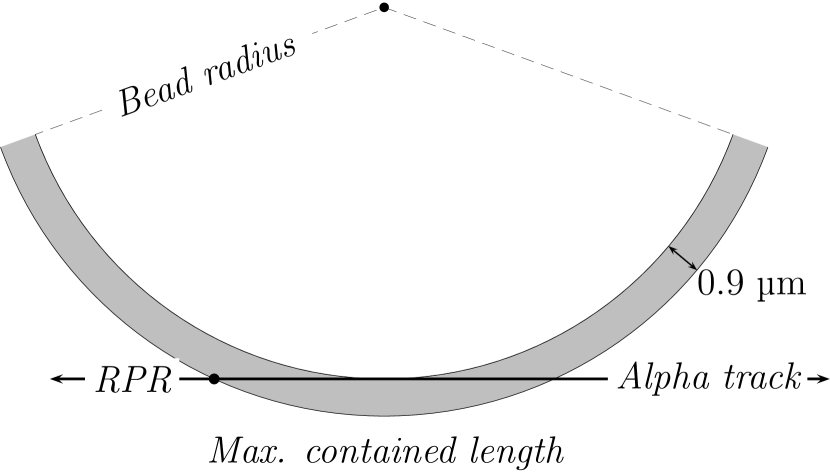
Using techniques to be described fully in a later document, it is possible to texturize 0.9 aluminized mylar by impacting it with uniformly sized glass beads (see Figure 22). Due to the curvature of an impact pit from a spherical bead, a diameter is adequate to ensure no straight-line paths longer than 33 , the length of the shortest radon daughter alpha in mylar.
The DRIFT collaboration installed a prototype texturized thin-film cathode in May of 2013. Since then a background rate of only 1 event per day has been observed, confirming that texturization can increase the transparency of aluminized mylar to alpha particles. Efforts toward improving the texturization coverage of the film has continued, and new panels with texturized area fraction are ready for installation and further study.
8 Cathode Rejection Efficiency
At this point we have developed the tools, and obtained the data, to determine the efficacy of the various cathodes for vetoing the alpha-decay backgrounds, as determined by the figure of merit of Equation 1. In addition, we are now able to determine the absolute isotopic contamination and location of the various sources contributing to the alpha-decays at the cathode.
To begin, we would like to sub-divide Equation 1 into the backgrounds caused by RPRs and those due to LEAs. The latter entirely populate the higher energy backgrounds from 2000-4000 NIPs, whereas the low energy, 1000-2000 NIPs bin, contains both RPRs and LEAs. The background events collected during the runs in question are divided into high and low energy bins, and presented in Table 4, along with absolute decay counts of 222Rn and uranium.
| Population | Wire | Dirty | Clean |
|---|---|---|---|
| 222Rn Decays | |||
| Uranium Decays | |||
| Backgrounds (low) | |||
| Backgrounds (high) |
These populations can be grouped further. High-energy data and a simple model both indicate that the LEA rate is constant over the energy range of interest (1000-4000 NIPS). It is therefore assumed that the rate of LEAs in the 1000-2000 NIPS range, where they overlap with RPRs, is the same as the rate in the 2000-4000 NIPS range. The total number of LEAs is then given by of the number of high energy backgrounds. Similarly, of the high energy backgrounds must be subtracted from the low energy population to remove the contribution by LEAs to obtain the RPR contribution.
Alpha-producing decays at the cathode can be grouped into those occurring on the surface and those buried in the film. This grouping is summarized below in Table 5 in which the neutral fraction of 218Po in the gas, measured in Section 5.1, is denoted by .
| Isotope | Surface | Buried |
|---|---|---|
| 214Po | ||
| 218Po | 0 | |
| U (Both) | 0 | |
| Total | + |
After a 222Rn decay, of the 218Po atoms remain neutral in the gas and cannot produce backgrounds. The remaining of these atoms are charged and electrodeposit onto the central cathode, later decaying on its surface. After this decay produces 214Pb, half of the atoms on the surface () bury themselves into the film while half of them are ejected into the gas as RPRs. With a neutral fraction of 0, all of the 214Pb atoms in the gas, equal to of the total number, electrodeposit onto the surface of the cathode. Finally, all of the uranium, known to be distributed throughout the aluminum layer (Section 5.2), is considered to be buried. This categorization of the absolute number of alpha decays at the cathode, along with the two types of background (RPR and LEA), is presented in Table 6.
| Population | Wire | Dirty | Clean |
|---|---|---|---|
| Surface Decays | |||
| Buried Decays | |||
| RPRs | |||
| LEAs |
Table 7 presents a comparison of the figure of merit for different cathodes, which leads to several important conclusions. The Dirty and Clean thin-film runs, with cathodes identical save for the vastly different contamination levels of buried uranium, see LEA/All Alpha production rates which agree to within statistical errors. This supports the LEA model of background production which hypothesizes that these backgrounds can be produced by decays from atoms deposited at the cathode’s surface as well as those found deeper in the material. Finally, a comparison of the RPR/Surface decay rate reveals a factor of reduction in the probability of producing RPR events when switching from wire to a thin-film cathode. This corresponds to the factor of rejection by alpha tag improving from to between the wire and thin-film runs.
| Population | Wire | Dirty | Clean |
|---|---|---|---|
| RPR/Surface | |||
| LEA/All | |||
| All/All |
The background events remaining in DRIFT-IId are now due almost entirely to radon progeny. Using the absolute numbers of alpha decays from Table 4, the remaining uranium contamination is estimated to produce about of the LEA backgrounds in DRIFT-IId.111111This fraction is probably slightly higher because the alphas from uranium decays, with shorter tracks, are likely to have higher background production rates than those from polonium decays. Applying the production efficiencies of Table 7 to the absolute alpha counts in Table 4 indicates that of all backgrounds in DRIFT-IId are now due to uranium contamination of the cathode, with the remaining due to RPRs and LEAs produced by radon’s polonium daughters.
9 Conclusions
The background events in the DRIFT-IId dark matter detector are due to alpha decays at the central cathode that are partially or fully absorbed by the cathode. The wire cathode has been replaced with a thin (0.9 ) aluminized mylar cathode to reduce the production rate of these background events by a factor of . This new cathode had an unexpected contamination of alpha-producing uranium isotopes, identified using alpha range spectroscopy, which contributes further background events. The study of these alpha particles pinpoints the uranium location to the thin aluminum coating of the aluminized mylar cathode, and measures the contamination to the ppt level.
A new central cathode was built, this time using film produced with uranium-free aluminum. This reduced the uranium contamination level by a factor of 10; enough that the remaining uranium is only a minor contributor to the overall background rate. The study of alpha particle tracks in DRIFT-IId has increased our understanding of the remaining backgrounds, provided a precise and in-situ assay of the central cathode, and helped to direct efforts for future improvements. These practical results attest to the usefulness of studying these decays in nuclear recoil experiments.
10 Acknowledgements
We acknowledge the support of the US National Science Foundation (NSF). This material is based upon work supported by the NSF under Grant Nos. 1103420, 1103511, 1407773, and 1506237. JBRB acknowledges support from the Sloan Foundation and the Research Corporation. We also acknowledge support from the Leverhulme Trust through grant PRG-196 at Sheffield. We are grateful to Cleveland Potash Ltd and the Science and Technology Facilities Council (STFC) for operations support and use of the Boulby Underground Science Facility.
Appendix A Time Correlation Derivation
Consider a particular run of duration while the detector is in equilibrium; the number of observed decays are and . The atoms which decay during this run are indexed by such that for each , and correspond to the times that one atom undergoes two different decays. The probability distribution for the observation of an individual decay is flat, corresponding to a constant rate, and is given by Equations 3 and 4. These are used to calculate the distribution of differences between all pairs of observed decays, . Below, is a step function whose value is 1 between and , and is the heavyside step function which is 1 for .
| (3) |
| (4) |
| (5) |
For there are two distinct cases: when and two different atoms are concerned there is no correlation between the timing of these two events; when the difference in time is dictated by the decay time of 218Po, the isotope which decays second.
| (6) |
The second term of Equation 6 is a background term. Due to the nature of actual run durations and time-dependent radon concetrations it may be more complicated than shown. Here it is modeled as a second order polynomial, symmetric around 0, and Figure 9 shows an exponential decay plus this background fit to the distribution of timing differences. , used below, is with this background term removed.
| (7) |
| (8) |
References
- [1] G. Bertone, D. Hooper, J. Silk, Particle dark matter: evidence, candidates and constraints, Physics Reports 405 (5–6) (2005) 279 – 390.
- [2] G. Jungman, M. Kamionkowski, K. Griest, Supersymmetric dark matter, Physics Reports 267 (5–6) (1996) 195 – 373.
- [3] C. Aalseth, et al., CoGeNT: A Search for Low-Mass Dark Matter using p-type Point Contact Germanium Detectors, Phys.Rev. D88 (1) (2013) 012002. arXiv:1208.5737.
- [4] R. Bernabei, et al., First results from DAMA/LIBRA and the combined results with DAMA/NaI, Eur.Phys.J. C56 (2008) 333–355. arXiv:0804.2741.
- [5] D. N. Spergel, Motion of the earth and the detection of weakly interacting massive particles, Phys. Rev. D 37 (1988) 1353–1355.
- [6] S. Ahlen, et al., The case for a directional dark matter detector and the status of current experimental efforts, International Journal of Modern Physics A 25 (01) (2010) 1–51.
- [7] S. Burgos, et al., First measurement of the head–tail directional nuclear recoil signature at energies relevant to WIMP dark matter searches, Astroparticle Physics 31 (4) (2009) 261 – 266.
- [8] J. Turk, Radiation studies with DRIFT II dark matter detectors, Ph.D. thesis, University of New Mexico (March 2008).
- [9] J. Battat, et al., First background-free limit from a directional dark matter experiment: results from a fully fiducialised drift detector arXiv:1410.7821.
- [10] S. Burgos, et al., Studies of neutron detection and backgrounds with the DRIFT-IIa dark matter detector, Astroparticle Physics 28 (4–5) (2007) 409 – 421.
- [11] D. P. Snowden-Ifft, Discovery of multiple, ionization-created CS2 anions and a new mode of operation for drift chambers, Review of Scientific Instruments 85 (1) (2014) –.
- [12] J. Brack, et al., Background assay and rejection in DRIFT arXiv:1404.2253.
- [13] G. J. Alner, et al., The DRIFT-II dark matter detector: Design and commissioning, Nuclear Instruments and Methods in Physics Research A 555 (2005) 173–183.
-
[14]
D. P. Snowden-Ifft, C. J. Martoff, J. M. Burwell,
Low pressure
negative ion time projection chamber for dark matter search, Phys. Rev. D 61
(2000) 101301.
doi:10.1103/PhysRevD.61.101301.
URL http://link.aps.org/doi/10.1103/PhysRevD.61.101301 - [15] C. Martoff, et al., Suppressing drift chamber diffusion without magnetic field, Nucl.Instrum.Meth. A440 (2000) 355–359.
- [16] D. P. Snowden-Ifft, J.-L. Gauvreau, High precision measurements of carbon disulfide negative ion mobility and diffusion, Review of Scientific Instruments 84 (5) (2013) –.
- [17] J. R. Ellis, R. Alvarado-Flores, Elastic supersymmetric relic-nucleus scattering revisited, Phys. Lett. B 263 (CERN-TH-6063-91. UMSL-TH-91-2) (1991) 259–266. 19 p.
- [18] S. Burgos, et al., Track reconstruction and performance of DRIFT directional dark matter detectors using alpha particles, Nuclear Instruments and Methods in Physics Research Section A: Accelerators, Spectrometers, Detectors and Associated Equipment 584 (1) (2008) 114 – 128.
- [19] A. Murphy, S. Paling, The boulby mine underground science facility: The search for dark matter, and beyond, Nuclear Physics News 22 (1) (2012) 19–24.
- [20] J. Brack, et al., Long-term study of backgrounds in the DRIFT-II directional dark matter experiment, Journal of Instrumentation 9 (07) (2014) P07021.
- [21] E. Daw, et al., Spin-dependent limits from the DRIFT-IId directional dark matter detector, Astropart.Phys. 35 (2012) 397–401. arXiv:1010.3027.
- [22] J. Zeigler, The stopping ranges of ions in matter (2008).
- [23] J. Battat, et al., Radon in the DRIFT-II directional dark matter TPC: emanation, detection and mitigation, JINST 9 (11) (2014) P11004. arXiv:1407.3938.
- [24] K. Pushkin, D. Snowden-Ifft, Measurements of W-value, mobility and gas gain in electronegative gaseous CS2 and CS2 gas mixtures, Nuclear instruments & methods in physics research. Section A, Accelerators, spectrometers, detectors and associated equipment 606 (3) (2009) 569–577, eng.
- [25] M. Oreglia, A Study of the Reactions , Ph.D. thesis (1980).
- [26] J. Gaiser, Charmonium Spectroscopy From Radiative Decays of the and , Ph.D. thesis (1982).
- [27] T. Skwarnicki, A study of the radiative CASCADE transitions between the Upsilon-Prime and Upsilon resonances, Ph.D. thesis (1986).
- [28] P. Hopke, The initial atmospheric behavior of radon decay products, Journal of Radioanalytical and Nuclear Chemistry 203 (2) (1996) 353–375.
- [29] I. Lawson, Private Communication (Jan 2012).