Transport of dipolar excitons in (Al,Ga)N/GaN quantum wells
Abstract
We investigate the transport of dipolar indirect excitons along the growth plane of polar (Al,Ga)N/GaN quantum well structures by means of spatially- and time-resolved photoluminescence spectroscopy. The transport in these strongly disordered quantum wells is activated by dipole-dipole repulsion. The latter induces an emission blue shift that increases linearly with exciton density, whereas the radiative recombination rate increases exponentially. Under continuous, localized excitation, we measure a continuous red shift of the emission, as excitons propagate away from the excitation spot. This shift corresponds to a steady-state gradient of exciton density, measured over several tens of micrometers. Time-resolved micro-photoluminescence experiments provide information on the dynamics of recombination and transport of dipolar excitons. We account for the ensemble of experimental results by solving the nonlinear drift-diffusion equation. Quantitative analysis suggests that in such structures, exciton propagation on the scale of 10 to 20 microns is mainly driven by diffusion, rather than by drift, due to the strong disorder and the presence of nonradiative defects. Secondary exciton creation, most probably by the intense higher-energy luminescence, guided along the sample plane, is shown to contribute to the exciton emission pattern on the scale up to 100 microns. The exciton propagation length is strongly temperature dependent, the emission being quenched beyond a critical distance governed by nonradiative recombination.
pacs:
71.35.-y, 03.75.Kk, 03.75.Mn, 73.63.Hs, 78.55.CrI Introduction
In the last years, indirect excitons (IXs) have attracted considerable attention because they constitute a model-system for studies of cold gases of dipolar bosons in a solid-state environment [1]. An IX is composed of an electron and a hole, bound by Coulomb attraction but engineered in such a way that that a potential barrier separates them along one direction in space. One of the most interesting and most studied realizations of IXs has been obtained in (Al,Ga)As/GaAs coupled quantum wells (CQWs) under externally applied electric field [2] . In such structures the electric field applied along the structure axis tilts the conduction and valence band edges, so that the optical recombination takes place between an electron and a hole confined in different quantum wells (QWs), which form an IX. For typical electric fields of several volts per micrometer, red shift (quantum confined Stark effect) reaches tens of meV.[3, 2] The separation between electron and hole within an IX increases drastically its radiative lifetime. Radiative lifetimes as large as tens of microseconds have been reported in the literature. [3, 2] It has been shown, that if the thermalization time of IXs is shorter than their lifetime, the IXs can cool down to temperatures comparable or smaller than the degeneracy temperature, thus allowing for condensation into a coherent state.[4, 5, 6, 7, 8]
Another important feature of IXs, is their intrinsic dipole moment, aligned perpendicular to the QW plane. These dipoles constitute an ideal driving force for putting IXs in motion, since an IX cloud rapidly expands along the QW plane under its own repulsive forces.[9, 3, 10] Dipole-dipole interaction also leads to the screening of the electric field and induces a density-dependent blue shift of the exciton energy [11], at least below the Mott density above which excitonic effects are washed out.[12] Blue shifts of IX energy up to several meVs and propagation lengths reaching a hundred of microns have been observed in GaAs/(Al,Ga)As CQWs at low temperatures.[3, 13]
In-plane motion of IXs can also be controlled by external voltages. This can be used to collect and manipulate IXs in traps,[14, 15, 16] lattices [17] and narrow channels[18] which are similar to the traps and lattices used in the studies of cold atoms.[19, 20] This degree of control opens new possibilities for studying fundamental physical properties of IXs.[21] The efficient control of IXs by external voltages also paves the way to novel optoelectronic devices based on excitonic properties, as recently demonstrated. [22, 23, 24, 25, 26] However, the development of such devices operating at room temperature seems difficult, at least with GaAs/(Al,Ga)As heterostructures. This is mainly due to the relatively small exciton binding energy. Indeed,exciton binding energy is equal to meV in bulk GaAs, which corresponds to a temperature of K. [27] It is enhanced by quantum confinement in QWs but it is still reduced down to a few meV in CQWs, because of the on-axis separation of the electron-hole pair.
Wide band-gap semiconductors are, from this standpoint, much better candidates: binding energies as high as meV, for bulk GaN, or meV for bulk ZnO[28] permit the preservation of excitonic properties up to room temperature. These compounds, in their natural wurtzite crystal form, exhibit another interesting feature: spontaneous and piezoelectric polarizations[29, 30]. So far, this was considered detrimental for optoelectronic applications but it can constitute a decisive advantage for creating of cold gases of dipolar excitons. Indeed, GaN/(Al,Ga)N or ZnO/(Zn,Mg)O single QWs grown along the () crystal axis, naturally exhibit built-in electric fields of hundreds of kV/cm. This results from the difference of total polarizations between the well and barrier materials.[31, 32] For instance, in GaN/(Al,Ga)N QWs wider than nm, the quantum-confined Stark effect is so strong that it dominates over the quantum confinement. In this case, the ground-state exciton energy lies below the band gap of GaN ( eV at K).[33]
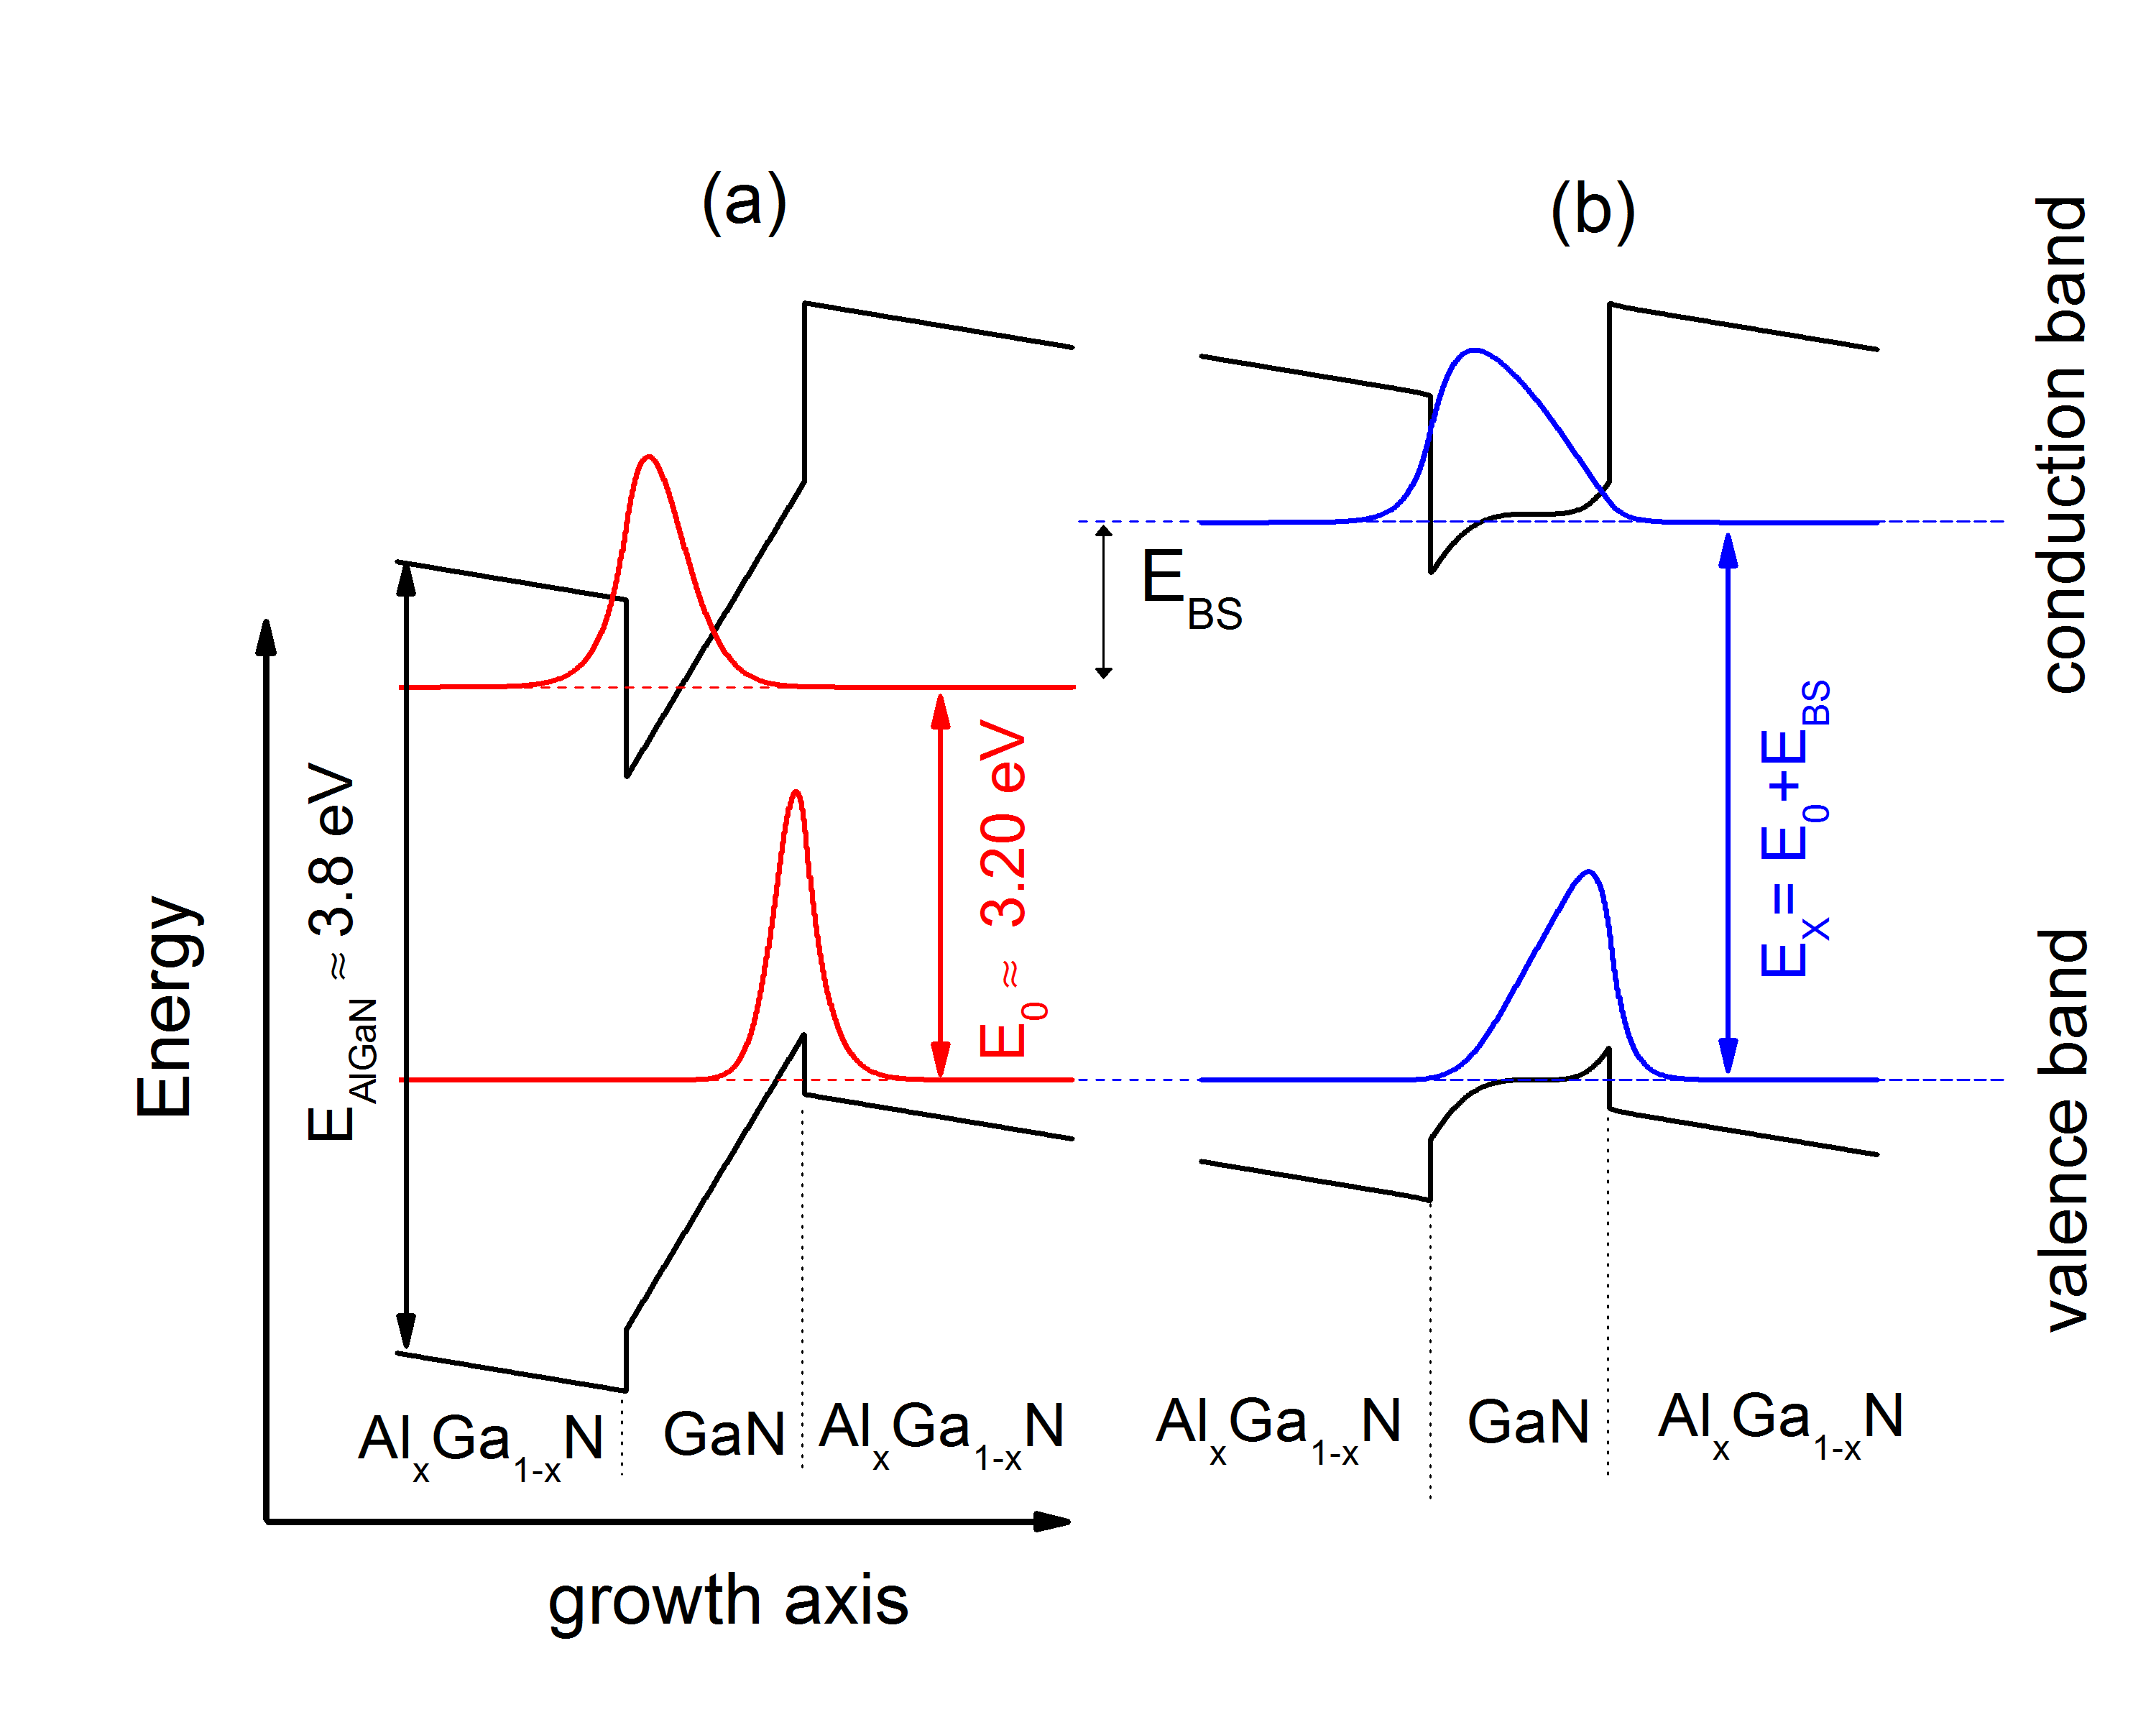
In such QWs, IXs are naturally created in the absence of an external electric field. Their binding energy decreases significantly when the well thickness increases but still remains largely above meV.[31, 34] Consistently, radiative lifetimes increase exponentially and values as large as tens of microseconds have been measured for QWs widths of nm only.[31, 35, 36] One important consequence of the large band offsets, lifetimes and electric field effects in polar GaN/(Al,Ga)N QWs is the possibility to accumulate dipolar exciton densities larger than cm-2 using reasonably small laser power densities, inducing blue shifts of several hundreds of meV. This situation has been both observed experimentally and thoroughly modeled,[35] as shown in Fig. 1. By solving self-consistently the Poisson and Schrödinger equations, the curvatures of both potential and envelope wave-functions can be calculated, to obtain the optical transition energies.
The purpose of this paper is to exploit dipole-dipole repulsion to study the transport of IXs in GaN/(Al,Ga)N QWs grown along the () axis. The tightly localized, strong nonresonant excitation in such structures produces a potential that pushes the dipolar excitons away from the excitation spot. Time and spatially-resolved photoluminescence (PL) measurements allow us to observe the emission/propagation of those excitons over tens of micrometers along the sample plane, at low temperature ( K). When the temperature is increased, the dipolar exciton propagation exhibits a drastic shrinking of extension, in the form of a horizon which corresponds to the distance at which the radiative recombination rate becomes smaller than the nonradiative one. Fittings of the experimental results in the framework of the drift-diffusion model suggests the domination of diffusion over the drift induced by dipole-dipole repulsion.
II Samples
| Sample name | A | B | C |
| QW width (nm) | |||
| Al (%) | |||
| Inner barrier | Al0.2Ga0.8N | AlN | - |
| F (kV/cm) | |||
| (s) | |||
| (eV cm-2) | |||
| (cm-2) | |||
| (eV) |
The three samples under study were grown by molecular beam epitaxy (MBE) on c-plane oriented sapphire substrates followed by a m thick GaN buffer layer. Their main characteristics are summarized in Table 1. For sample A, the active zone consists of a nm thick Al0.20Ga0.80N barrier, a nm ( atomic monolayers) GaN QW followed by one monolayer of Al0.20Ga0.80N, a nm ( atomic monolayers) GaN QW and a nm thick Al0.20Ga0.80N cap layer. This sample can alternatively be described as a nm-wide GaN/Al0.20Ga0.80N QW, in which an ultrathin barrier of Al0.20Ga0.80N has been placed at the location where the envelope functions of the electron and the hole overlap most weakly. In such structures, the overlap is further decreased and the radiative lifetime is enhanced, but with a limited impact on the exciton binding energy. Sample B was fabricated following the same concept of a nm-wide QW containing a -monolayer barrier, but the latter was made of AlN, instead of Al0.20Ga0.80N. For sample C, the active zone consists of a nm thick Al0.15Ga0.85N barrier, a nm ( atomic ML) GaN QW and nm thick Al0.15Ga0.85N cap layer. Sample C was also studied in Ref. 35. Its low-temperature exciton lifetime was determined as s. For samples A and B, using similar experimental conditions as in Ref. 35 and a laser repetition rate of kHz, we measured characteristic decay times of and s respectively. As for Sample C (Ref. 35), the PL spectra of Samples A and B peak at much lower energies than the bulk GaN exciton. They also exhibit intense optical-phonon replica, which is another consequence of the strong on-axis dipole.[37, 31, 38]
II.1 Excitonic energy and radiative lifetime versus excitonic density
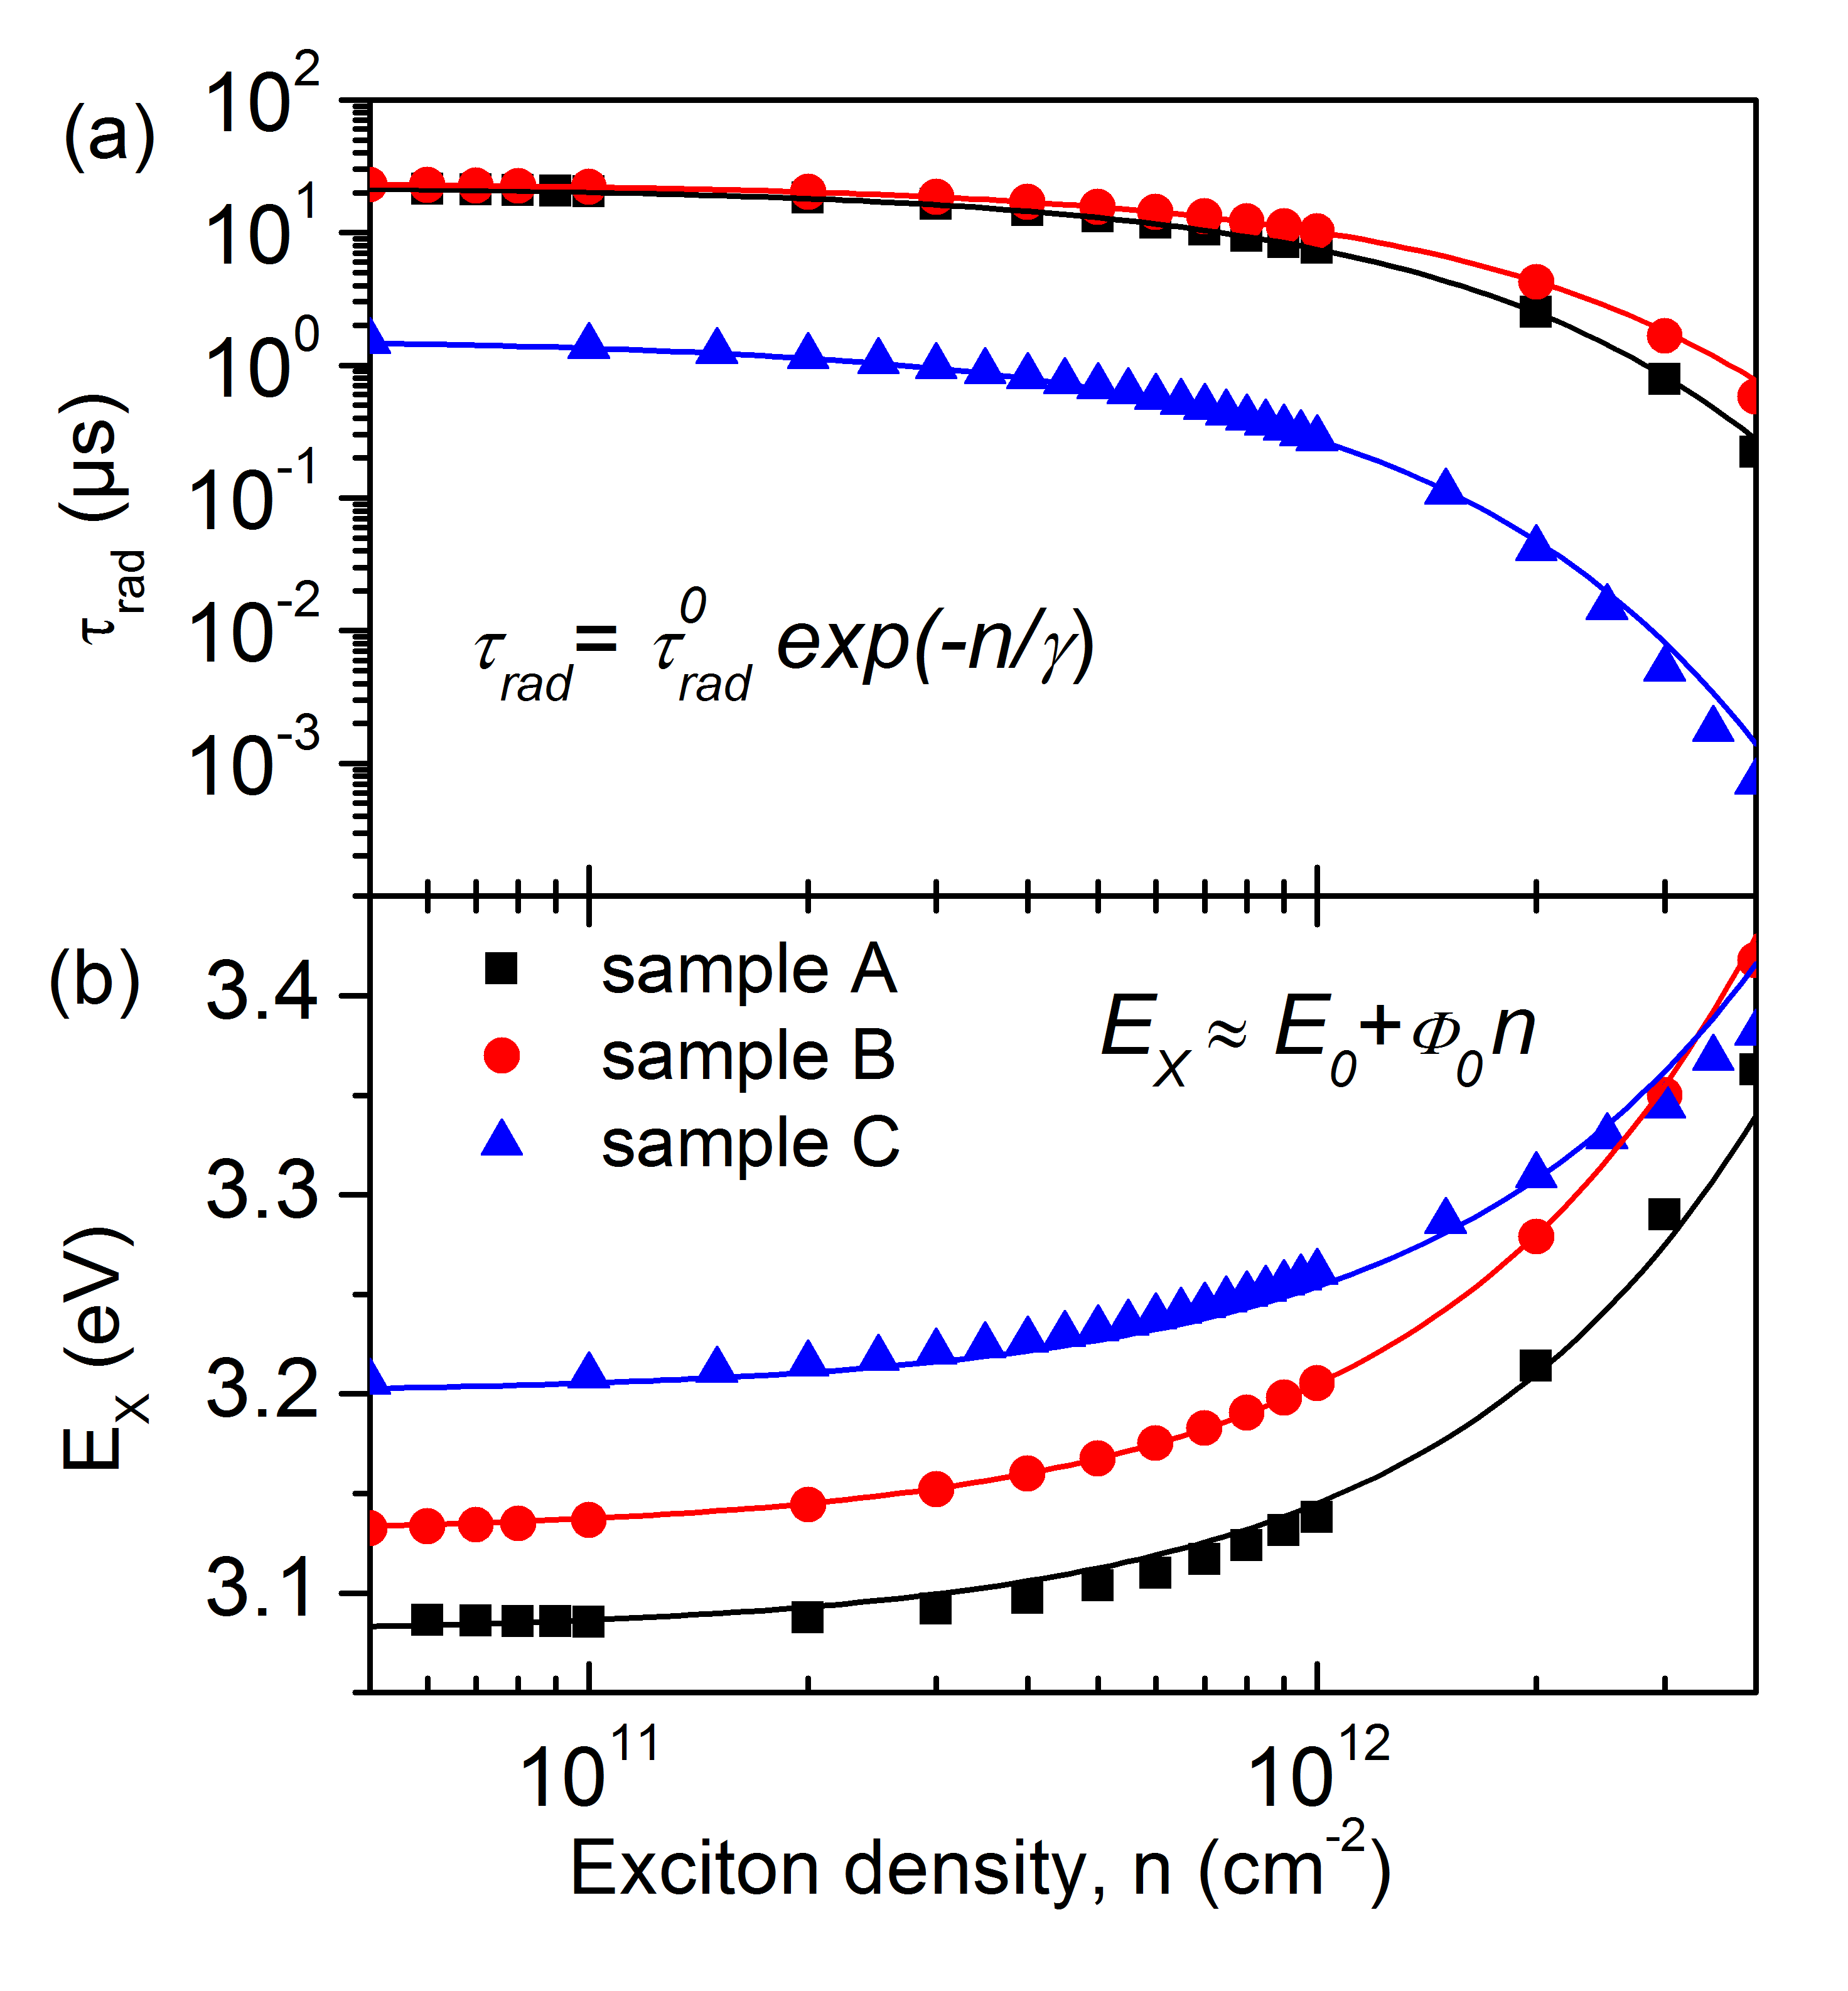
To describe the transport of indirect excitons quantitatively, we need to establish a correspondence between the density of dipolar excitons and the blue shift of the optical transition. For this purpose, we solve numerically the coupled Schrödinger-Poisson equations by the self-consistent procedure described in Ref. 35. Above a Mott density of cm-2, many body effects and band gap renormalization are known to influence the density induced blue shift, as explained in Ref. 35, introducing a simplified, phenomenological model for the additional terms to the field screening effects. Recently, a more thorough discussion and modeling of those many-body interactions has been published. [39] In the measurements reported below, we will be only weakly concerned by densities exceeding cm-2. Thus, we use the phenomenological approach of Ref. 35 to establish the density dependence of the blue shift. A typical result is shown in Figure 1, for low (a) and high (b) exciton densities. The blue shift from the zero-density exciton transition can be observed at high density, as well as the increasing overlap of the electron and hole wave functions. Note also the strongly curved potential profile. The local electric field is not constant along the growth axis, making our calculation far more accurate than others which assume a constant electric field, rigidly altered by static charges distributed as Dirac functions at each interfaces. The values of the built-in electric field at zero exciton density are given in Table 1 for each sample.
Using this approach, we calculate the blue shift of the optical transition as a function of the exciton density for each sample (Fig. 2(b)). The dependence between the two quantities is nearly linear and the exciton energy can be approximated by:
| (1) |
where the self-induced potential is the fitting parameter. Thus, from the experimentally determined PL blue shift we can deduce the IX density.
The radiative lifetime is inversely proportional to the squared overlap integral of the electron and hole envelope functions, and can be calculated as a function of the exciton density (Fig. 2(a)). The resulting density-dependent lifetime for all the samples is well described by an exponential
| (2) |
where is the fitting parameter. is measured by macro-PL measurements of the ultimate decay time constants, measured at low temperature and at long delays. The resulting parameters are reported in Table 1 for the three samples.
III Experimental setup
For micro-PL experiments, the samples were placed in a cryostat and excited by a nm continuous-wave laser (Crylas/FQCW ) through a microscope objective. This objective collects the PL signal in such a way that the image of the sample surface is reproduced at the entrance of the spectrometer, where it is filtered by a vertical entrance slit. The spectrometer is equipped with a grating with gr/mm blazed at nm. The detector is a cooled CCD camera with pixels. The pixel size is m, which corresponds to nm on the sample surface. This value matches the smallest laser spot diameter that our objective can provide ( nm), thus allowing for an overall spatial resolution of m. This setup provides a direct spatial imaging of the luminescence with a spectral resolution. Two-dimensional images, with spectral resolution, were obtained by scanning horizontally the lens which ensures the focusing onto the same entrance slit. The excitation power density was estimated as P MW/cm2.
PL experiments combining time and spatial resolution are based on the same setup, except that the detector is a Hamamatsu streak-camera (model C equipped with an S photocathode and UV coupling optics), enhanced for ultraviolet detection. This camera can reach an ultimate time-resolution of ps but, for the time-windows explored in this study, this resolution was rather of ps. Pulsed laser excitation at nm, through the same microscope objective, is provided by the frequency-tripled tunable radiation from a Titanium-Sapphire cavity, with typical pulse duration of fs and tunable repetition rate. For the present ultra-slow decays, we set this rate to kHz with an average power density 0.1 MW/cm2.
IV Experimental results
IV.1 Low-temperature PL
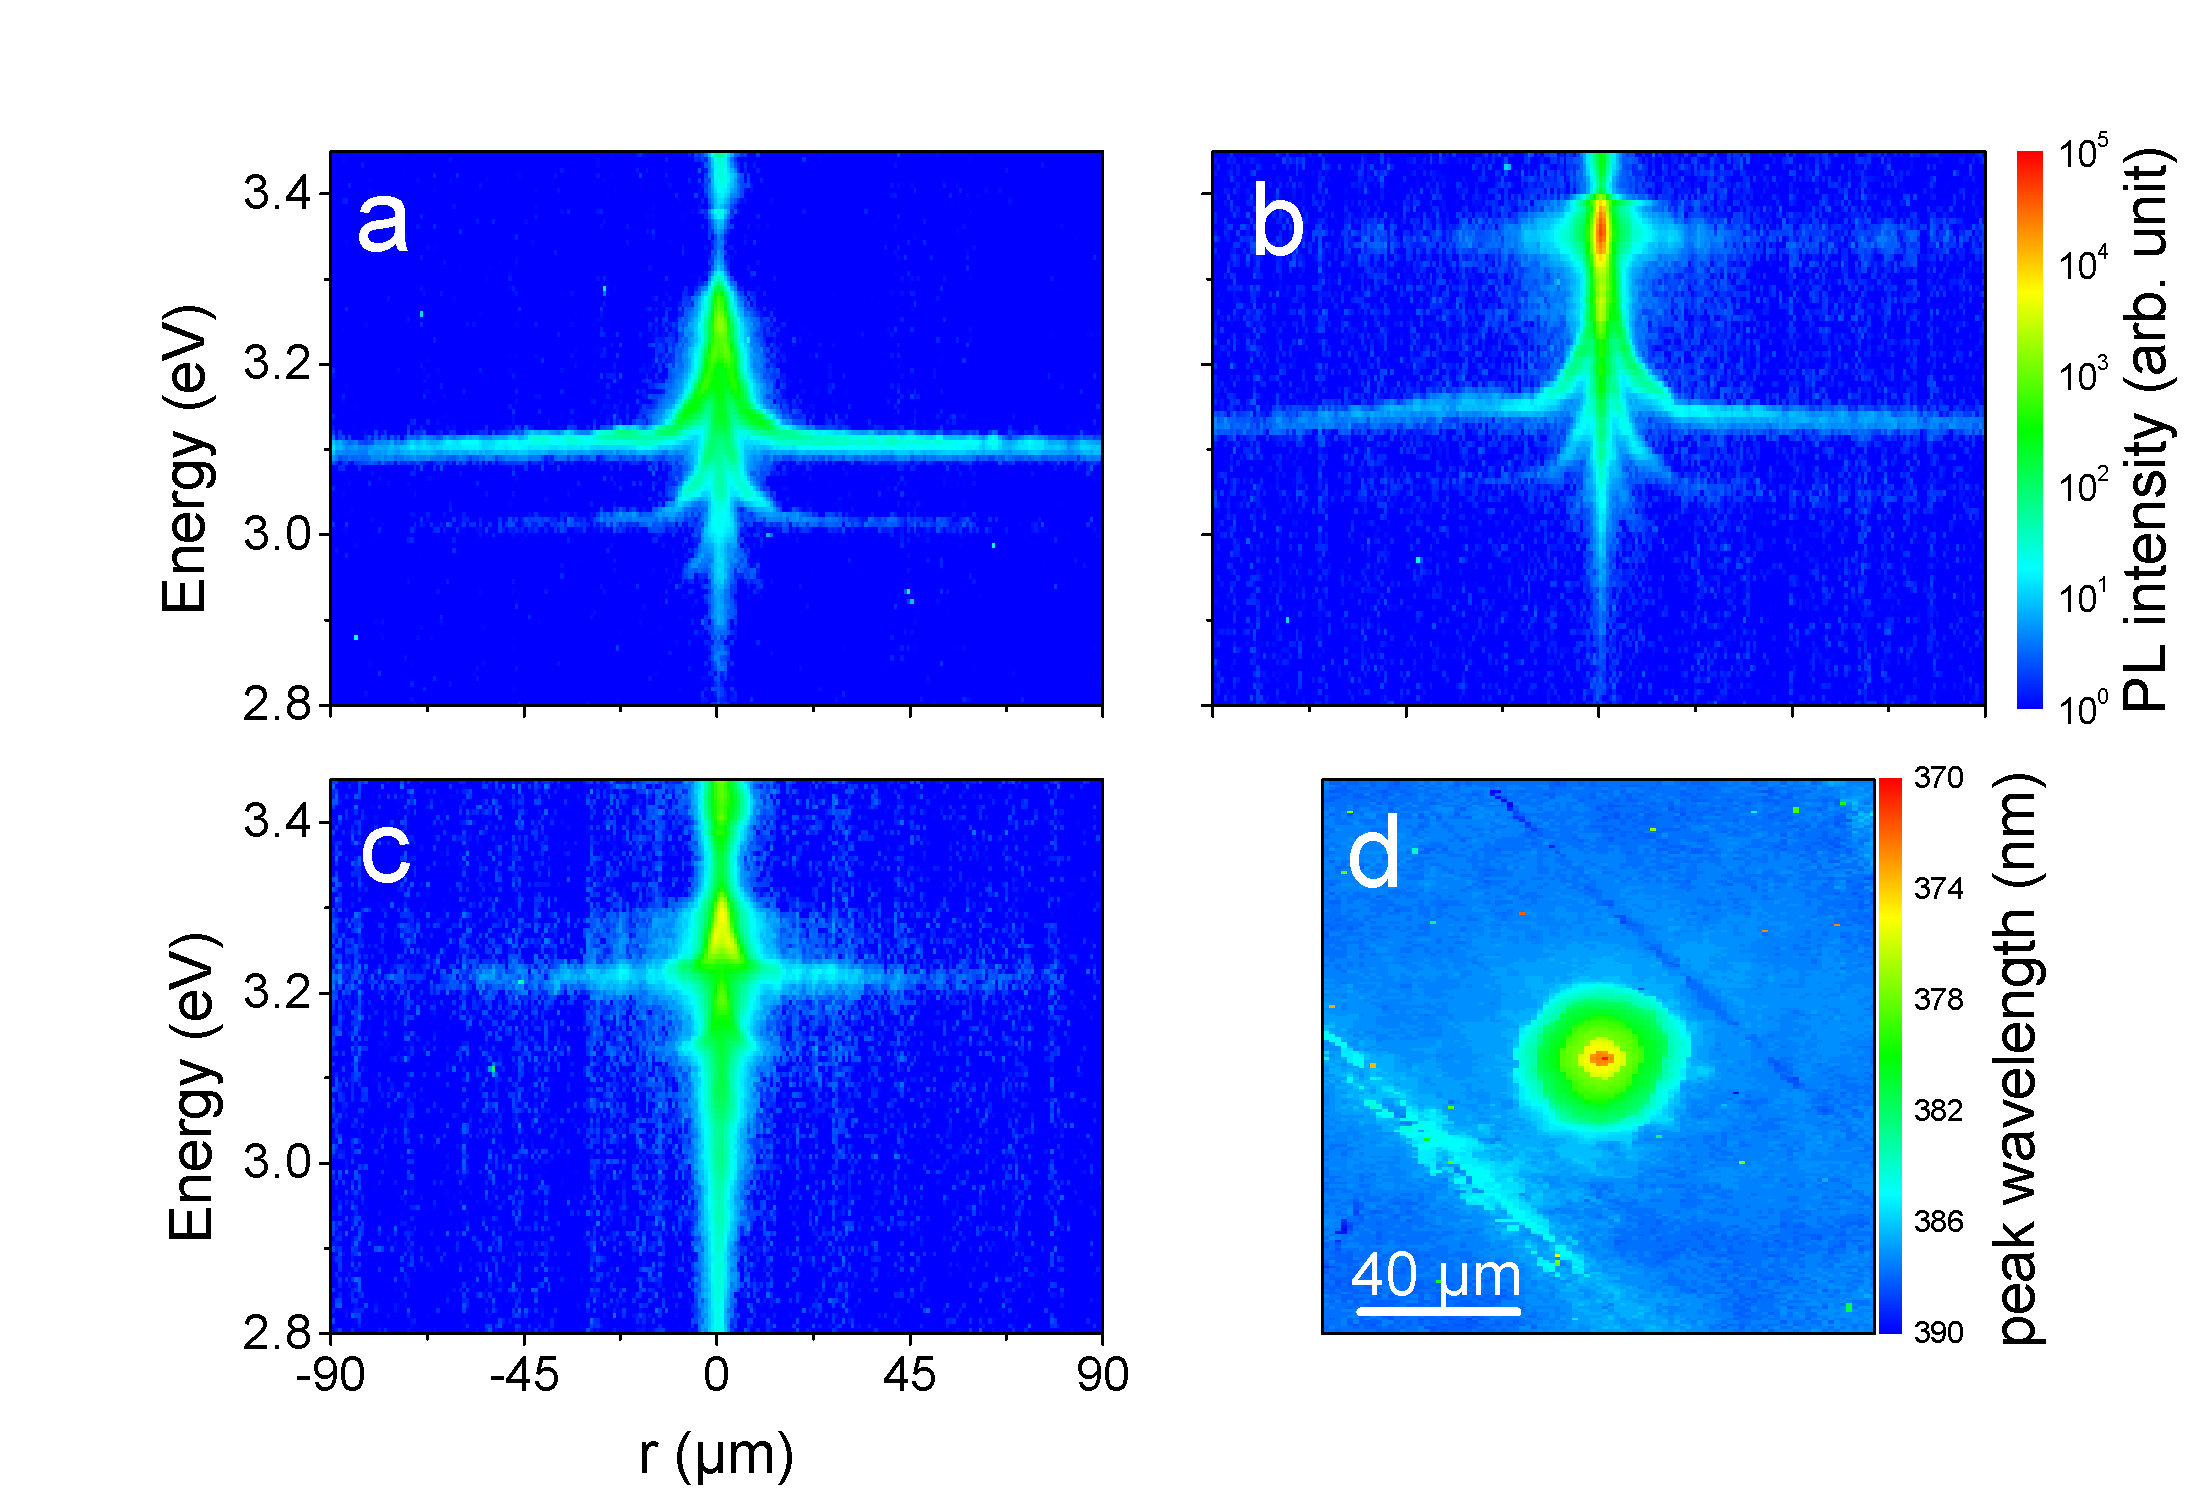
Figure 3(a-c) shows typical images of spatially and spectrally resolved PL obtained at T = K for Samples A, B and C. The PL intensity is measured at different distances from the excitation spot (horizontal axis) and at different photon energies (vertical axis), in the presence of the strongly focused excitation at at power density . The dominant PL line, at higher energy, corresponds to the zero-phonon excitonic recombination. Optical phonon (LO) replicas of this PL line appear at lower energies, separated by multiples of meV. As far as the spatial dependence is concerned, these replica follow the energy variation of the main zero-phonon line. In the following we will focus on the zero-phonon emission line. Close to the excitation spot, the PL energy is blue shifted up to values close to the GaN excitonic gap eV. The maximal blue shift, observed at , is larger than eV for Samples A and B, see Figure 3(a-b), and close to eV for Sample C, see Figure 3(c). However, the determination of the exact blue shift at m is less accurate than for the rest of the sample surface, because the observed PL spectra are quite broad, owing to multi-excitonic effects, and other many-body interactions. [39] At m, the -dependence of the PL maximum has the shape of an arrow, characterized by a decrease of the blue shift accompanied with a decrease of intensity (note the logarithmic color-encoding of the intensity). This emission profile will be referred to as the arrow-shaped pattern.
At longer distances ( m), the PL energy is nearly constant, but the signal persists at surprisingly long distances. For Samples A and B, we observe excitonic emission up to m away from the generation spot. For Sample C, with the smallest initial energy shift, the excitonic emission is still observable up to several tens of m away from the excitation spot.
Figure 3(d) displays a color map of the QW peak emission wavelength as a function of the real-space coordinates () on the surface of Sample B. The above-mentioned central arrow-shaped region appears to be of circular symmetry, with a radius of m. Then the PL peak wavelength remains nearly constant over distances as large as m. Note that this wavelength is slightly altered by the presence of linear microscopic defects (cracks), most certainly owing to local variation of barrier composition and/or strain field, near such defects. Careful examination of Figure 3(a-c) also emphasizes small but reproducible fluctuations of both intensity and PL energy shift, when moving away from the excitation spot. We attribute these features to local fluctuations of barrier composition and/or strain, which modify the local accumulation of excitons and therefore their energy.
IV.2 Temperature dependence of continuous-wave PL
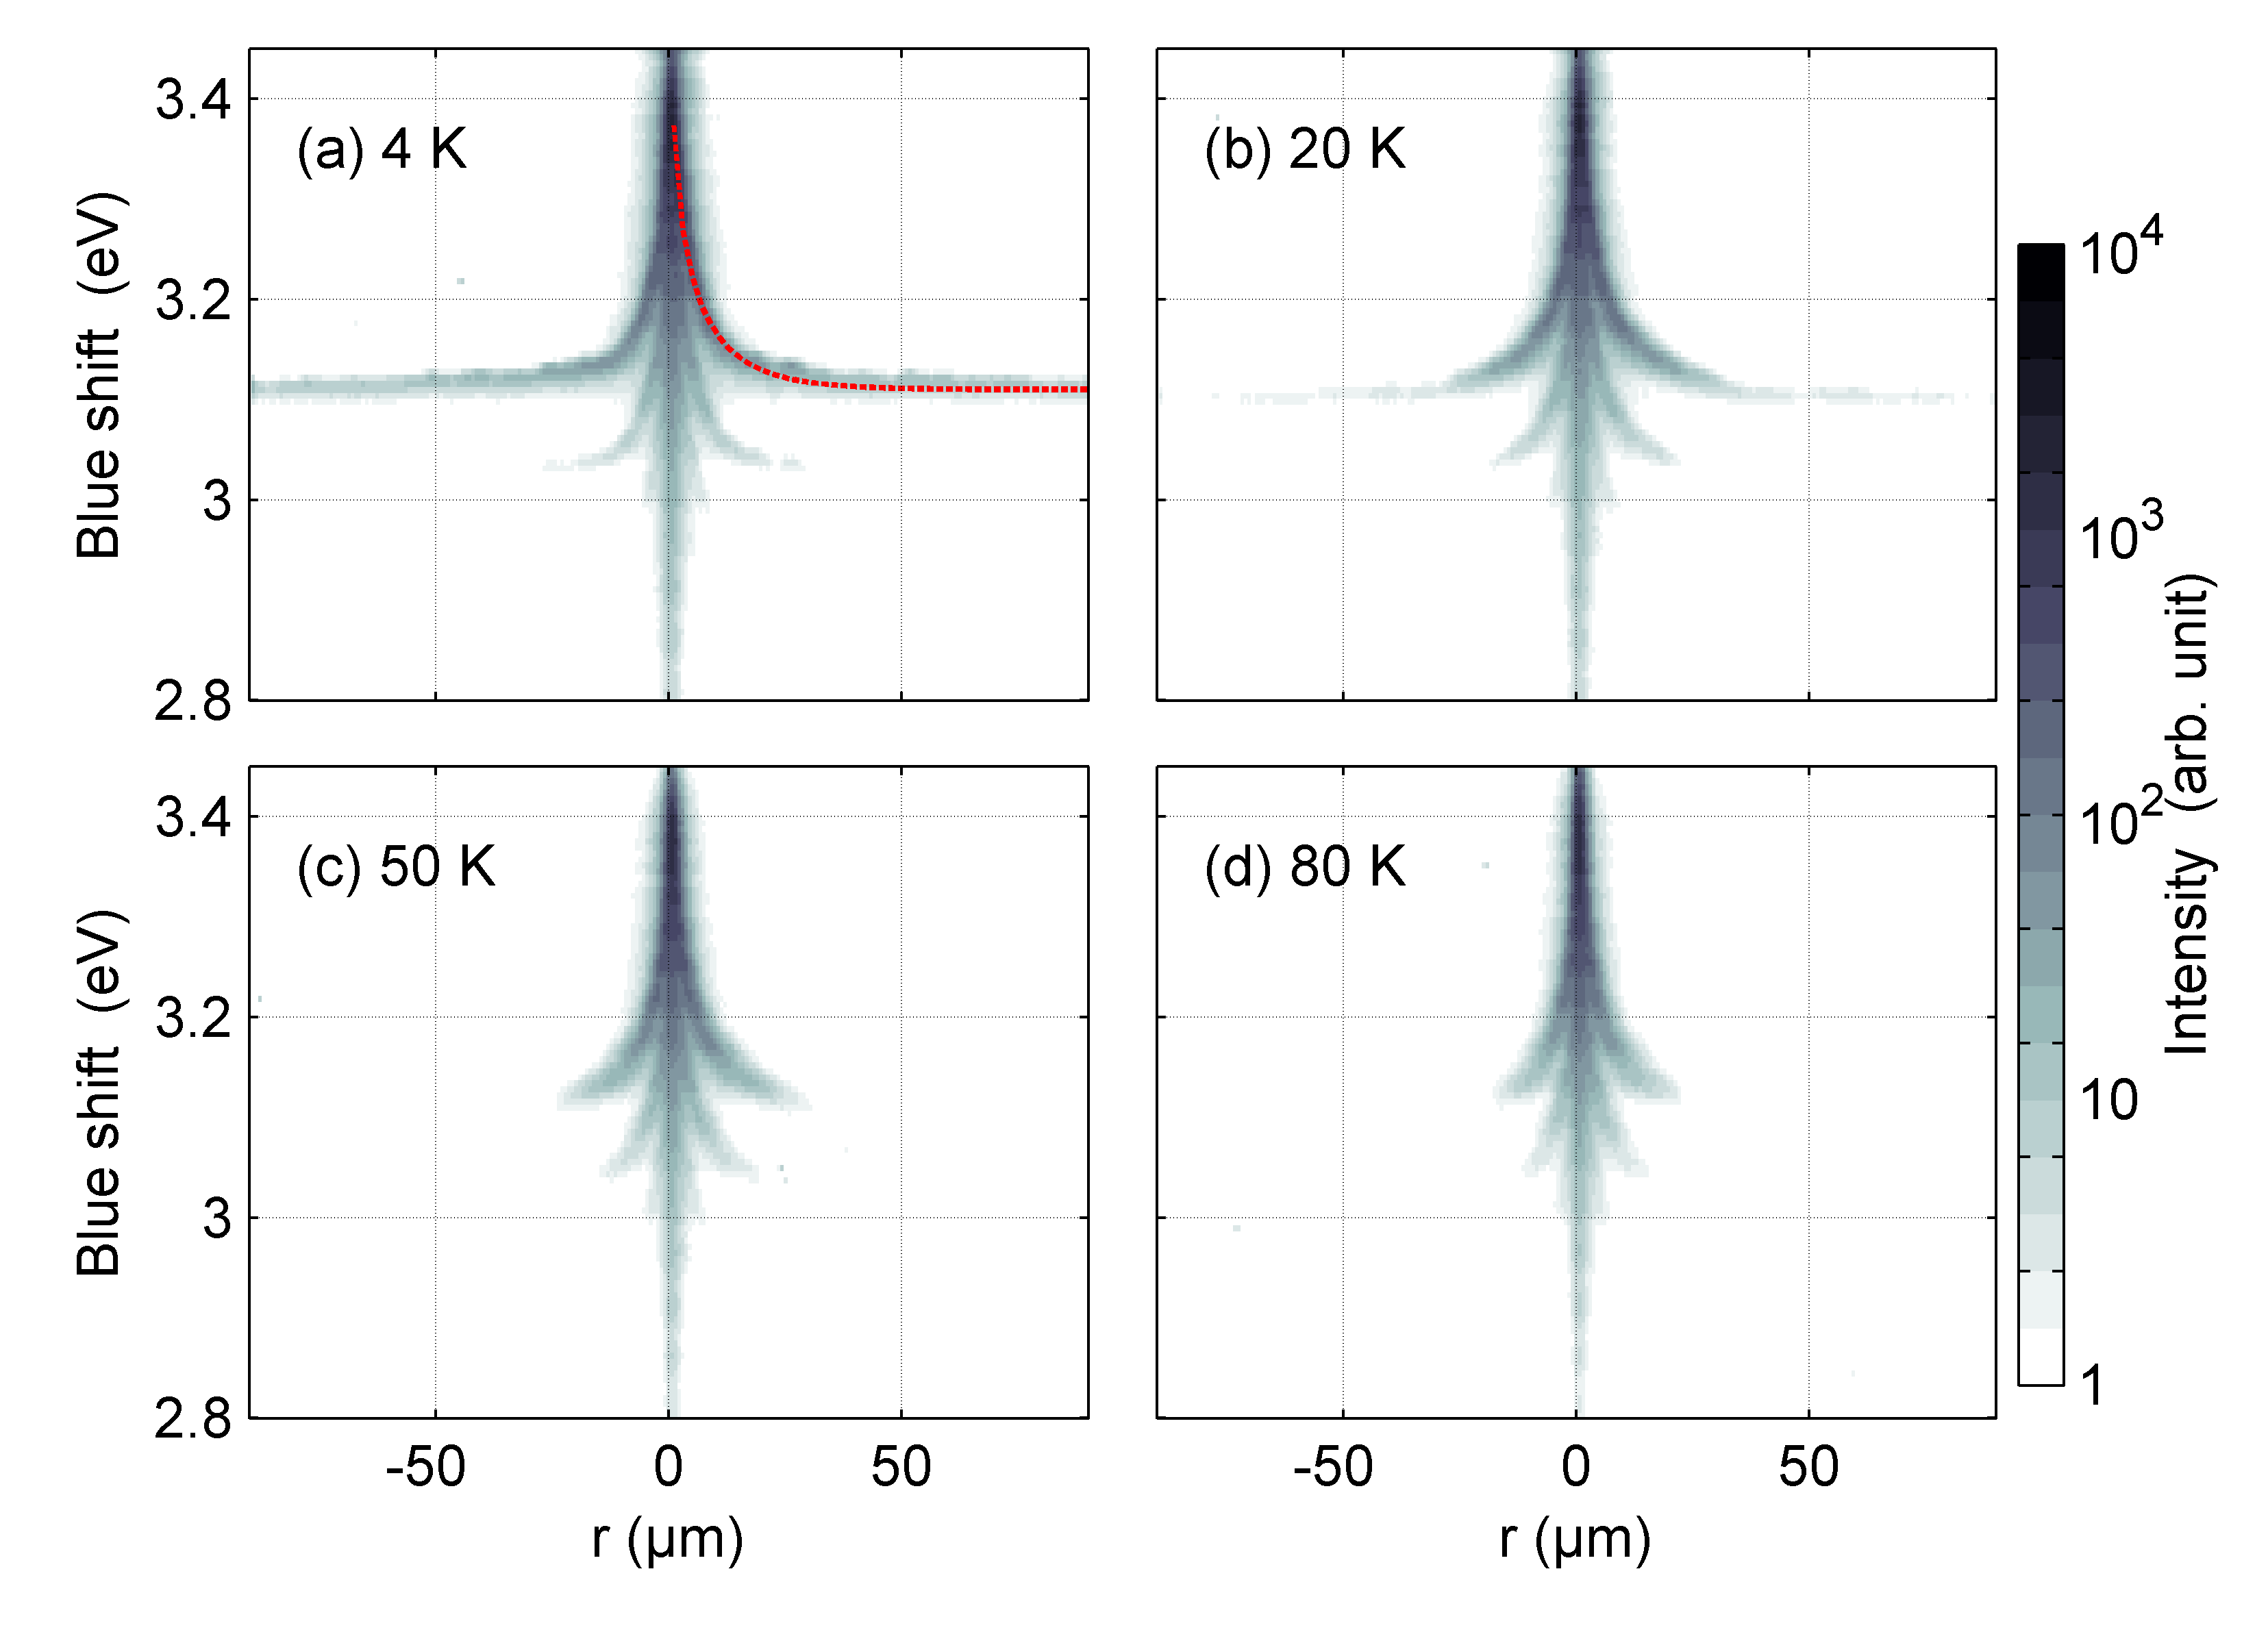
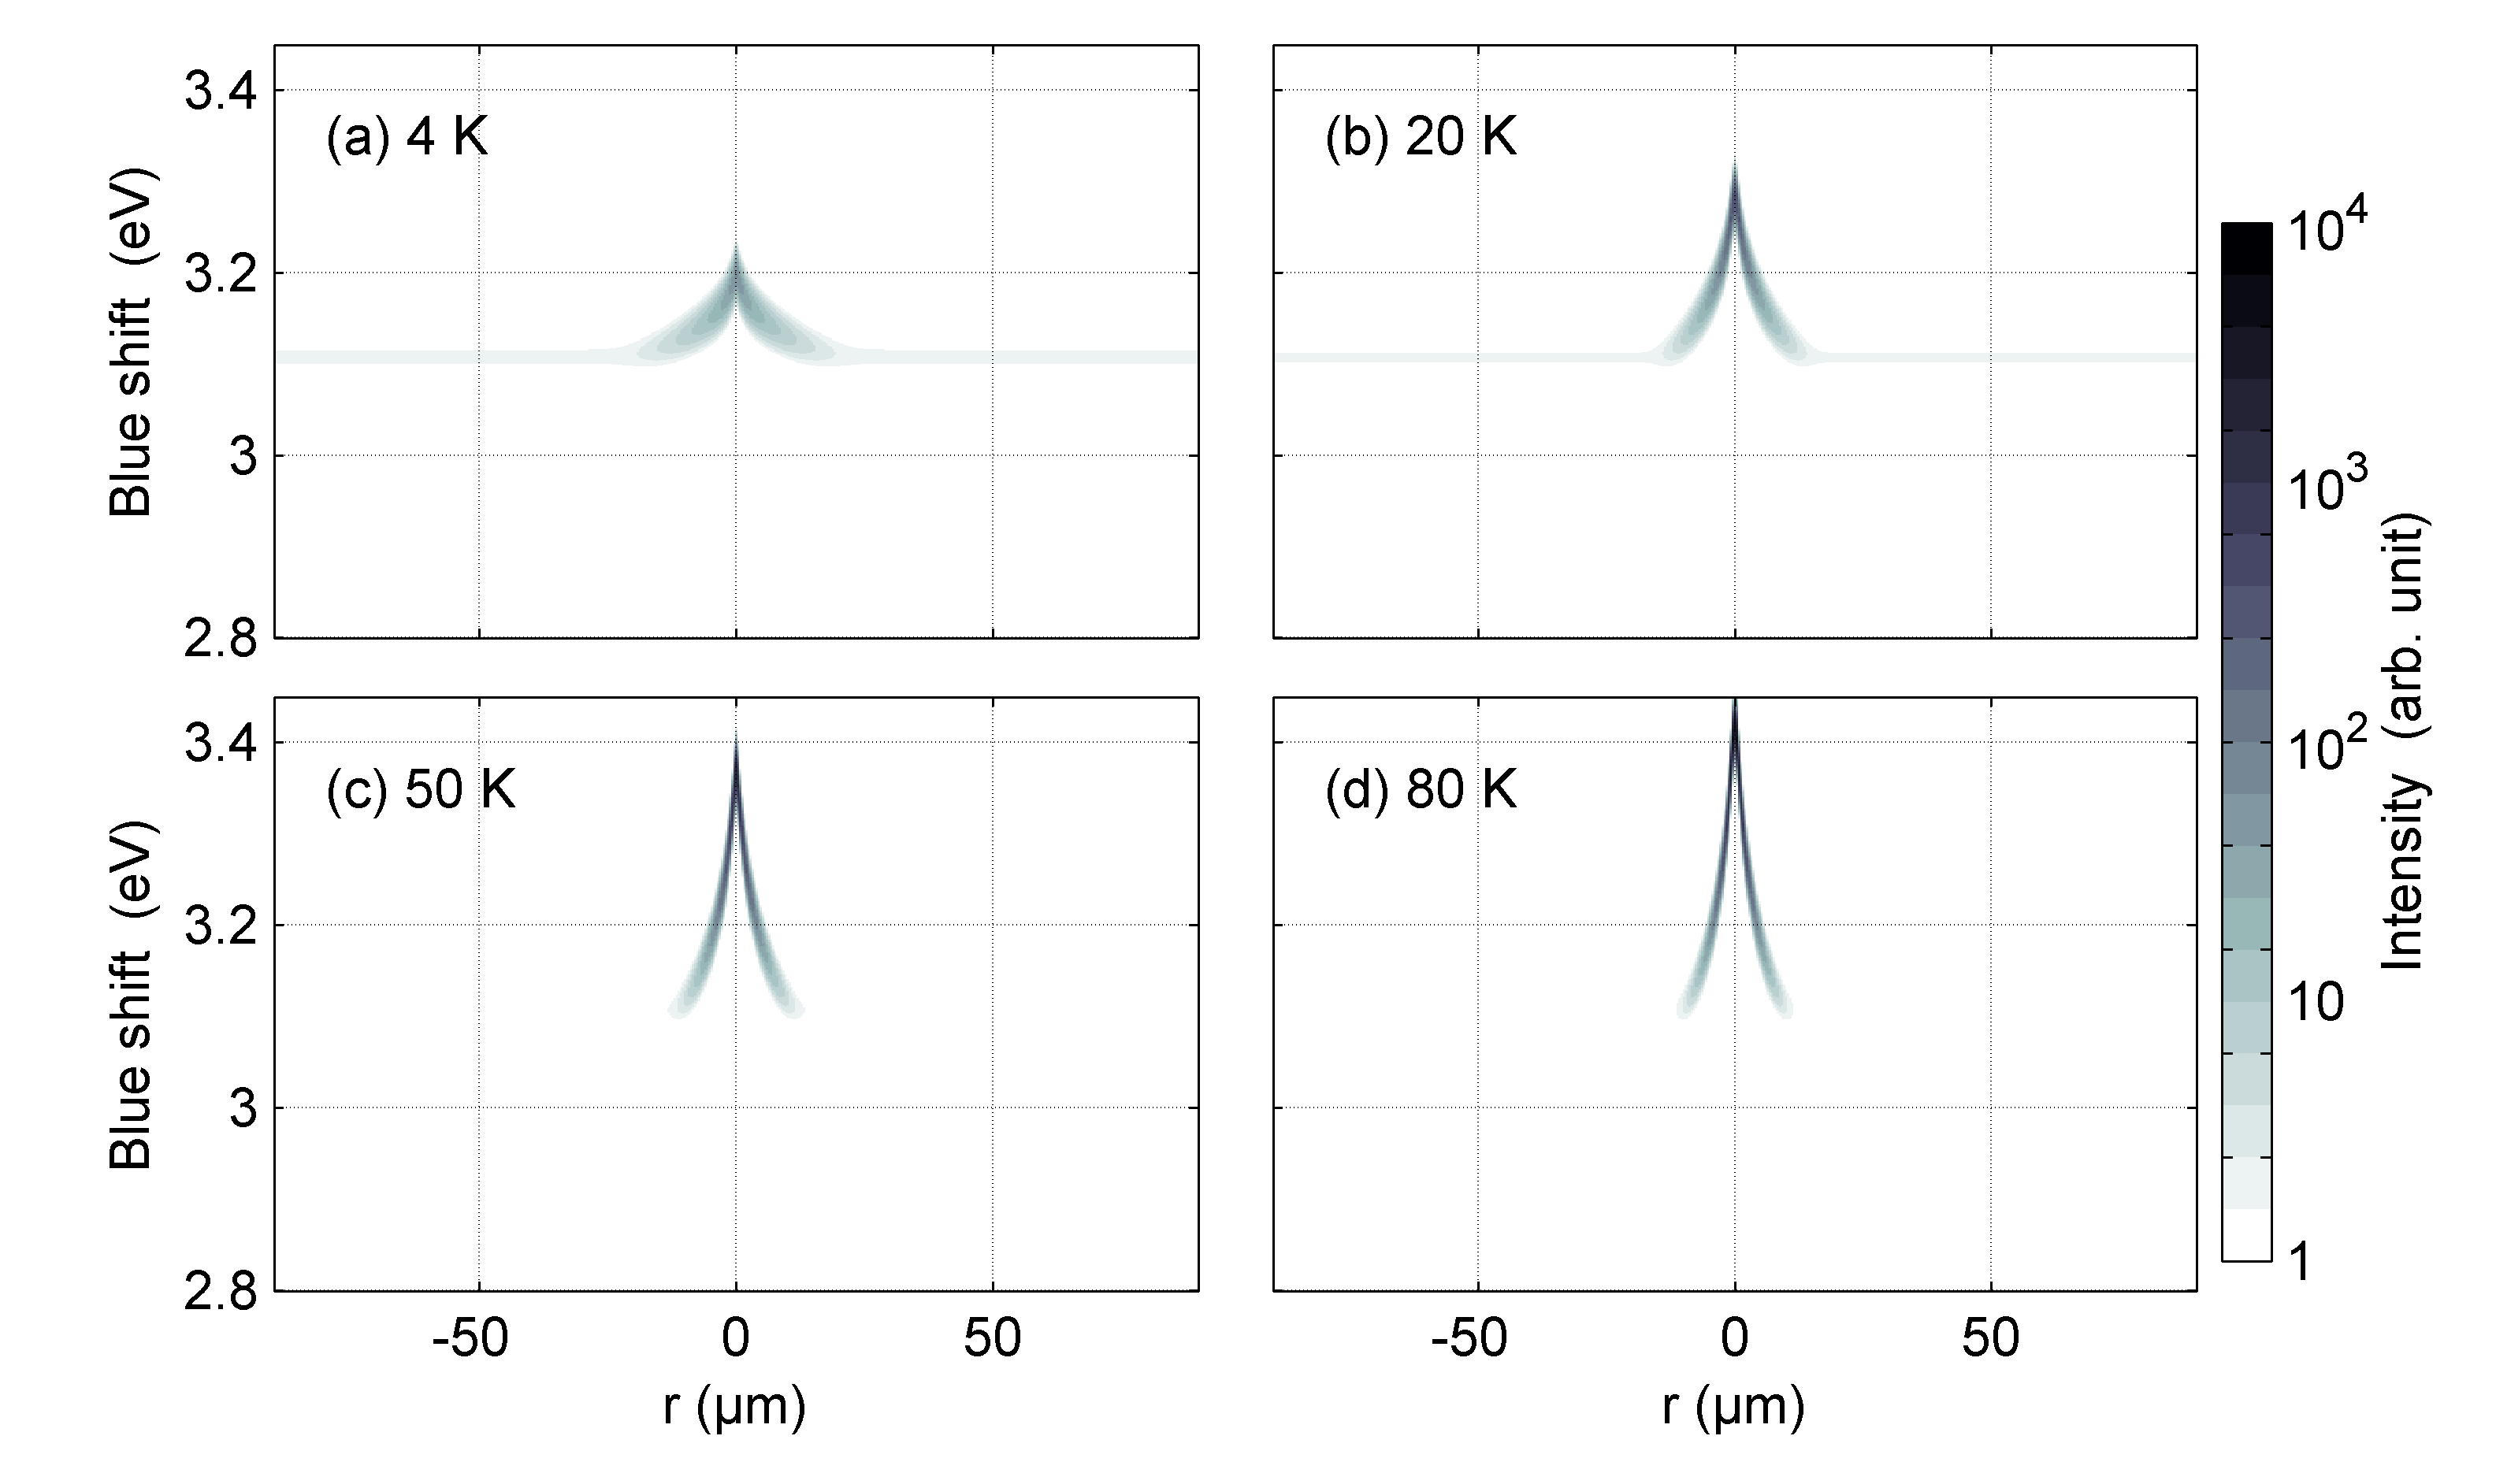
Figure 4 shows the temperature dependence of the spatially-resolved PL spectra for Sample A, obtained at power density P0. One can observe the shrinkage of the spatial extension of the PL, when the temperature is increased. The PL signal falls below the detection threshold of the setup above a critical distance. This critical point can be referred to as an emission horizon, and it gets closer to the excitation spot as the temperature is increased.
IV.3 Time-resolved experiments
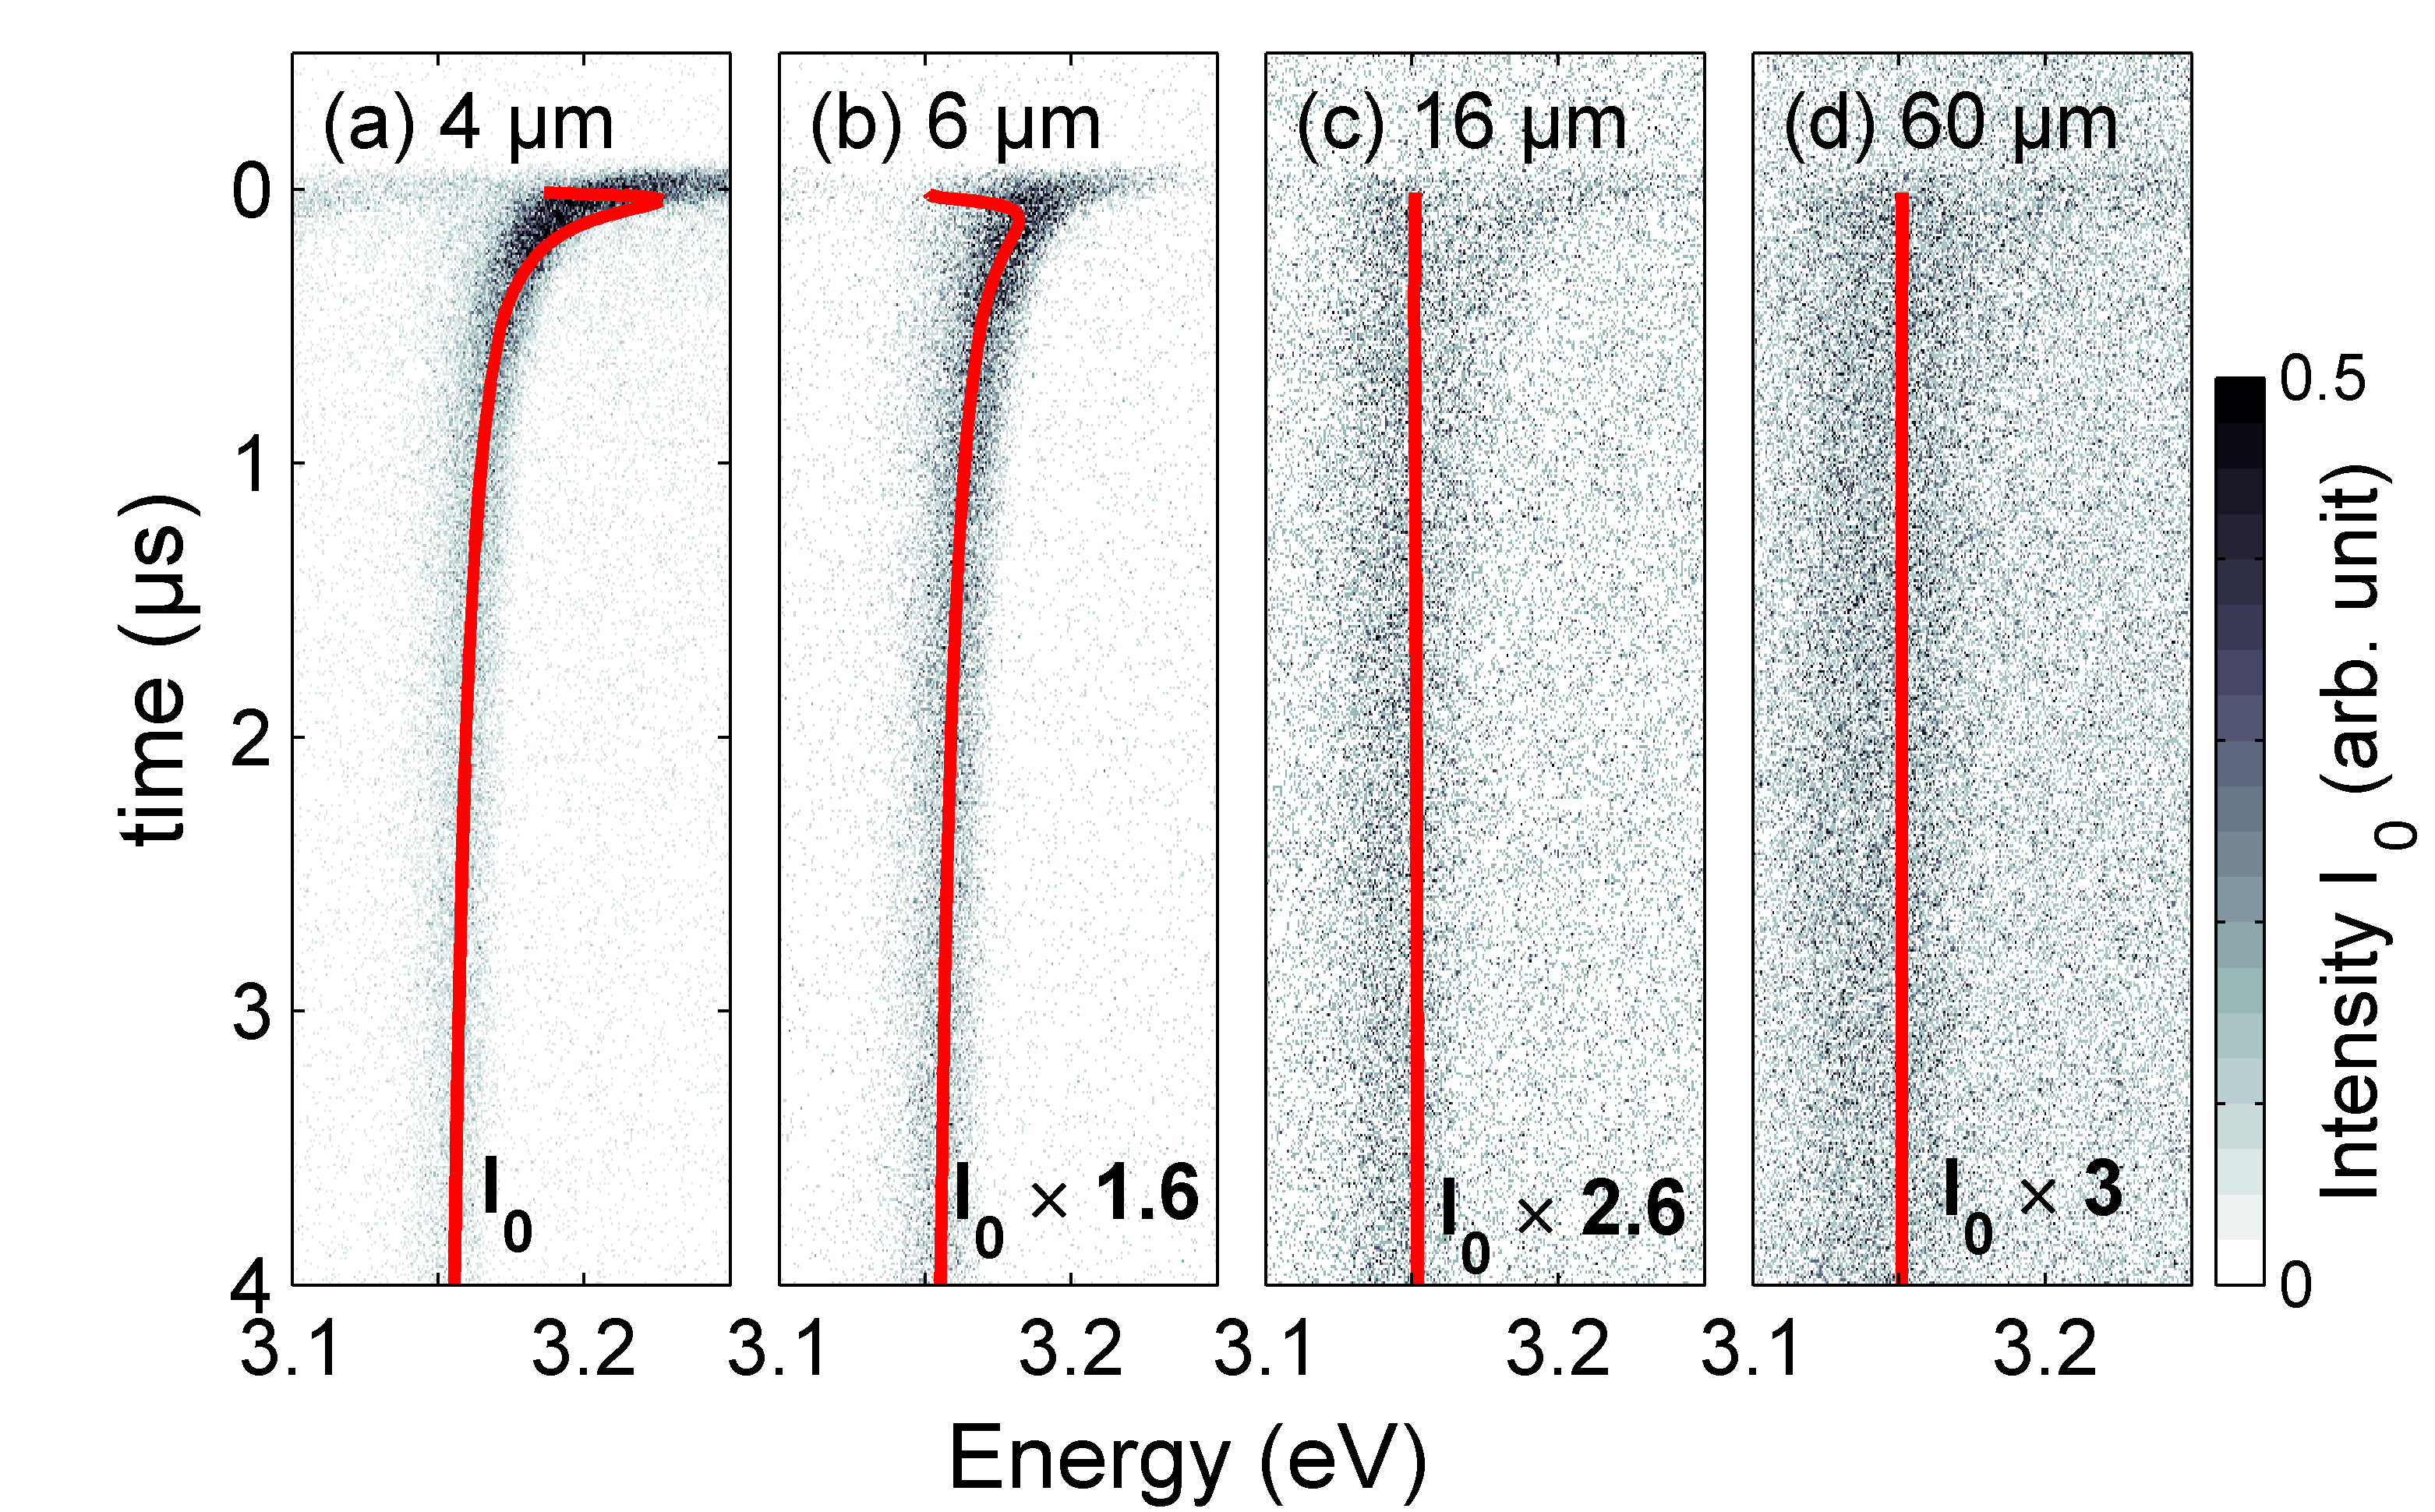
To get a deeper insight into the dynamics of exciton propagation, we performed low-temperature time-resolved PL experiments. By conjugating the temporal slit of the streak-camera to a given point on the surface sample, we are able to record the PL intensity collected at a given energy and at a given delay. Figure 5 shows examples, in the case of Sample A, of such time-dependent PL spectra, gathered at different distances from the excitation spot. The time-domain has been restricted, here, to the first microseconds of decay, but we have also measured such decays over a full time range of s, and we have examined, too, the first ns after the excitation time.
In the vicinity of the excitation spot (Figure 5(a)), the observed dynamics is the same as in spatially integrated experiments:[35] less than 50 ns after the excitation pulse, there is a sudden blue shift of the PL emission which results from the fast creation of dipolar excitons. Then, the exciton population decays and the PL peak energy decreases, until it reaches a steady value. Only in the latter regime, the intensity time-decay becomes exponential and provides us with the decay times that we gathered in Table 1. As we increase the distance between the observation and the excitation spots (Figure 5(b)), we observe the same kind of behavior, but with a smaller initial blue shift: lower exciton densities are reached, consistent with the continuous-wave PL results. It can still be argued that the time needed to propagate over m is shorter than the time resolution available in these experiments. However, the most puzzling results are those obtained above m (Figure 5(c-d)). Indeed, even at these large distances, the PL signal builds up within a few nanoseconds after laser excitation. This observation proves that, for distances larger than - m, the observed exciton recombination can in no way arise from the propagation of those excitons, at least in the sense of a classical drift/diffusion process. As discussed in the next section, no reasonable diffusion coefficient can explain such a fast arrival of excitons far away from the excitation spot. However, the quenching of the PL tail observed at high temperatures indicates the excitonic origin of this signal. We suggest that this observation results from the direct optical creation of secondary excitons, probably by the intense luminescence emitted under the laser spot and guided along the sample plane.
V Discussion and modeling
V.1 Origin of the arrow-shaped micro-PL pattern.
The arrow-shaped pattern apparent in Fig. 3(a-c) is a signature of the decreasing density of excitons, when the distance from the excitation spot increases. The dipole-dipole repulsion between excitons pushes them away from the excitation spot. Exciton propagation, accompanied by recombination, results in a decreasing exciton density. Generation, diffusion, drift, localization, radiative and nonradiative recombination are the competing mechanisms that we need to unravel, in order to model quantitatively our observations. We will assume that the blue shift directly reflects the local exciton density, whereas the PL intensity also results from the competition between radiative and non-radiative recombination processes. The spatial dependence of the blue shift, observed less than 20 m away from the excitation spot, appears to be temperature independent below K, within our experimental resolution. Since drift mechanisms are typically temperature dependent because of the Einstein relation, we can first infer that either the thermalization is not complete below =50 K for short propagation distances, or that the exciton drift plays only a minor role here, due to the complex multiscale disorder potential.
The simplest way to reproduce the arrow-shaped diffusion pattern is to consider the diffusion of excitons generated by a delta-peaked excitation pulse at . Let us assume a constant diffusion coefficient and a constant recombination rate . Far from the excitation spot, the steady state diffusion equation is reduced to . This equation has an analytical solution: = , where is a constant and is the modified Bessel function of the second kind. This solution with eV and m is shown by the red curve in Fig. 4(a) that we superposed onto the PL map. Even though we know that this model is based on the un-satisfied assumption of a constant exciton lifetime and a constant diffusion coefficient, it reproduces reasonably the overall shape of the PL spatial dependence.
V.2 Origin of the PL tail
A model based on purely diffusive propagation of IXs can, in principle, reproduce both the PL arrow-shape and the absence of temperature dependence, for m. On the other hand, the tail of the PL line, for m cannot be reproduced by diffusion of excitons, because it would imply an anomalously high diffusion constant. Indeed, time-resolved measurements of PL at 60 m from the excitation spot indicate that excitonic emission builds up in less than 100 ns after the excitation pulse (Fig. 5(d)). This cannot either be reproduced by the exciton drift, because of the weak exciton density gradient observed at m. We therefore suggest that a significant part of the higher-energy photons emitted around by the QW itself is guided along the sample plane and is capable of creating, at larger distances, secondary excitons. Let us now address the temperature dependence of this emission and the reduction of the horizon. First of all, a common property of III-nitride-based heterostructures is a high density of nonradiative recombination centers (which are mainly threading dislocations), of the order of cm-2. This is the case in the present heteroepitaxial QWs. Therefore, as the temperature delocalizes IXs, it also enhances the rate of their capture by those nonradiative traps. Given the very large values of the radiative lifetimes in our samples, at least in the unscreened regime at m, the competition between slow radiative and faster nonradiative recombinations explains why PL signals are quenched, when the temperature is increased, for distances exceeding a certain horizon. This horizon is simply determined by the exciton nonradiative recombination rate, which increases with the temperature.
V.3 The transport equation
In this section, we describe a formal model for the exciton propagation. In first approximation we neglect the thermalization effects and consider that excitons are close to the lattice temperature as soon as they leave the excitation spot. The equation for the in-plane transport of indirect excitons is:[40]
| (3) |
where is the exciton density, and are the generation and recombination rates, respectively, is the IX current density, which can be split into drift and diffusion components: .
The diffusion current is given by:
| (4) |
where is the exciton diffusion coefficient. The random disorder potential, caused by alloy disorder in the barrier and by QW width fluctuations, hinders the in-plane exciton propagation along the GaN/AlGaN QW plane.[41] For high exciton densities, however, the potential fluctuations are screened and excitons, on average, become more mobile. This effect can be taken into account in the framework of a thermionic model,[42] which gives the following density dependence:
| (5) |
where is the diffusion constant in the absence of disorder and is the amplitude of the disorder potential at zero density. This formulation implicitly accounts for the modification of the fluctuation potential by screening of the internal electric field. [42] We estimate meV, which corresponds to the energy shift induced by a fluctuation of one monolayer in the QW width. represents the free exciton bulk diffusion coefficient, which is reached when the disorder potential is negligible compared to the blue shift and/or the thermal energy .
The drift term in Eq. 3 can be tentatively rewritten as:
| (6) |
where the exciton mobility is connected to the diffusion coefficient via the Einstein relation:
| (7) |
In Eq. 6, the drift is governed by the self-induced potential only. We expect this relation to be valid only when , i.e. when the disorder potential is efficiently screened.
The generation term which appears in Eq. 3 will be divided into two parts: . The first term corresponds to the exciton generation under the laser spot:
where is the distance from the center of the excitation spot, = 500 nm is the spot radius, is the exciton generation rate. The second term is semi-phenomenological. We introduce it because any attempt to model the ultra-fast appearance of exciton recombination at m within a drift-diffusion model using reasonable diffusion coefficients is doomed to fail. Our current understanding of this phenomenon is that a significant part of the higher-energy photons emitted around are most certainly guided along the sample plane, between the QW and the surface. Despite small absorption coefficients, some of those photons can be re-absorbed in the regions of m and recycled, by thermalization, into low-energy excitons, with densities comparable to, or lower than cm-2. This explains the constancy of emission energy versus , whereas the nearly constant intensity, for m, is consistent with the weakness of the absorption coefficient, i.e. with the vanishing attenuation of the excitation. We therefore introduce a weak background source term to mimic this photon-recycling process. For simplicity, we take it independent of .
The recombination rate can be expressed as a function of the radiative and nonradiative recombination times and :
| (8) |
The density dependent radiative recombination time = is determined according to the procedure described in the Section II.1, and does not depend on the temperature. By contrast, nonradiative time is temperature dependent. Indeed, when either exciton concentration or temperature increases, the excitons delocalization leads to more efficient capture of excitons on the nonradiative defects. These effect gives rise to the quenching of the PL at high temperature and determine the exciton nonradiative horizon.
According to Refs. 43, 44, the density of a exciton flux flowing through a nonradiative recombination center of size , the mean free path, is independent of the shape of the center and equal to , where is the average absolute velocity of the excitons for which a uniform distribution of the velocity direction is assumed. Therefore, assuming that all excitons which reach the recombination center are captured, the rate of exciton capture is proportional to
| (9) |
where is the average distance between the nonradiative recombination centers. Using the relation , where is the momentum relaxation time, we finally obtain the relation:
| (10) |
where , which we will use as an adjustable parameter, is the nonradiative recombination time in the absence of structural disorder .
As the in-plane exciton propagation has a cylindrical symmetry centered at the excitation spot, Eq. 3 reduces to a one-dimensional partial differential equation. For the numerical resolution, we implemented a one-dimensional finite element scheme, where the non-linear Eq. 3 is replaced by a linear one by using the Euler method.[45] For the simulation of the time-resolved experiments, the temporal evolution of the exciton density is calculated within a time-implicit scheme, assuming generation rates and to be non-zero only at the initial time . For the experiments under constant illumination, we take and is time-independent. In both cases we use Neumann boundary conditions at and m. Finally, the PL intensity is obtained from the exciton density as .
| 1 | 1 | 30 | (a) 1.2 | |
| (b) 1.2 |
V.4 Numerical results and discussion
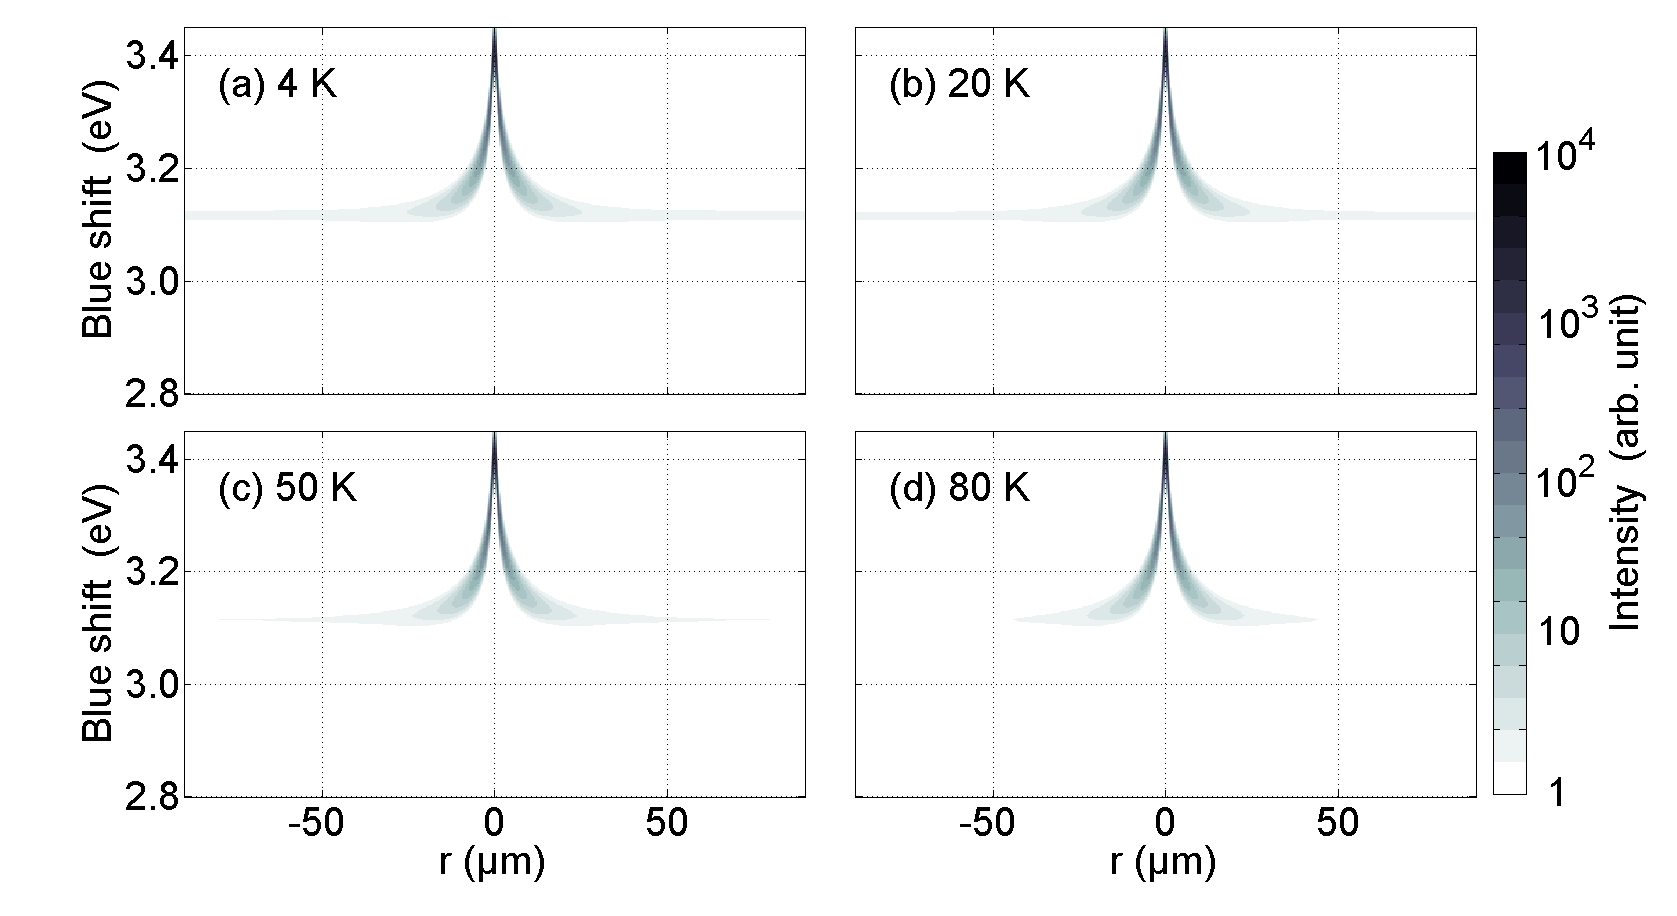
The numerical implementation of the model points out that drift current is not the dominant transport mechanism for excitons. In all our attempts to introduce a drift current, increasing temperature resulted in a progressive shrinking of the spatial extension of the calculated arrow-shaped PL, and an increasing blue shift. Typical results of the simulation for Sample A are reported in Fig. 6. We have introduced the Gaussian broadening of the PL energy with the standard deviation meV, to account for the broadened PL lines. One can see that the arrow-shaped feature is significantly temperature-dependent, in contrast with the experimental result shown in Fig. 4. Similar results have been obtained for the two other samples.
The discrepancy with the experimental data suggests that Eq. 6 strongly overestimates the drift current, probably because the gradient of exciton density induces too small energy variations compared to the disorder amplitude, which can present a complex multi-scale profile. By contrast, when only the diffusion term is included, the simulation gives results strikingly similar to the experiments. The solutions of Eq. 3, assuming , are presented in Figure 7. By using the set of fixed parameters gathered in Table 1 and fitting parameters given in Table 2 we reproduce the emission patterns observed experimentally. The onset of the nonradiative horizon, as the temperature is increased, is well accounted for by the thermionic description of the delocalization-capture of excitons by defects.
This purely diffusive model also allows us to describe the time resolved experiments, using the same set of parameters. The results of the calculation for Sample A is shown by red curves in Fig. 5. One can see that the onset of the PL blue shift associated which exciton diffusion from the excitation spot towards the detection point is probably too fast to be resolved in the present experiments (Fig. 5(a,b)). On the same time, the immediate (in less than ns) onset of the excitonic emission at large distances from the excitation spot has the same origin as the PL tail in the spatially resolved images. It is due to secondary absorption of the PL guided in the sample plane, described by the semi-phenomenological generation term .
The arrow-shaped patterns of PL measured and calculated here are similar to the patterns that have been reported in GaAs CQWs under external gate voltage [46, 3, 40]. However, the typical energy and distance scale are quite different in our structures. In particular, the energy scale of the arrow-shaped feature reaches meV, exceeding by more than an order of magnitude the GaAs values. Modeling of the PL patterns within the exciton drift-diffusion model taking into account the particularities of the nitrides, suggests that even in the highest density and lowest temperature regime exciton transport is dominated by density-activated diffusion, rather than by the drift current. This effect seems to be proper to GaN QWs, but further studies are necessary for its better understanding. In particular the design of heterostructures without guided PL and the resulting emission would be useful.
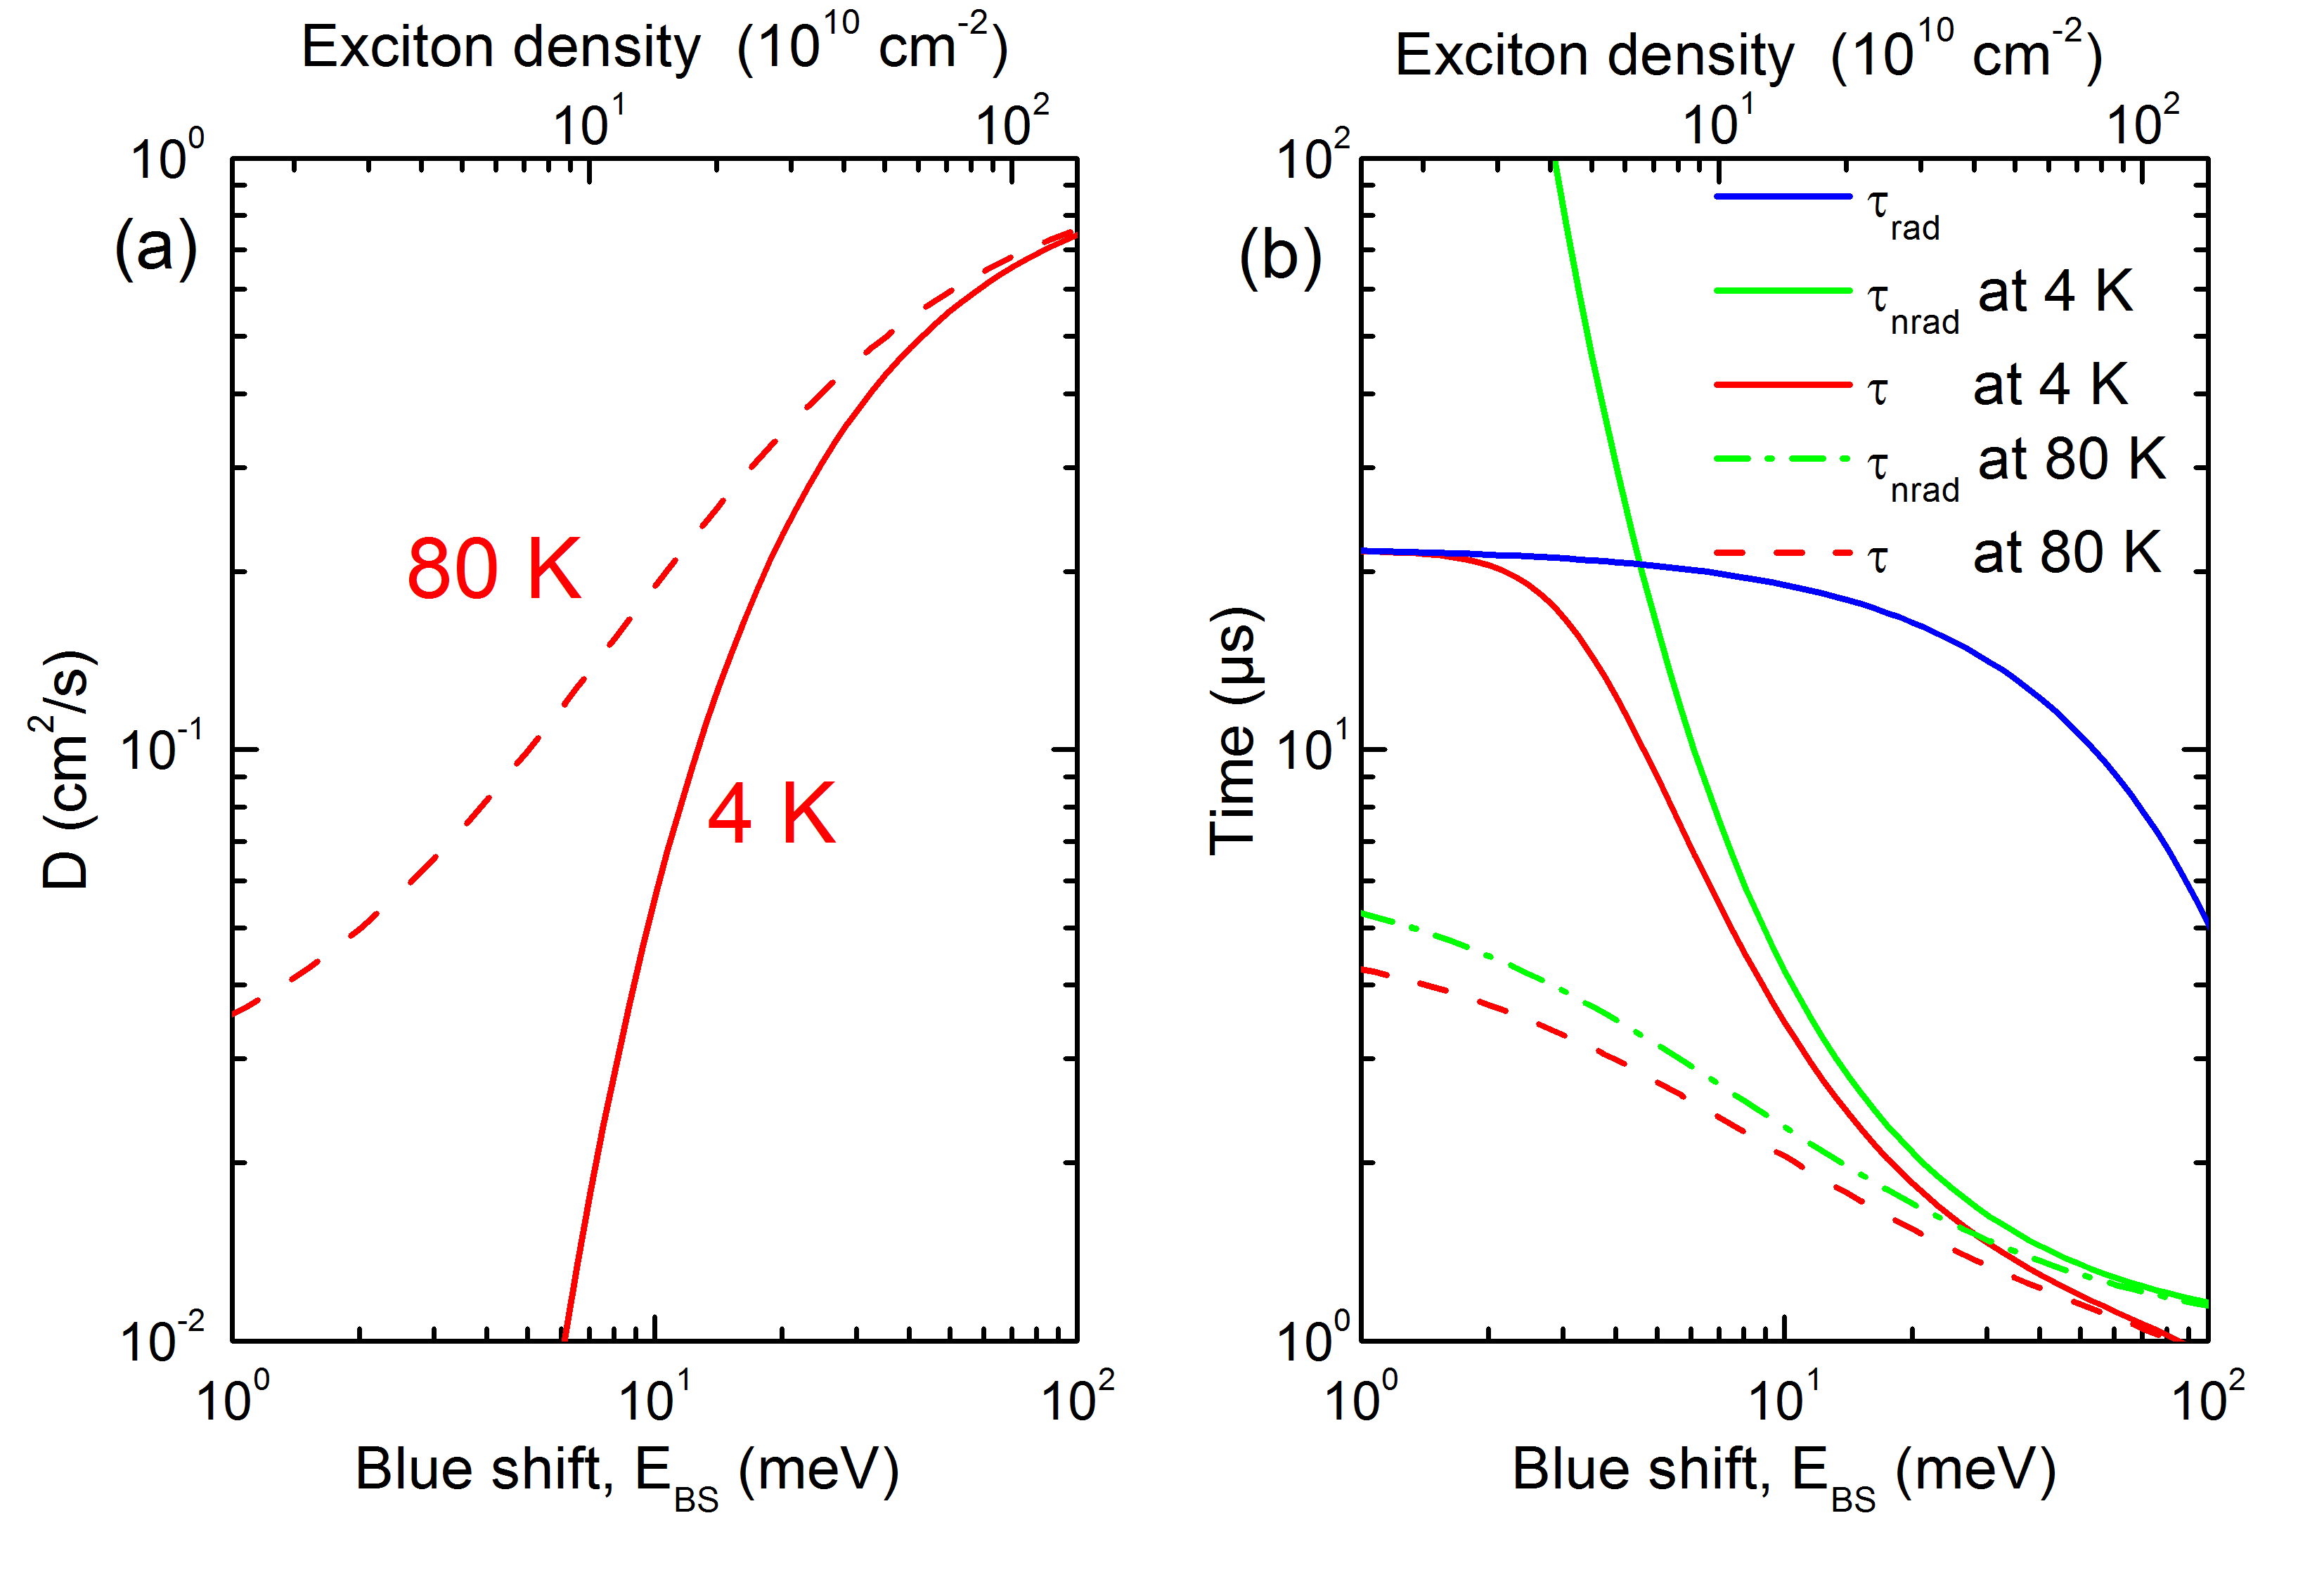
It is instructive to analyze the density dependence of the diffusion coefficient (Eq. 5) and recombination times (Eq. 2, Eq. 10), assumed in this model. These quantities are shown in Fig. 8 for Sample A. The density scale (upper -axis) is reported together with the blue shift scale (lower -axis). One can see that at low temperatures ( K) the diffusion coefficient is far from being constant in the range of the experimentally observed energy shifts. This results precisely from the dipole-dipole repulsion energy, . The diffusion becomes exponentially slow at low density and only when the disorder is screened by the dipole-dipole repulsion the diffusion coefficient reaches asymptotically the maximum value of cm2/s. This behavior is smeared out at higher temperatures, because the thermal energy contributes to the delocalization. For high exciton densities, comparable to, or larger than cm-2, the random potential fluctuations are overcome even at K, because . This corresponds to the situation near in our PL experiments, and explains why the change of the temperature has very little influence on the observations in this region. As the exciton density decreases from to cm-2, the diffusion coefficient is reduced by two orders of magnitude, for K, owing to the relocalization of carriers. This is what occurs, as the distance is increased : the situation goes continuously from the domination of mobile, delocalized excitons to frozen excitons, localized at random fluctuations. If the temperature is increased, as shown in Fig. 8, thermal excitation takes over () and therefore the diffusion persists even at lower exciton densities.
Similarly, Fig. 8(b) shows the calculated exciton lifetime and its radiative and nonradiative components. Despite a much smaller radiative lifetime at high densities, the radiative efficiency, there, is not maximum: the delocalization of carriers favors their nonradiative capture. On the other hand, at K, reducing the density dramatically increases the radiative lifetime but increases the nonradiative lifetime even more, due to the relocalization of excitons. Therefore, at K, the radiative efficiency is close to for low exciton densities and the effective lifetime equals the radiative lifetime. At higher temperature the nonradiative time is less affected by the exciton density, due to the more important contribution of the thermal energy to the exciton delocalization. Even at low density the recombination time never reaches the radiative limit (which is temperature independent). This leads to the onset of the nonradiative horizon, well reproduced by this model. Finally, while both and change significantly with , their product changes much less. That is why the simple model of constant diffusion coefficient and constant recombination time presented in Fig. 4(a) could successfully fit at least the PL blue shift.
VI Conclusions
In conclusion, we have studied GaN/(Al,Ga)N -plane quantum well structures using space and time-resolved PL spectroscopy. In the emission pattern that we represent in the distance/energy coordinate space two distinct features are identified: (1) an arrow-shaped pattern up to m from the excitation spot, which does not depend on the temperature (up to K) and (2) a long range tail of the emission at constant energy, which disappears when the temperature is increased. The combination of spectral, spatial and temporal imaging of the exciton emission, and a detailed model of the transport and recombination processes, allow to determine the most relevant phenomena explaining the short- and long-distance limits, and the short and long timescales. The arrow-shaped pattern is due to the density-activated exciton diffusion away from the excitation spot, and the density dependent emission energy. In contrast with GaAs-based structures, exciton transport is dominated by density-activated diffusion, rather than by the drift current. The long-range PL tail is attributed to secondary excitons, directly created at long distances by higher-energy photons emitted around by the QW itself and guided along the sample plane. This emission is efficiently quenched at high temperature beyond a certain distance, that we identify as the nonradiative horizon. [24]
The results obtained in this work suggest that GaN/AlGaN QWs constitute a very promising system for the study of dipolar excitons and exciton-based devices. We have demonstrated that exciton transport takes place over more than 10 m up to K. Reducing the dislocation density by using GaN rather than sapphire substrate could substantially increase this distance. Consequently, such structures are promising for the studies of cold exciton gases and related quantum phenomena. The possibility to spatially separate the generation spot from the cold excitons reservoir could be crucial to achieve the quantum regime. In terms of the transport mechanisms, it could be interesting to develop new models, taking into account energy relaxation and the formation of the phonon replica. The latter phenomenon is quite strong in the wurtzite semiconductors, compared to their cubic counterparts, and might affect the propagation of excitons. Other polar wide-band gap materials, such as ZnO/ZnMgO with excitons stable at room temperature is another possible research direction.
VII Acknowledgements
We are grateful to K. V. Kavokin, M. I. Dyakonov, L. V. Butov and D. Scalbert for valuable discussions and acknowledge the support of EU ITN INDEX PITN-GA-2011-289968.
References
- Moskelenko and Snoke [2005] A. Moskelenko and D. Snoke, Bose-Einstein Condensation of Excitons and Biexcitons (Cambridge University Press, 2005).
- Butov et al. [1999] L. V. Butov, A. Imamoglu, A. V. Mintsev, K. L. Campman, and A. C. Gossard, Phys. Rev. B 59, 1625 (1999).
- Vörös et al. [2005] Z. Vörös, R. Balili, D. W. Snoke, L. Pfeiffer, and K. West, Phys. Rev. Lett. 94, 226401 (2005).
- Butov et al. [2001] L. V. Butov, A. L. Ivanov, A. Imamoglu, P. B. Littlewood, A. A. Shashkin, V. T. Dolgopolov, K. L. Campman, and A. C. Gossard, Phys. Rev. Lett. 86, 5608 (2001).
- Keldysh and Kozlov [67] L. V. Keldysh and A. N. Kozlov, JETP Letters 5, 238 (67).
- Butov and Filin [1998] L. V. Butov and A. I. Filin, Zh. Eksp. Teor. Fiz. 114, 1115 (1998), [JETP 87, 608-611 (1998)].
- High et al. [2012] A. A. High, J. R. Leonard, A. T. Hammack, M. M. Fogler, L. V. Butov, A. V. Kavokin, K. L. Campman, and A. C. Gossard, Nature 483, 584 (2012).
- Alloing et al. [2014] M. Alloing, M. Beian, D. Fuster, Y. Gonzalez, L. Gonzalez, R. Combescot, M. Combescot, and F. Dubin, cond-mat.quant-gas arXiv:1304.4101v2 (2014).
- Rapaport et al. [2006] R. Rapaport, G. Chen, and S. H. Simon, Phys. Rev. B 73, 033319 (2006).
- Butov [2004] L. V. Butov, Journal of Physics: Condensed Matter 16, R1577 (2004).
- Schindler and Zimmermann [2008] C. Schindler and R. Zimmermann, Phys. Rev. B 78, 045313 (2008).
- Kappei et al. [2005] L. Kappei, J. Szczytko, F. Morier-Genoud, and B. Deveaud, Phys. Rev. Lett. 94, 147403 (2005).
- Alloing et al. [2011] M. Alloing, A. Lemaître, and F. Dubin, EPL 93, 17007 (2011).
- Huber et al. [1998] T. Huber, A. Zrenner, W. Wegscheider, and M. Bichler, physica status solidi (a) 166, R5 (1998).
- Chen et al. [2006] G. Chen, R. Rapaport, L. N. Pffeifer, K. West, P. M. Platzman, S. Simon, Z. Vörös, and D. Snoke, Phys. Rev. B 74, 045309 (2006).
- High et al. [2009] A. A. High, A. K. Thomas, G. Grosso, M. Remeika, A. T. Hammack, A. D. Meyertholen, M. M. Fogler, L. V. Butov, M. Hanson, and A. C. Gossard, Phys. Rev. Lett. 103, 087403 (2009).
- Remeika et al. [2012] M. Remeika, M. M. Fogler, L. V. Butov, M. Hanson, and A. C. Gossard, Appl.Phys.Lett. 100, 061103 (2012).
- Cohen et al. [2011] K. Cohen, R. Rapaport, and P. V. Santos, Phys. Rev. Lett. 106, 126402 (2011).
- Cornell and Wieman [2002] E. A. Cornell and C. E. Wieman, Rev. Mod. Phys. 74, 875 (2002).
- Ketterle [2002] W. Ketterle, Rev. Mod. Phys. 74, 1131 (2002).
- Rontani and Sham [2009] M. Rontani and L. J. Sham, Phys. Rev. B 80, 075309 (2009).
- High et al. [2007] A. A. High, A. T. Hammack, L. V. Butov, M. Hanson, and A. C. Gossard, Optics Lett. 32, 2466 (2007).
- Winbow et al. [2007] G. Winbow, Alexander, T. Hammack, Aaron, V. Butov, Leonid, and C. Gossard, Arthur, Nano Letters 7, 1349 (2007).
- Grosso et al. [2009] G. Grosso, J. Graves, A. T. Hammack, A. A. High, B. L. V., M. Hanson, and A. Gossard, Nat. Photon. 3, 577 (2009).
- Kuznetsova et al. [2010] Y. Y. Kuznetsova, M. Remeika, H. A. A., A. T. Hammack, L. V. Butov, M. Hanson, and A. C. Gossard, Optics Lett. 35, 1587 (2010).
- Andreakou et al. [2014] P. Andreakou, S. V. Poltavtsev, J. R. Leonard, E. V. Calman, M. Remeika, Y. Y. Kuznetsova, L. V. Butov, J. Wilkes, M. Hanson, and A. C. Gossard, Applied Physics Letters 104 (2014), 10.1063/1.4866855.
- Fu and Chao [1991] Y. Fu and K. A. Chao, Phys. Rev. B 43, 12626 (1991).
- Janotti and de Walle [2009] A. Janotti and C. G. V. de Walle, Reports on Progress in Physics 72, 126501 (2009).
- Bernardini and Fiorentini [1998] F. Bernardini and V. Fiorentini, Phys. Rev. B 57, R9427 (1998).
- Seo Im et al. [1998] J. Seo Im, H. Kollmer, J. Off, A. Sohmer, F. Scholz, and A. Hangleiter, Phys. Rev. B 57, R9435 (1998).
- Morhain et al. [2005] C. Morhain, T. Bretagnon, P. Lefebvre, X. Tang, P. Valvin, T. Guillet, B. Gil, T. Taliercio, M. Teisseire-Doninelli, B. Vinter, and C. Deparis, Phys. Rev. B 72, 241305 (2005).
- Leroux et al. [1998] M. Leroux, N. Grandjean, M. Laügt, J. Massies, B. Gil, P. Lefebvre, and P. Bigenwald, Phys. Rev. B 58, R13371 (1998).
- Grandjean et al. [1999] N. Grandjean, J. Massies, and M. Leroux, Applied Physics Letters 74, 2361 (1999).
- Bigenwald et al. [1999] P. Bigenwald, P. Lefebvre, T. Bretagnon, and B. Gil, physica status solidi (b) 216, 371 (1999).
- Lefebvre et al. [2004] J. Lefebvre, J. M. Fraser, P. Finnie, and Y. Homma, Phys. Rev. B 69, 075403 (2004).
- Morel et al. [2003] A. Morel, P. Lefebvre, S. Kalliakos, T. Taliercio, T. Bretagnon, and B. Gil, Phys. Rev. B 68, 045331 (2003).
- Kalliakos et al. [2002] S. Kalliakos, P. Lefebvre, X. Zhang, T. Taliercio, B. Gil, N. Grandjean, B. Damilano, and J. Massies, physica status solidi (a) 190, 149 (2002).
- Zhang et al. [1998] X. B. Zhang, T. Taliercio, S. Kolliakos, and P. Lefebvre, J. Phys.: Condens. Matter 13, 7053 (1998).
- Rossbach et al. [2014] G. Rossbach, J. Levrat, G. Jacopin, M. Shahmohammadi, J.-F. Carlin, J.-D. Ganière, R. Butté, B. Deveaud, and N. Grandjean, Phys. Rev. B 90, 201308 (2014).
- Ivanov et al. [2006] A. L. Ivanov, L. E. Smallwood, A. T. Hammack, S. Yang, L. V. Butov, and A. C. Gossard, Europhys. Lett. 73, 920 (2006).
- Gallart et al. [2001] M. Gallart, P. Lefebvre, A. Morel, T. Taliercio, B. Gil, J. Allègre, H. Mathieu, B. Damilano, N. Grandjean, and J. Massies, physica status solidi (a) 183 (2001).
- Ivanov [2002] A. L. Ivanov, Europhysics Letters 59, 586 (2002).
- Kagan and Perel [1963] Y. M. Kagan and V. I. Perel, Uspekhi Fizicheskikh Nauk 81, 409 (1963).
- Avrutin and Portnoi [1988] E. A. Avrutin and M. E. Portnoi, Soviet Physics Semiconductors-Ussr 22, 968 (1988).
- Hecht [2012] F. Hecht, J. Numer. Math. 20, 251 (2012).
- Butov et al. [2002] L. V. Butov, A. C. Gossard, and D. S. Chemla, Nature 418, 751 (2002).