Calcium peroxide from ambient to high pressure
Abstract
Structures of calcium peroxide (CaO2) are investigated in the pressure range 0-200 GPa using the ab initio random structure searching (AIRSS) method and density functional theory (DFT) calculations. At 0 GPa, there are several CaO2 structures very close in enthalpy, with the ground-state structure dependent on the choice of exchange-correlation functional. Further stable structures for CaO2 with , and symmetries emerge at pressures below 40 GPa. These phases are thermodynamically stable against decomposition into CaO and O2. The stability of CaO2 with respect to decomposition increases with pressure, with peak stability occurring at the CaO B1-B2 phase transition at 65 GPa. Phonon calculations using the quasiharmonic approximation show that CaO2 is a stable oxide of calcium at mantle temperatures and pressures, highlighting a possible role for CaO2 in planetary geochemistry. We sketch the phase diagram for CaO2, and find at least five new stable phases in the pressure/temperature ranges GPa, K, including two new candidates for the zero-pressure ground state structure.
I Introduction
The typical oxide formed by calcium metal is calcium oxide, CaO, having Ca and O in +2 and -2 oxidation states respectively. Calcium and oxygen can also combine to form calcium peroxide, CaO2, a compound which enjoys a variety of uses in industry and agriculture. Calcium peroxide is used as a source of chemically bound but easily evolved oxygen in fertilisers, for oxygenation and disinfection of water, and in soil remediation QZZZC2013 ; MSM2010 .
At ambient pressure bulk calcium peroxide decomposes at a temperature of about 620 K MSM2010 ; foot2 . Early X-ray diffraction (XRD) experiments assigned a tetragonal ‘calcium carbide’ structure of space group to CaO2 CN1956 . This same structure was already known to be formed by heavier alkaline earth metal peroxides KSC1999 ; V1993 . Recently, Zhao et al. Z2013 used an adaptive genetic algorithm and density functional theory (DFT) calculations to search for structures of CaO2, finding a new orthorhombic ground state structure of symmetry, which is calculated to be close to thermodynamic stability at zero pressure and temperature. The simulated XRD pattern from this structure is in good agreement with the available experimental data Z2013 . Thermodynamic stability in this case means stability against decomposition via
| (1) |
We are interested in the stabilities of structures of CaO2 from zero pressure up to 200 GPa, and temperatures up to 1000 K. Calcium and oxygen have high abundances in the Earth’s crust and mantle and, because they also have high cosmic abundances, stable compounds formed from these elements at high pressures are key (exo)-planetary building blocks. Understanding the structures of such compounds allows insight into the composition of planetary interiors, including exoplanets. To date, almost no work has been performed investigating CaO2 as a stable oxide of calcium at high pressures. Some previous work has explored the effect of low pressures (10 GPa) on the bond lengths and lattice parameters of -CaO2 KSC1999 . We therefore employ DFT calculations to explore the behaviour of CaO2 at pressures in the GPa range. DFT calculations provide an excellent avenue for investigating materials properties under pressure, both at pressures accessible to diamond anvil cells Ninet_ionic_ammonia_2014 and at terapascal pressures MPN2012 ; Pickard_terapascal_water_2013 . To explore the stability of CaO2, we search for new crystal structures of this compound at a variety of pressures in the range 0-200 GPa.
II Methods
Density functional theory calculations are performed using the castep plane-wave pseudopotential code CS2005 . Ultrasoft pseudopotentials V1990 generated with the castep code are used for both calcium and oxygen, with core states and , respectively. We use the Perdew-Burke-Ernzerhof (PBE) PBE1996 form of the exchange-correlation functional with a plane-wave basis cutoff of 800 eV. A -point sampling density of Å-1 is used for our CaO and CaO2 phases. For our oxygen phases, we use a denser -point sampling of Å-1. Bulk modulii are calculated by fitting static lattice pressure-volume data to the third-order Birch-Murnaghan equation of state.
The electronic density of states is calculated using the optados code optados1 ; optados2 ; optados3 . Calculations of phonon frequencies are performed with the castep code and a finite-displacement supercell method, using the quasiharmonic approximation KW2003 ; Carrier .
To search for new phases of CaO2, we use the ab initio random structure searching (AIRSS) technique PN2011 . AIRSS proceeds by generating random starting structures containing a given number of formula units. Of these, structures which have lattice parameters giving reasonable bond lengths and cell volumes at a particular pressure are then relaxed to an enthalpy minimum, and the lowest enthalpy structures are selected for refinement. AIRSS has proved to be a very powerful tool in predicting new structures, several of which have subsequently been found experimentally. AIRSS searches have for example uncovered high pressure phases of silane PN2006 , and correctly predicted high pressure metallic phases in aluminium hydrides PN2007 .
In this study, we perform structure searching at pressures of 0, 10, 20, 50, 100, 150 and 200 GPa. The bulk (about 60%) of our searches use cells with 2 or 4 formula units of CaO2, and we have also performed searches with cells containing 1, 3, 5, 6 and 8 formula units. Not all combinations of pressures and formula unit numbers are searched. In total, we relax over 25,000 structures in our CaO2 searches. We supplement our AIRSS searches by calculating the enthalpies of five known alkaline earth metal peroxide structures taken from the Inorganic Crystal Structure Database (ICSD) ICSD , and other authors Z2013 ; KC1998 ; ZO2013 . The relevant alkaline earth metal is replaced with calcium where appropriate.
II.1 CaO
CaO undergoes a transition from the rocksalt () to the CsCl () structure (the B1-B2 transition) around 60-65 GPa. Diamond-anvil-cell experiments indicate a transition pressure of 602 GPa at room temperature JAMB1979 , while DFT calculations give a transition pressure of 65-66 GPa C2003 ; ZK2009 . We find a pressure of 65 GPa in the present study, and we therefore use the rocksalt structure below 65 GPa and the CsCl structure at higher pressures. The bulk modulus of -CaO has been measured to be 104.9 GPa soga , while our static-lattice DFT calculations give a value of 108.5 GPa. To exclude the possibility that CaO might have a different, more stable structure (other than or ) over the pressure range 0-200 GPa, we also perform AIRSS on CaO at pressures of 50, 100 and 200 GPa. We do not find any new low-enthalpy structures for CaO at these pressures.
II.2 Solid oxygen
Structure searching over the pressure range 0-200 GPa has already been performed for solid oxygen SMK2012 ; M2007 , and we use the lowest enthalpy structures found therein. We also examine the enthalpies of the experimentally-determined and oxygen phases at low pressures NeatonandAshcroft . Choosing the lowest-enthalpy oxygen structure at each pressure, we find that -O2 is stable between 0 and 1.2 GPa, after which an insulating phase with space group NeatonandAshcroft is stable up to 41 GPa. A phase of symmetry M2007 then becomes stable, remaining so up to 200 GPa. Our spin-polarised calculations show no discernable difference in enthalpy between a -O2 phase with antiferromagnetic spin ordering, and the experimentally-determined ferromagnetic spin-ordering for -O2 Goncharenko .
These results are not in accord with low-temperature experiments on solid oxygen, which predict -O2 to be stable between 0 and about 5 GPa, -O2 to be stable between about 5 and 10 GPa, followed by the ‘-O2’ phase between 10 and 96 GPa, with a further isostructural phase transition around 100 GPa LWMDL2006 ; F2006 ; AKHH1995 . Our DFT calculations do not yield -O2; optimising its structure at low pressures simply gives the -O2 structure. The aforementioned oxygen phase is however very similar in structure to -O2 (which is also of symmetry), and is within 50 meV/f.u. of that phase in enthalpy over the pressure range 0-200 GPa. Any higher enthalpy structure for oxygen over the pressure range being explored here would only increase the calculated stability of CaO2, so we proceed with the lowest enthalpy DFT phases for oxygen.
III Results
III.1 Structure searching and static lattice results
Our structure searching is carried out by minimising the enthalpy at a given pressure within the static-lattice approximation. We discuss these results first before presenting our calculations of the Gibbs free energy.
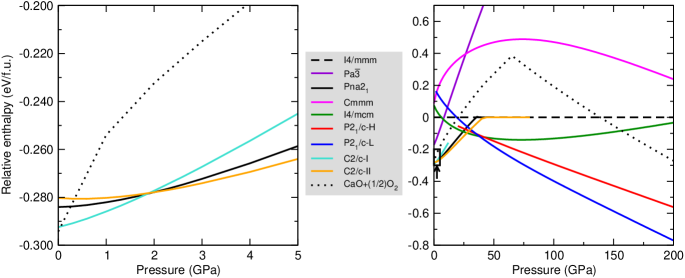
Fig. 1 shows the enthalpy-pressure curves for nine phases of CaO2. The first five of these, labelled with their space group symmetries , , , and in Fig. 1, are known alkaline earth metal peroxide structures as mentioned in the ‘Methods’ section. The other four, with space group symmetries and , are new CaO2 structures. These are the lowest-enthalpy phases that turned up during our AIRSS searches. The dotted line in Fig. 1 shows the enthalpy of CaO+O2, calculated using the lowest-enthalpy phases of CaO and O2 at each pressure. Any CaO2 phase below this dotted line is stable against decomposition in the manner of Eq. (1).
We find the following sequence of phase transitions for CaO2 by considering the lowest enthalpy structure at each pressure:
with the transition pressures between each structure as indicated by the arrows. The - phase is then predicted to be stable up to at least 200 GPa.
At 0 GPa, our structure searching reveals a number of CaO2 phases which are very close (within 10 meV/f.u.) in enthalpy. Within the present approximations (DFT with PBE exchange-correlation), a phase of symmetry (‘-I’) is lowest in enthalpy at 0 GPa. This phase is 8.4 meV/f.u. lower in enthalpy than the proposed -symmetry ground state structure of Zhao et al. Z2013 , which we note also turned up in our AIRSS searches. Our searches also uncover a second -symmetry phase (‘-II’) which is slightly higher in enthalpy than at 0 GPa. The enthalpies of these three phases at low pressures are shown in more detail in the left-hand panel of Fig. 1.
We find that the calculated XRD patterns for the -I, -II and structures share many similar features with available experimental data KC1998 , although this XRD data is best fitted by the structure. The enthalpy differences between the -I, -II and phases at 0 GPa are dependent on the choice of exchange-correlation functional. In Table 1, we show the enthalpies of the and -II phases relative to the -I phase using a variety of different functionals. We find differences in calculated equilibrium volumes as well: for -I at 0 GPa, the LDA gives a volume of 35.8 Å3/f.u., while the PBE functional gives 39.1 Å3/f.u. The LDA typically overbinds in DFT calculations, with PBE instead underbinding, so these two volumes likely bracket the true volume of the -I phase at 0 GPa. Given that is about -2.3 GPa/Å3 for this phase at 0 GPa, this volume difference (due to functional choice) corresponds to a pressure uncertainty in the neighbourhood of GPa. In light of this uncertainty, -I,-II and are all reasonable candidates for the structure of CaO2 at 0 GPa.
| Functional | LDA | PBE | PBESOL | PW91 | WC |
|---|---|---|---|---|---|
| -I | 0.0 | 0.0 | 0.0 | 0.0 | 0.0 |
| 0.1 | 8.4 | 2.9 | 8.7 | 3.5 | |
| -II | -16.3 | 12.2 | -4.1 | 12.0 | -2.7 |
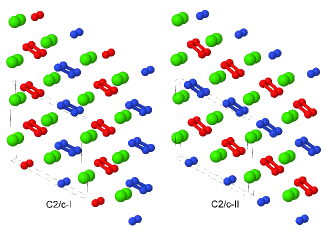
The -I, -II and phases exhibit very similar structures. Looking down the -axis of each phase, calcium atoms form a nearly-hexagonal motif, and we note that the monoclinic angle is close to 120∘ for -I and -II. For the -I and -II phases, the peroxide ion axes are almost coplanar, as can be seen in Fig. 2. In -II, the axes of peroxide ions in the same plane are parallel, while in -I, they alternate in orientation in the same plane. We use red and blue colouring in Fig. 2 to show peroxide ions with parallel axes.
AIRSS searches also reveal a second phase for CaO2 with symmetry (‘-’). As can be seen in the right-hand panel of Fig. 1, our static-lattice calculations show that this is not a stable phase for CaO2 over the pressure range 0-200 GPa. However around 38 GPa, the enthalpy of this phase lies within 10 meV/f.u. of the and - phases, opening up the possibility this phase could become stable once we take temperature into account. We consider this further in a later section (‘Lattice dynamics’). The phase reported here is also predicted for MgO2 above 53 GPa ZO2013 .
We provide lattice parameters and bulk modulii for the -I, -II, , - and - phases at 0, 20, 30 and 50 GPa in Table 2.
| Pressure | Lattice parameters | Atomic coordinates | Wyckoff | |||||||
| (GPa) | Space group | (Å, deg.) | Atom | site | (GPa) | |||||
| 0 | (#15)a (I) | =7.041 | =3.685 | =6.820 | Ca | 0.0000 | 0.6399 | 0.2500 | 4e | 87 |
| =90.0 | =117.8 | =90.0 | O | 0.2548 | 0.1404 | 0.4119 | 8f | |||
| 20 | (#15)a (II) | =6.829 | =3.403 | =6.407 | Ca | 0.0000 | 0.3413 | 0.2500 | 4e | 89 |
| =90.0 | =118.8 | =90.0 | O | 0.1661 | 0.1553 | 0.0252 | 8f | |||
| 30 | (#140) | =4.521 | =4.521 | =5.745 | Ca | 0.0000 | 0.0000 | 0.2500 | 4a | 114 |
| =90.0 | =90.0 | =90.0 | O | 0.1143 | 0.6143 | 0.0000 | 8h | |||
| 30 | - (#14)b | =6.590 | =4.842 | =3.795 | Ca | 0.0611 | 0.7628 | 0.2781 | 4e | 93 |
| =90.0 | =105.2 | =90.0 | O | 0.1301 | 0.2714 | 0.3087 | 4e | |||
| O | 0.2446 | 0.4378 | 0.1012 | 4e | ||||||
| 50 | - (#14)b | =4.223 | =4.279 | =5.949 | Ca | 0.0613 | 0.5133 | 0.2539 | 4e | 110 |
| =90.0 | =98.7 | =90.0 | O | 0.0820 | 0.0235 | 0.4019 | 4e | |||
| O | 0.1224 | 0.1182 | 0.0089 | 4e | ||||||
| a - International Tables, Volume A: unique axis , cell choice 1. | ||||||||||
| b - International Tables, Volume A: unique axis , cell choice 3. | ||||||||||
III.2 Bonding and electronic structure
The bandstructure of the - phase at 50 GPa is shown in Fig. 3. The insulating nature of this phase is evident, with a calculated thermal bandgap of 2.4 eV and optical bandgap of 2.5 eV. These will be underestimates of the true bandgap owing to the use of the PBE functional. The lowest set of 4 bands is comprised almost entirely of Ca orbitals. Above this, we find a central peak flanked by two smaller sidepeaks in the total density of states. The central peak is built from 12 bands and is largely Ca orbitals, while the two sidepeaks contain 4 bands apiece and are dominated by O orbitals. Thus, we have a splitting of the O orbital energy levels, possibly arising from the covalent bonding present in the peroxide [O-O]- ion. Above this, and just below the HOMO (highest occupied molecular orbital), are 20 bands which arise largely from O orbitals. The first orbitals above the Fermi level consist of (unoccupied) O orbitals, followed by a dense band of Ca orbitals. An almost identical pattern of bonding and electronic density of states are found in our other low-enthalpy phases.
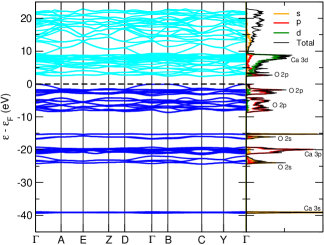
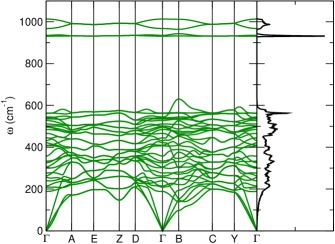
Fig. 4 shows the corresponding phonon band structure and density of states for - at 50 GPa. The lack of imaginary phonon frequencies indicates the stability of this particular phase. The distinctly separate high frequency bands around 930 - 1000 cm-1 in Fig. 4 correspond to phonon modes that stretch the O-O covalent bond in the peroxide ions. Two distinct peroxide bond lengths are found in the ions of this structure: 1.44 Å and 1.46 Å, which splits these higher frequency bands. These peroxide O-O bond lengths are somewhat longer those found in molecular oxygen, which has an O-O bond length of 1.207 Å KC1998 at ambient conditions, and the bond length in oxygen at 50 GPa, which we calculate as 1.20 Å. These longer O-O bond lengths are however typical of crystalline ionic peroxides KSC1999 .
III.3 Stability of CaO2
As can be seen in Fig. 1, our low-enthalpy phases for CaO2 show remarkable stability against decomposition as pressure increases. We predict CaO2 to be most stable at the B1-B2 CaO phase transition pressure of 65 GPa. There, the decomposition enthalpy (Eq. (1)) of CaO2 is +0.64 eV/unit of CaO2 (+62 kJ/mol).
One implication of the stability of CaO2 is that it may be preferentially formed over CaO in an oxygen-rich environment under pressure, through the reverse of Eq. (1). For example, the pressure in the Earth’s lower mantle, at a depth of around 1550 km, is about 65 GPa JAMB1979 , close to our predicted peak stability pressure for CaO2. The formation of MgO2 in this way has also been discussed ZO2013 , although much higher pressures (116 GPa) are needed before MgO2 is stable against decomposition, whereas CaO2 is stable from around 0 GPa. The mantle temperature in the Earth at 65 GPa is in the neighbourhood of 2500 K, and our phonon calculations show that under these conditions, eV/f.u. for the reaction of Eq. (1). Hence, CaO2 is a thermodynamically stable oxide at temperatures and pressures encountered in planetary interiors.
Reactions of the form O for species and , such as the reverse of Eq. (1), are known as redox buffers. Such reactions are key in determining planetary mantle compositions. In the Earth’s mantle, there are a number of such buffers, usually involving the further oxidation of iron and nickel compounds, such as Fe3O4 + O2 Fe2O3 and Ni + O2 NiO. The natural formation of CaO2 by further oxidation of CaO in Earth’s mantle, while energetically favourable at high pressures and temperatures, would also need to compete against the further oxidation of other such compounds. The average CaO content in the Earth’s mantle is about 3% soga , though exoplanet mantles offer a rich variety of alternative compositions.
We highlight the fact that the pressures at which these different CaO2 phases are predicted to become stable are amenable to experimental study in diamond anvil cells. Very few pressure-induced phase transitions for A[B2] compounds are experimentally known E2010 , although at least one example already occurs among the alkaline earth metal peroxides, in BaO2 E2010 . Equivalently, it would be interesting to test the reactivity of CaO and O2 under conditions of excess oxygen, as our results suggest that CaO and O2 are reactive at high pressures. The formation of CaO2 may require laser heating in a diamond anvil cell to overcome the likely high potential barriers between phases. High pressure phases of CaO2 could be recoverable at lower pressures, although possibly not at ambient or zero pressure.
III.4 Lattice dynamics
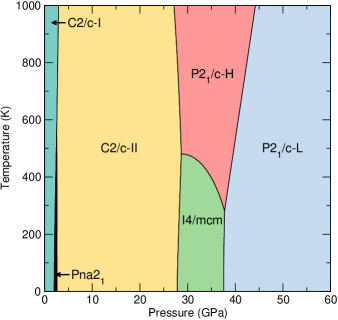
In addition to our static-lattice calculations, we calculate the phonon free energies of our lowest-enthalpy CaO2 phases, namely those with , -I/II, , - and - symmetries. We encounter no imaginary phonon frequencies over the pressure ranges relevant to these phases, indicating that they are dynamically stable. The relevant thermodynamic potential is now the Gibbs free energy, which includes the phonon pressure. Selecting the lowest Gibbs free energy structure from these six structures gives rise to the T-P phase diagram given in Fig. 5. We note that the upper-left (low-P, high-T) part of the phase diagram is representative only, because at ambient pressures CaO2 decomposes at temperatures around 620 K MSM2010 ; foot2 .
We find that the small enthalpy difference between the and - phases seen in our static-lattice calculations (Fig. 1) closes with increasing temperature, and we see the emergence of - as a stable phase for CaO2 at 37.7 GPa and for 281 K. The free energy difference between the and - phases does remain quite small however, around 20 meV per CaO2 unit at the most over the temperature range 0-1000 K.
At room temperature (300 K), we therefore predict a different sequence of phase transitions than those for our static-lattice calculations. We find that, with PBE exchange-correlation:
with the arrows labelled by the predicted transition pressures.
The phase diagram of Fig. 5 does not extend all the way to 200 GPa. However, we expect - to continue to be the most stable phase at high pressures. This is because our structure searching results (which use static-lattice enthalpies) show that the next most stable structure for CaO2 over the pressure range 100-200 GPa is at least 45 meV per unit of CaO2 higher in enthalpy. This was not the case at low pressures, where our searches reveal quite a few structures (such as -) that are close to becoming stable and may therefore do so at high temperatures.
IV Conclusions
Structural changes in CaO2 under pressure have been explored over the pressure range 0-200 GPa at temperatures up to 1000 K. CaO2 remains insulating up to pressures of at least 200 GPa. Structure searching and DFT calculations reveal six stable phases for CaO2 over these pressure and temperature ranges, of which five are reported for the first time in this study. Calculations of the phonon frequencies of these new structures confirms their dynamical stability. The lowest-enthalpy phase of CaO2 at 0 GPa is dependent on the choice of DFT exchange-correlation functional. At pressures above 40 GPa, a phase of symmetry (‘-’) emerges for CaO2 which is predicted to be stable up to 200 GPa, and at mantle pressures and temperatures. CaO2 is a very stable oxide of calcium at high pressures, and may be a constituent of exoplanet mantles. The pressures at which these CaO2 phases become stable are readily attainable in diamond anvil cells.
V Acknowledgements
Calculations were performed using the Darwin Supercomputer of the University of Cambridge High Performance Computing Service (http://www.hpc.cam.ac.uk/), as well as the ARCHER UK National Supercomputing Service (http://www.archer.ac.uk/). Financial support was provided by the Engineering and Physical Sciences Research Council (UK). JRN acknowledges the support of the Cambridge Commonwealth Trust.
References
- (1) Y. Qian, X. Zhou, Y. Zhang, W. Zhang, and J. Chen, Chemosphere 91, 717-723 (2013).
- (2) I. A. Massalimov, A. U. Shayakhmetov, and A. G. Mustafin, Russian J. Appl. Chem. 83, 1794-1798 (2010).
- (3) This decomposition temperature may be lower for samples of different purities; for example the CRC Handbook CRC reports a decomposition temperature of 470K for CaO2.
- (4) C. Brosset and N.-G. Vannerberg, Nature 177, 238 (1956).
- (5) M. Königstein, A. A. Sokol, and C. R. A. Catlow, Phys. Rev. B 60, 4594-4604 (1999).
- (6) P. D. VerNooy, Acta Cryst. C 49, 433-434 (1993).
- (7) X. Zhao, M. C. Nguyen, C.-Z. Wang, and K.-M. Ho, RSC Advances 3, 22135-22139 (2013).
- (8) S. Ninet, F. Datchi, P. Dumas, M. Mezouar, G. Garbarino, A. Mafety, C. J. Pickard, R. J. Needs, and A. M. Saitta, Phys. Rev. B 89, 174103 (2014).
- (9) M. Martinez-Canales, C. J. Pickard, and R. J. Needs, Phys. Rev. Lett. 108, 045704 (2012).
- (10) C. J. Pickard, M. Martinez-Canales, R. J. Needs, Phys. Rev. Lett. 110, 245701 (2013).
- (11) S. J. Clark, M. D. Segall, C. J. Pickard, P. J. Hasnip, M. I. J. Probert, K. Refson, and M. C. Payne, Zeit. für Krist. 220, 567-570 (2005).
- (12) D. Vanderbilt, Phys. Rev. B 41, 7892-7895 (1990).
- (13) J. P. Perdew, K. Burke, and M. Ernzerhof, Phys. Rev. Lett. 77, 3865-3868 (1996).
- (14) R. J. Nicholls, A. J. Morris, C. J. Pickard, and J. R. Yates, J. Phys.: Conf. Series 371, 012062 (2012).
- (15) A. J. Morris, R. J. Nicholls, C. J. Pickard, and J. R. Yates, OptaDOS User Guide: Version 1.0.370 (2014). Available online at http://www.cmmp.ucl.ac.uk/~ajm/optados/.
- (16) J. R. Yates, X. Wang, D. Vanderbilt, and I. Souza, Phys. Rev. B 75, 195121 (2007).
- (17) B. B. Karki and R. M. Wentzcovitch, Phys. Rev. B 68, 224304 (2003).
- (18) P. Carrier and R. M. Wentzcovitch, Phys. Rev. B 76, 064116 (2007).
- (19) C. J. Pickard and R. J. Needs, J. Phys.: Condensed Matter 23, 053201 (2011).
- (20) C. J. Pickard and R. J. Needs, Phys. Rev. Lett. 97, 045504 (2006).
- (21) C. J. Pickard and R. J. Needs, Phys. Rev. B 76, 144114 (2007).
- (22) F. H. Allen, G. Bergerhoff, and R Sievers, Crystallographic databases (Chester, England: International Union of Crystallography, 1987).
- (23) M. Königstein and C. R. A. Catlow, J. Solid State Chem. 140, 103-115 (1998).
- (24) Q. Zhu, A. R. Oganov, and Andriy O. Lyakhov, Phys. Chem. Chem. Phys. 15, 7696-7700 (2013).
- (25) R. Jeanloz, T. J. Ahrens, H. K. Mao, and P. M. Bell, Science 206, 829-830 (1979).
- (26) M. Catti, Phys. Rev. B. 68, 100101 (2003).
- (27) J. Zhang and J. Kuo, J. Phys.: Condensed Matter 21, 015402 (2009).
- (28) N. Soga, J. Geophys. Research 73, 5385-5390 (1968).
- (29) J. Sun, M. Martinez-Canales, D. D. Klug, C. J. Pickard, and R. J. Needs, Phys. Rev. Lett. 108, 045503 (2012).
- (30) Y. Ma, A. R. Oganov, and C. W. Glass, Phys. Rev. B 76, 064101 (2007).
- (31) J. B. Neaton and N. W. Ashcroft, Phys. Rev. Lett. 88, 205503 (2002).
- (32) I. N. Goncharenko, O. L. Makarova, and L. Ulivi, Phys. Rev. Lett. 93, 055502 (2004).
- (33) L. F. Lundegaard, G. Weck, M. I. McMahon, S. Desgreniers, and P. Loubeyre, Nature 443, 201-204 (2006).
- (34) H. Fujihisa, Y. Akahama, H. Kawamura, Y. Ohishi, O. Shimomura, H. Yamawaki, M. Sakashita, and Y. Gotoh, S. Takeya, and K. Honda, Phys. Rev. Lett. 97, 085503 (2006).
- (35) Y. Akahama, H. Kawamura, D. Häusermann, M. Hanfland, and O. Shimomura, Phys. Rev. Lett. 74, 4690-4693 (1995).
- (36) I. Efthimiopoulos, K. Kunc, S. Karmakar, K. Syassen, M. Hanfland, and G. Vajenine, Phys. Rev. B 82, 134125 (2010).
- (37) W. M. Haynes (ed.), CRC Handbook of Chemistry and Physics, 94th ed. (Taylor and Francis, 2013).