How Swift is Redefining Time Domain Astronomy
Abstract
NASA’s Swift satellite has completed ten years of amazing discoveries in time domain astronomy. Its primary mission is to chase gamma-ray bursts (GRBs), but due to its scheduling flexibility it has subsequently become a prime discovery machine for new types of behavior. The list of major discoveries in GRBs and other transients includes the long-lived X-ray afterglows and flares from GRBs, the first accurate localization of short GRBs, the discovery of GRBs at high redshift (), supernova shock break-out from SN Ib, a jetted tidal disruption event, an ultra-long class of GRBs, high energy emission from flare stars, novae and supernovae with unusual characteristics, magnetars with glitches in their spin periods, and a short GRB with evidence of an accompanying kilonova. Swift has developed a dynamic synergism with ground based observatories. In a few years gravitational wave observatories will come on-line and provide exciting new transient sources for Swift to study.
keywords:
black hole physics; radiation mechanisms: non-thermal; stars: activity; gamma-ray burst: general; stars: neutron, novae; galaxies: star formation1 Introduction
Launched 20 Nov 2004, Swift (Gehrels et al. 2004) was originally envisioned as primarily a GRB chasing satellite. It has been amazing successful in this capacity (Gehrels, Ramirez-Ruiz, & Fox 2009), but Swift has also evolved into something much more an all-purpose time-domain mission. Its rapid response capability allows for wide-ranging interactions with other observatories across the electromagnetic spectrum tailored to meet the demands imposed by different transients. In a few years this will also include gravity-wave missions such as LIGO and VIRGO.
About once a year Swift makes a game-changing discovery. A partial list includes:
–2005: Short GRB mystery solution: NS-NS mergers.
–2005: Flares and bright afterglows in GRBs.
–2008: Shock break-out in a supernova Ibc.
–2008: Naked eye GRB from reverse shock in GRB jet.
–2009: Discovery of GRBs at .
–2010: Galaxy mergers in hosts of absorbed AGN.
–2011: Discovery of a jetted tidal disruption event.
–2012: SFR and metallicity evolution to .
–2012: Discovery of very young (2500 year old) SNR.
–2012: Discovery of ultra-long class of GRB.
–2013: Anti-glitch in magnetar 1E 2259+586.
–2013: Evidence for kilonova in a short GRB.
–2014: Evidence for two UV color classes in SNe Ia.
We will discuss these science results and others in time domain astronomy in this paper. There are many other types of steady-source science that Swift addresses including surveys of galactic sources, AGN, and galaxies. In this paper, however, we cover only transient sources.
2 Solution to the mystery of short GRBs
The key to unraveling long GRBs, i.e., placing them at cosmological distances, came in 1997 with the first localizations and subsequent host galaxy redshift determinations. Similarly with short GRBs the breakthrough happened in May-July 2005 with afterglows of short GRBs discovered by Swift (Gehrels et al. 2004) and HETE-2 (Ricker et al. 2003). GRB 050509B was the first short GRB to show an X-ray counterpart, with a 9 arcsec localization (Gehrels et al. 2005). Deep follow-up observations failed to reveal optical afterglow but did discover a massive elliptical galaxy near the X-ray error circle, with a chance coincidence probability of (Castro-Tirado et al. 2005; Gehrels et al. 2005; Bloom et al. 2006). If GRB 050509B was indeed at then the non-detection of a supernova was significant (Hjorth et al. 2005a). Two months later HETE-2 discovered the short GRB 050709 (Villasenor et al. 2005). Chandra precisely localized the X-ray afterglow (Fox et al. 2005), and subsequent observations revealed the first optical afterglow from a short GRB (Hjorth et al. 2005b). The resultant sub-arcsecond localization placed the burst in the outer regions of a star-forming galaxy at (Fox et al. 2005). As with GRB 050509B, optical follow-up also ruled out the presence of an associated supernova (Hjorth et al. 2005b).
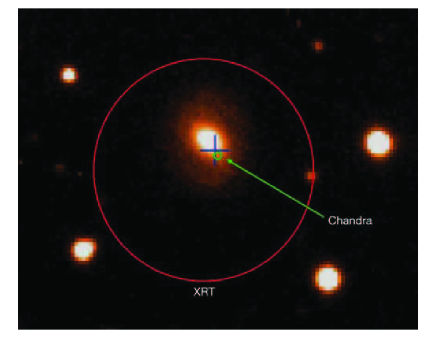
The final triumph of 2005 for short GRBs was another Swift discovery, the short GRB 050724 (Barthelmy et al. 2005) which resulted in the discovery of X-ray, optical/near-IR, and the first radio afterglow (Figure 1). It yielded another subarcsecond localization in an elliptical galaxy, at (Berger et al. 2005b). The ratio of radio to X-ray afterglow emission also demonstrated that both the energy and density scale were lower than for long GRBs (Berger et al. 2005b). Taken together, these three early events showed that short GRBs are cosmological, they produce afterglow emission similar to that of long GRBs but with a lower energy and density scale, and their progenitors are not massive stars (given their lack of associated supernovae).
Ten years after the discovery of short GRB afterglows more than 70 short GRBs have been found by Swift and other ray satellites (Berger 2014). A sizable fraction have X-ray and optical afterglows; a few have been detected in the radio. The localizations and optical follow-up work have identified 40 host galaxies and enabled detailed studies of the intragalactic locations of short GRBs. An HST study of 10 short GRBs within their host galaxies reveals they trace the light distribution of their hosts, while long GRBs are concentrated in the brightest regions of their host galaxies (Berger et al. 2005a; Fong, Berger, & Fox 2010).
Fong et al. (2010) find that the median value of the projected offset from host center for short GRBs of 5 kpc is about 5 times larger than that for the corresponding long GRB median offset. Interestingly, when the two offset distributions are normalized to the size of the host galaxy, they lie almost on top of each other. In other words, the host galaxies for long GRBs are 1/5 as large on average than those of short GRBs. In an updated HST study using 22 short GRBs Fong & Berger (2013) refine their previous results, and furthermore find that short GRBs strongly under-represent their hosts’ rest-frame optical and UV light; a fraction are located in regions with no stellar light, and 0.55 in regions with no UV light. Therefore Fong & Berger conclude that short GRB progenitors must migrate over considerable distances before their eventual explosions, which supports the idea of progenitor kicks in compact binary systems and the NS-NS merger model for short GRBs.
3 Flares and bright afterglows in GRBs
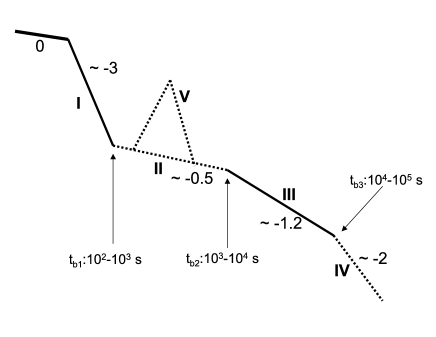
By the time Swift had discovered a handful of GRBs and their XRT X-ray light curves were studied in detail, several basic features became obvious (Zhang et al. 2006; Nousek et al. 2006; O’Brien et al. 2006). This now standard picture of the X-ray decay came as somewhat of a surprise and certainly was not expected before Swift.
The canonical X-ray behavior, depicted schematically in Figure 2, consists of up to five distinct segments: (0) emission coincident with the prompt emission, (I) an initial steep decay , (II) a shallow decay , (III) a steeper decay , and finally (IV) a slightly steeper decay . The transition times between segments are given in Figure 2. In addition, one often sees (V) large flares superposed on the shallow decay branch.
The initial steep decay (Tagliaferri et al. 2005) is associated with the tail of the prompt emission. Early speculation was that it is due to photons that are radiated at large angles relative to our line of sight in the initial fireball – so called “high-latitude” emission (Kumar & Panaitescu 2000). However, subsequent study showed that the predicted relation between spectra index and temporal decay index was not borne out by the data (O’Brien et al. 2006, see their Fig. 4).
The prolonged emission associated with the shallow decay prompted much theoretical work on “continuous” or “delayed” energy injection models. It was thought that the forward shock keeps being refreshed for some time, possibly due to a long-lived central engine, a wide distribution of Lorentz factors in the jet, or possibly the deceleration of a Poynting flux-dominated jet. These speculations led to a variety of models based on fall-back accretion disks (Kumar, Narayan, & Johnson 2008; Cannizzo & Gehrels 2009), magnetars (Dall’Osso et al. 2011; O’Brien & Rowlinson 2012; Rowlinson et al. 2013), and various other ideas such as “prior emission” (Yamazaki 2009).
Recent work based on relativistic hydrodynamical computations favors the standard picture in which a baryon dominated jet directed along our line-of-sight breaks through the photosphere of a progenitor (Duffell & MacFadyen 2014). This model may be able to account for all the decay phases observed by XRT (Duffell & MacFadyen 2014). In this (now canonical) model a jet launched ballistically from near the progenitor core with a bulk Lorentz factor undergoes strong shock heating and lateral confinement, so that when it emerges from the progenitor it has a large internal energy . The subsequent jet expansion due to the large leads to an effective Lorentz factor for a distant, line-of-sight observer. The GRB prompt radiation is produced by strong internal shocks in the expanding fireball at the point where it becomes optically thin to its own radiation.
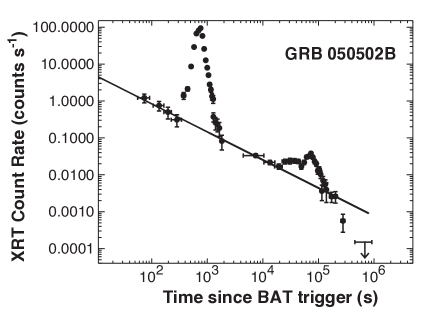
Large X-ray flares associated with GRBs (Chincarini et al. 2007; Falcone et al. 2007) suggest that the GRB central engine is very likely still active after the prompt gamma-ray emission is over, but with a reduced activity at later times. Figure 3 shows a giant flare in GRB 050502B with a total energy comparable to the burst itself. These strong, rapid X-ray flares have been seen in other bursts and indicate that the central engines of the bursts have long periods of activity, with strong internal shocks continuing for hundreds of seconds after the gamma-ray emission has ended. Flares have also been seen in short GRBs, e.g. GRB050724 (Grupe et al. 2006).
4 GRBs and Supernovae
On 18 February 2006 Swift detected the remarkable burst GRB 060218 which shed light on the connection between SNe and GRBs. It lasted longer than and was softer than any previous burst, and was associated with SN 2006aj at only . The BAT trigger enabled XRT and UVOT observations during the prompt phase of the GRB and initiated multiwavelength observations of the supernova from the time of initial core collapse. The spectral peak in prompt emission at 5 keV places GRB 060218 in the X-ray flash category of GRBs (Campana et al. 2006), the first such association for a GRB-SN event. Combined BAT-XRT-UVOT observations provided the first direct observation of shock-breakout in a SN (Campana et al. 2006). This is inferred from the evolution of a soft thermal component in the X-ray and UV spectra, and early time luminosity variations. SN 2006aj was dimmer by a factor 2 than previous SNe associated with GRBs, but still times brighter than normal SN Ic not associated with GRBs (Pian et al. 2006; Mazzali et al. 2006). GRB 060218 was an underluminous burst, as were two of the other three previous cases. Because of the low luminosity, these events are only detected when nearby and are therefore rare occurrences. However, they are actually times more common in the universe than normal GRBs (Soderberg et al. 2006). For completeness we note there have also been two nearby long GRBs with no associated SNe to deep limits (Gehrels et al. 2006; Fynbo et al. 2006; Della Valle et al. 2006).
Swift has added to the list of GRB-with-associated-SNe, most notably with GRB 130427 (Maselli et al. 2014; Melandri et al. 2014; Levan et al. 2014). Its energy erg ranks it among the most luminous 5% of GRBs observed by Swift, and a factor of 100 brighter than GRB 030329 (Hjorth et al. 2003) which was the previously most luminous GRB with a well-studied SN. Its low redshift (Levan et al. 2013; Xu et al. 2013; Perley et al. 2014) means that it is readily accessible for spectroscopic study of an attendant SN, and indeed one has been seen – SN 2013cq (de Ugarte Postigo et al. 2013; Xu et al. 2013).
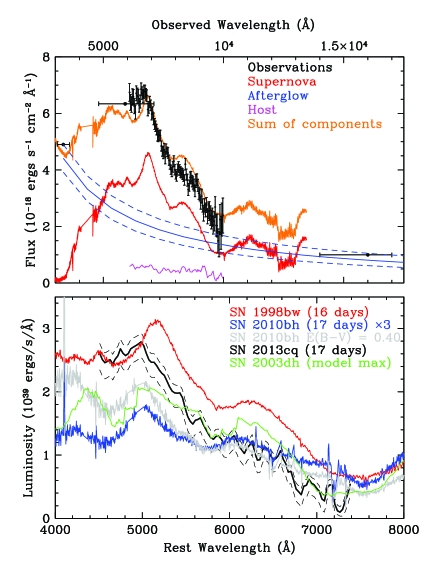
Levan et al. (2014) present HST observations of GRB 130427A (Figure 4) which show that it was associated with a luminous broad line SN Ic (SN 2013cq). The red spectra offer good agreement with those of SN 1998bw, while the bluer spectra appear well-matched in position and shape to SN 2010bh. Levan et al. utilize HST to separate the afterglow, host, and SN contributions to the observed light at 17 d (rest frame). ACS grism observations show that the associated supernova, SN 2013cq, has an overall spectral shape and luminosity similar to SN 1998bw (with a photospheric velocity ). The blue features in the spectrum are matched better by the higher velocity SN 2010bh (), however SN 2013cq is significantly fainter. The burst originated 4 kpc from the nucleus of a moderately star-forming region, . The absolute magnitude, physical size, and morphology of the host galaxy, as well as the location of the GRB within it, are very similar to those of GRB 980425/SN 1998bw. The similarity of the SNe and environment from both the most luminous and least luminous GRBs suggests that broadly similar progenitor stars can create GRBs across six orders of magnitude in isotropic energy.
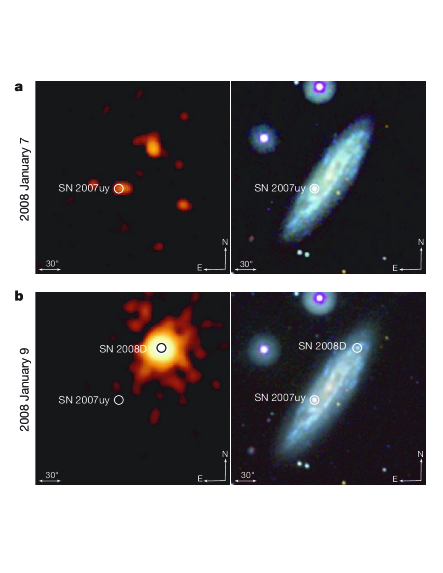
5 SN 2008D Shock Breakout
The time of a SN is marked by a burst of neutrinos, thus the “delayed” optical light from radioactivity in the ejecta through which most SNe are discovered does not provide information about the first moments following the explosion. On 9 January 2008 Swift/XRT serendipitously discovered an extremely bright X-ray transient (Figure 5) while carrying out a preplanned observation of the nearby ( Mpc) galaxy NGC 2770 (Soderberg et al. 2008). Two days earlier XRT had observed the same location and did not see a source. X-ray outburst (XRO) 080109 lasted about 400 s and occurred in one of the galaxy’s spiral arms. XRO 080109 was not a GRB (no rays were detected), and the total X-ray energy erg was orders of magnitude lower than a GRB. The peak luminosity erg s-1 is much greater than the Eddington luminosity for a object, and also from type I X-ray bursts. Therefore the standard accretion and thermonuclear flash scenarios are excluded.
Simultaneous Swift/UVOT observations did not reveal a counterpart, but UVOT observations at 1.4 hr showed a brightening. Gemini-North observations beginning at 1.7 d revealed a spectrum suggestive of a young SN (Soderberg et al. 2008). Later observations confirmed the spectral features. The transient was classified as a type Ibc SN based on the lack of H, and weak Si features.
Soderberg et al. (2008) argue that the X-ray flash indicates a trans-relativistic shock breakout from a SN, where the radius at breakout is cm, and the shock velocity at breakout . They estimate a circumstellar density which yields an inferred pre-SN mass loss rate , reinforcing the notion of a Wolf-Rayet progenitor. The similarity between the shock break-out properties of the He-rich SN 2008D and the He-poor GRB-associated SN 2006aj are consistent with a dense stellar wind around a compact Wolf-Rayet progenitor.
X-ray and radio observations presented by Soderberg et al. (2008) of SN 2008D are the earliest ever obtained for a normal type Ibc SN. At d, the X-ray and peak radio luminosities are orders of magnitude less than those of GRB afterglows, but comparable to those of normal type Ibc SN.
Mazzali et al. (2008) highlight several unusual features associated with SN 2008D/XRF 080109: (i) a weak x-ray flash (XRF), (ii) an early, narrow optical peak, (iii) the disappearance of the broad lines characteristic of SN Ic HNe, and (iv) the development of He lines as in SNe Ib. By analyzing its light curve Mazzali et al. infer a SN energy erg and ejected mass , placing it between normal SNe Ibc and HNe. Mazzali et al. conclude that SN 2008D was among the weakest explosions producing relativistic jets, in accordance with the inference of Soderberg et al. of a trans-relativistic shock breakout.
6 Swift reverse shock, naked eye GRB
In the standard fireball model, relativistic shells within a jet propagate away from the central engine and into the surrounding medium, generating a forward shock (FS). A reverse shock (RS) propagates back into the jet. Studies of the GRB afterglow FS/RS emission can potentially provide information about the explosion energy, geometry, and structure of the circumburst medium (Sari, Piran, & Narayan 1998; Chevalier & Li 2000). The most useful probe of the initial bulk Lorentz factor and the ejecta composition is the RS. The combination of large RS speed and the finite and limited ejecta length means that the only hope of directly observing the RS is via its early-time emission, basically optical and/or radio detections. To be detectable very bright bursts are needed. The RS emission is expected to produce a synchrotron spectrum similar to the FS, with well-defined RS/FS properties (Sari & Piran 1999ab; Kobayashi & Zhang 2003ab; Zou et al. 2005). There have been detections of hints of an RS-like component in a handful of bursts. A detailed understanding of RS emission requires a careful decomposition of the afterglow spectral energy distribution (SED) into RS and FS components. Since the peak frequencies of the two components are related by a factor of , such a decomposition requires multi-wavelength observations spanning several orders of magnitude in frequency (Laskar et al. 2013).
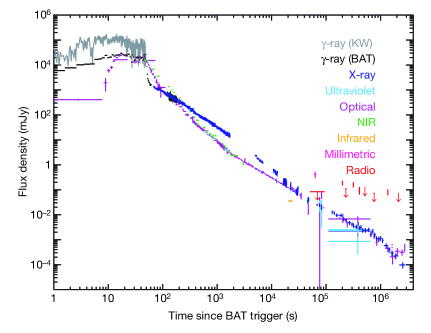
On 19 March 2008 Swift detected the naked eye GRB 080319B (Racusin et al. 2008). It was the brightest optical burst ever observed. If it were 2 kpc from Earth it would have been as bright as the noon sun in the sky. It had a redshift , a peak visual magnitude 5.3, and a total energy in rays erg (20 keV – 7 MeV). This burst (Figure 6) was observed with a wide variety of instruments spanning the spectrum from radio to ray. The earliest data at s reveal a common shape for the bright optical and ray light curves, indicating they arise from the same physical region. The second optical component (50 s 800 s) shows the distinct characteristic of a RS, namely, an excess above a time-reversed extrapolation from the later optical power law decay. The final component (at s) is the afterglow produced as the external FS propagates into the surrounding medium. Previous measurements of GRBs had never revealed all three optical components in the same burst with such clarity.
RS emission did not become visible until the prompt emission faded. The high peak luminosity of the optical RS so soon after the end of the ray emission indicated that the RS was at least mildly relativistic. Furthermore, the GRB outflow could not have been highly magnetized when it crossed the RS or the RS itself would have been suppressed. On the other hand, the presence of strong optical emission accompanying the RS demands some magnetization, therefore an intermediate magnetization seems to be indicated (Racusin et al. 2008).
7 GRBs at
GRBs can serve as powerful probes of the early universe. GRB afterglows have intrinsically very simple spectra thereby allowing robust redshifts from low signal to noise spectroscopy, or photometry. During a fortuitous one week span in April 2009 Swift found two GRBs with redshifts greater than eight. These are two of the most distant objects ever found; they harken back to a time when the universe was only 0.5 Gyr old. A study of the light from these ancient beacons can provide crucial clues about the early universe. Their luminous afterglows reveal locations and properties of star forming galaxies at distant redshifts, potentially localizing first generation (Pop III) stars.
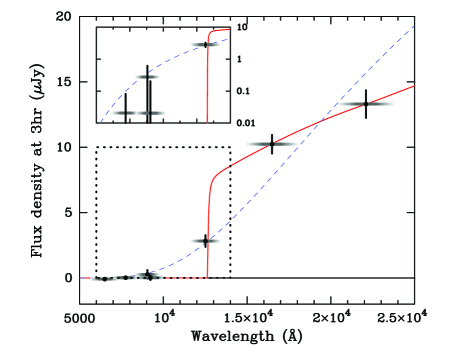
GRB 090423: Tanvir et al. (2009) present observations of GRB 090423 taken with a variety of instruments, including XRT, UKIRT, and VLT. An SED at 17h gives a photometric redshift . VLT observations starting at 17.5h show a flat continuum disappearing at m, which confirms the origin of the break as Ly absorption by neutral H at . A simultaneous best fit to both spectra and photometric data points gives . Salvaterra et al. (2009) compare rest-frame ray and X-ray light curves of GRB 090423 with those of GRBs at low, intermediate, and high redshifts and find them to be remarkably similar.
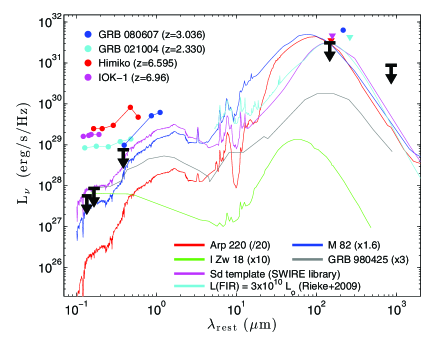
Far-IR observations of the host galaxy of GRB 090423 with ALMA and Spitzer (Figure 7) taken by Berger et al. (2014) reveal that the host is not seen at rest frame wavelengths of 145 m (ALMA) and 0.39 m (Spitzer), with inferred upper limit . This corresponds to an obscured star formation rate . The Spitzer and HST upper limits place a limit on the host galaxy stellar mass (assuming a Myr old stellar population with constant star formation rate).
GRB 090429B: Cucchiara et al. (2011) infer a photometric redshift based on deep observations with Gemini, VLT, and GROND (Figure 8). The 90% likelihood range is , and the lowest redshift allowed at 99% confidence is . The non-detection of the host galaxy to deep limits (, or at where is the characteristic galaxy luminosity) in late time HST observations strongly supports the extreme redshift since HST would have detected any low galaxy, even if it were extremely dusty. Finally, the energetics of GRB 090429B are comparable to those of other GRBs, and suggest that the progenitor of GRB 090429B is not greatly different from those of lower redshift bursts.
8 GRB studies using complete samples
As the total number of Swift GRBs approaches 1000, it becomes not only possible but imperative to carry out studies based on well-defined and complete samples. Such samples are essential in our next steps in understanding GRBs and using them as probes of the universe while at the same time controlling for and minimizing the effects of observational bias. A major step in this direction have been studies based on the “TOUGH” survey – The Optically Unbiased GRB Host Survey (Hjorth et al. 2012; Jakobsson et al. 2012; Milvang-Jensen et al. 2012; Krühler et al. 2012; Michałowski et al. 2012).
Hjorth et al. (2012) define a homogeneous subsample of 69 Swift GRB galaxies using well-defined criteria aimed at making the sample optically unbiased. Using VLT they detect host galaxies for 80% of the GRBs in the sample. For those hosts with redshifts, 38 in all, they determine a median value . Jakobsson et al. (2012) increase the total number of TOUGH redshifts from 38/69 to 53/69, spanning a range . They constrain the fraction of Swift GRBs to a maximum of 14% for and 5% for . Milvang-Jensen et al. (2012) search for Ly emission in a subsample of 20 host galaxies. They detect Ly emission from 7 of the 20, with luminosities in the range erg s-1. Krühler et al. (2012) use NIR spectroscopy to refine the database, and Michałowski et al. (2012) use radio observations to infer that TOUGH galaxies are similar in many respects to other star-forming galaxies at .
Kohn et al. (2015) present an analysis of FIR properties of an unbiased sample of 20 BeppoSAX and Swift host galaxies at and conclude that the detection rate of GRB hosts is consistent with that predicted assuming GRBs trace the cosmic SFR in an unbiased way.
Similar efforts have been undertaken based on carefully selected sub-samples of GRBs, characterized by a high degree of completeness in redshift determination, which are bright in the keV BAT band (Salvaterra et al. 2012; Nava et al. 2012; Campana et al. 2012; D’Avanzo et al. 2012; Ghirlanda et al. 2013). Ghirlanda et al. (2013) construct a homogeneous sub-sample of 38 radio detections/upper limits from a complete sample of 58 bright Swift long GRBs. They find that GRBs which typically trigger Swift/BAT can be detected by JVLA within a few days with modest exposures, even at high .
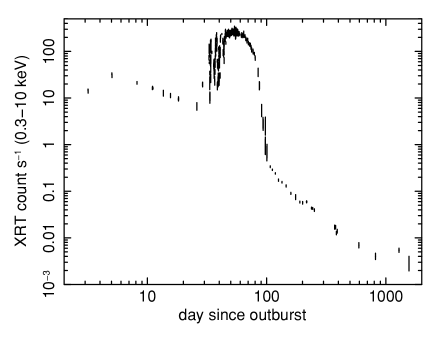
9 Swift J1644+57 the first Jetted Tidal Disruption Event
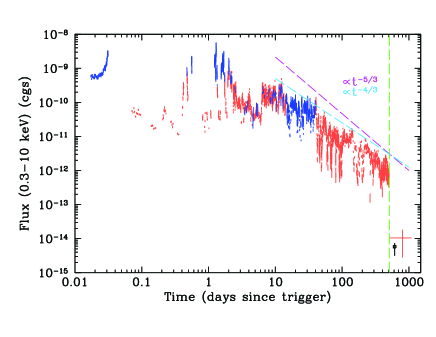
Tidal disruption events (TDEs) are caused by the tidal disruption of stars that venture too close to the massive black holes (MBHs) at the centers of galaxies (Rees 1988; Phinney 1989; Cannizzo, Lee, & Goodman 1990). Prior to March 2011, nearly all our observational information was based on optical/UV studies (Gezari et al. 2006, 2008) or long-term X-ray data with poor time sampling (Komossa et al. 2004). This changed with the discovery by Swift of GRB 110328A/Swift J1644+57, a TDE viewed down the jet axis of a MBH in the nucleus of a galaxy at (Bloom et al. 2011; Burrows et al. 2011; Levan et al. 2011; Berger et al. 2012).
A TDE occurs when the radius of closest approach of a star passes within the tidal disruption radius . After a TDE occurs, there is no accretion of shredded stellar material onto the SMBH for a time , the fallback time for the most tightly bound debris. Therefore, one expects a gap of , after which accretion can begin. In addition, Tchekhovskoy et al. (2014) point out there will also be an additional after accretion starts before the jet activates. Thus one anticipates a total time interval between TDE and an observed jet activity, i.e., flaring followed by a decay . Thus in an idealization in which (i) we view the TDE down the jet axis, (ii) the jet power tracks the rate of accretion onto the SMBH, and (iii) most of the jet power comes out in X-rays,
| (1) |
By considering the ratio of the peak X-ray flux to the fluence , one can directly measure . From the functional form for one may write
| (2) |
Note that all uncertainties such as beaming angle, accretion efficiency, jet efficiency, etc., cancel out. Using the Swift/XRT measured values erg cm-2 s-1 and fluence erg cm-2 yields d for , or d for (Mangano et al. 2015). These small values d argue against the possibility for d presented in Tchekhovskoy et al. (2014).
Mangano et al. (2015) determine a post-fluctuation decay slope (Figure 9), which is statistically distinguishable from the value for Swift J1644+57 commonly cited in the literature. Previous studies quoting a slope (e.g., Metzger, Giannios, & Mimica 2012; Lei, Zhang, & Gao 2013; Kawashima et al. 2013; Kumar et al. 2013; Barniol Duran & Piran 2013; Zauderer et al. 2013; Shen & Matzner 2014; Tchekhovskoy et al. 2014) did not carry out detailed fitting but simply overlay a decay onto a light curve for Swift J1644+57 taken from the Swift/XRT archive (Evans et al. 2007, 2009), which assumes a single energy-to-counts conversion factor. The combination of (i) a small inferred and (ii) a decay rate (Mangano et al. 2015) support the viewpoint of a rapid transition from stellar fallback to disk accretion, where the disk is highly advective (Cannizzo, Troja, & Lodato 2011; Gao 2012). A value d challenges current theory, which favors d, but does not consider strong general relativistic effects in the Kerr metric for large encounters; modifications in the spread in specific binding energy for the tidal debris from the standard results for encounters are treated via linear perturbations to a Newtonian gravitational potential (e.g., Guillochon & Ramirez-Ruiz 2013; Stone, Sari, & Loeb 2013, see their Sect. 6).
10 GRB 130603B: a possible kilonova?
Neutron stars represent the most compact form of matter in the universe (Pines & Alpar 1985). Beneath an atmosphere only a few m thick one has an outer crust km thick, varying in density from to . It contains a solid array of nuclei and highly degenerate relativistic electron plasma. The inner crust has a radial extent of a few km and varies from up to at its base. It is composed of a highly degenerate superfluid neutron liquid in addition to a lattice of increasingly neutron-rich nuclei and relativistic electrons. The quantum liquid interior is thought to be mainly superfluid neutrons with a few percent protons and electrons. The density at the core ; by comparison for nuclear matter.
As discussed previously, the currently favored model for short GRBs is a NS-NS merger. During the merger streamers of neutron star material may get ejected and decompress. When the density of the expanding plasma falls below nuclear, nucleon clusters are formed, the matter inside each quasi-nucleus in equilibrium with the external dripped neutron sea (Lattimer et al. 1977). As the density drops further these nuclei lose neutrons to the external sea of neutrons. When the decay time scale becomes shorter than the expansion time scale, the neutrons, which had previously been stable by virtue of their “nuclear” environment, begin to decay. The nuclei then increase in proton and neutron number until they become unstable to fission. This process will resemble the standard process.
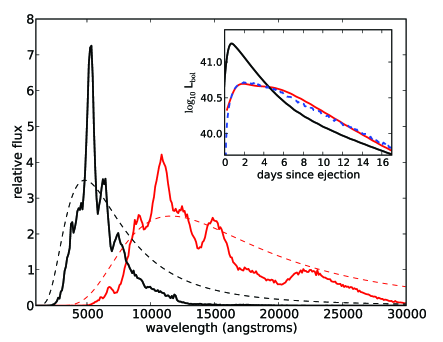
Various groups have explored the supernova-like transient powered by this radioactive decay of material ejected from the NS (Eichler et al. 1989; Li & Paczyński 1998; Kulkarni 2005; Metzger, Piro, Quataert 2008; Metzger et al. 2010; Metzger & Berger 2012). The resultant “kilonova” (dimmer than a supernova and brighter than a nova) would produce relatively isotropic optical/NIR emission after a NS-NS/NS-BH merger. While SNIa light curves are powered primarily by decay of 56Ni, the ejecta from a disrupted NS is neutron rich and yields little Ni. Much heavier radioactive elements form via rapid neutron capture (process) nucleosynthesis following the decompression of the ejecta from nuclear densities. These newly synthesized elements undergo nuclear fission, and decays on much longer time-scales. The resulting energy release can power detectable thermal emission once the ejecta expands sufficiently that photons can escape.
Kasen et al. (2013) argue that the opacity of the expanding process material is dominated by bound–bound transitions from those ions with the most complex valence electron structure, i.e., the lanthanides. They compute atomic structure models for a few representative ions in order to calculate the radiative transition rates for tens of millions of lines, and find that resulting process opacities are orders of magnitude larger than that of ordinary (e.g., iron-rich) supernova ejecta. The resultant light curves should be longer, dimmer, and redder than previously thought (Figure 10). The spectra have broad absorption features and peak in the IR (1 m).
What are the prospects for observing a kilonova in conjunction with a short GRB? The biggest problem is that, since the kilonova emission is weak, it could usually be masked by the normal afterglow. The only hope is for a short GRB occurring in a very low density interstellar medium. Observational confirmation of such an event would be important given that this mechanism may be the predominant source of stable process elements in the universe (Freiburghaus, Rosswog, & Thielemann 1999; Goriely, Bauswein, & Janka 2011).
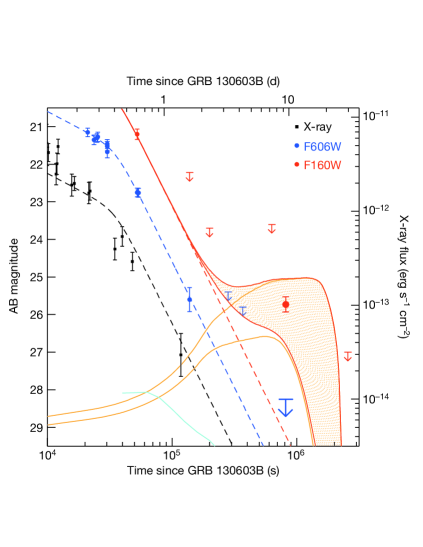
GRB 130603B might be the first detected kilonova (Tanvir et al. 2013; Berger, Fong, & Chornock 2013). It was a short GRB at with a duration 0.2 s in the BAT. Tanvir et al. (2013) present optical and near-infrared observations that provide strong evidence for an accompanying kilonova (Figure 11). If correct, it would confirm that compact-object mergers are the progenitors of short GRBs and also the sites of significant production of process elements. It also offers that hope that kilonovae provide an alternative, unbeamed electromagnetic signature of the most promising sources for direct detection of gravitational waves.
11 Sgr A∗ Flares
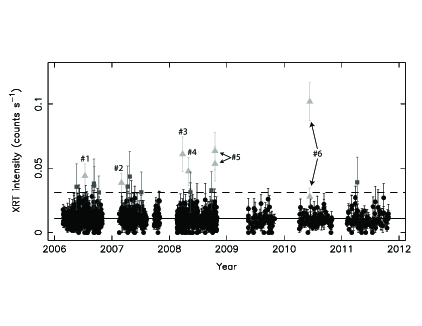
The closest and best studied SMBH lies at the heart of our galaxy, in Sgr A∗. Its bolometric luminosity is lower than expected from an Eddington-limited SMBH of mass by a factor , indicating the heyday of its quasar-like youth is well past. It has long since depleted its “loss cone” (Frank & Rees 1976; Young, Shields, & Wheeler 1977) supply of stars and gas and its very low accretion rate is generally characterized by a radiatively inefficient accretion flow (Narayan, Yi, & Mahadevan 1995; Manmoto, Mineshige, & Kusunose 1997; Dexter et al. 2010; Shcherbakov, Penna, & McKinney 2012). Sgr A∗ emits a steady luminosity erg s-1 in the soft X-ray band (Baganoff et al. 2003), with occasional flaring up by a factor for tens of minutes to hours. For 5 yr beginning in 2006, Swift/XRT observed a region around Sgr A∗. Six flares were seen, with luminosities erg s-1 (Figure 12). Based on the number of observed flares and the total length of observations, Degenaar et al. (2013) estimate a flaring rate d-1. This implies a bright flare with erg s-1 occurs every d. This rate is in accord with previous estimates based on Chandra data (Baganoff et al. 2003).
12 RS Oph nova
Classical and recurrent novae happen in interacting binaries containing a WD accretor and are due to the thermonuclear detonation of accreted material on the surface of a WD (Gallagher & Starrfield 1978). This can occur if the temperature and pressure at the base of the accumulated layer of accreted matter are in the appropriate regime. Swift has opened a new window on nova studies. An overview of the Swift sample of novae (52 galactic plus Magellanic Cloud) is given by Schwarz et al. (2011). Swift has detected keV emission from shocked ejecta and supersoft (SS) emission from the WD surface.
RS Oph is a recurrent nova consisting of a red giant (RG) donor and a white dwarf (WD) accretor residing in a semi-detached (i.e., mass-exchange) binary. About every 20 yr enough material from the RG accumulates on the surface of the WD to produce a thermonuclear explosion. On 12 Feb 2006 a new eruption occurred, reaching . Detailed analysis of Swift observations (Figure 13) indicated a mass ejection of at km s-1 into the wind of the mass losing red giant companion in the system (Osborne et al. 2011).
Supersoft sources (SSSs) are powered by residual nuclear burning on the WD surface following the main nova eruption. Once the nova shell has expanded sufficiently it can become optically thin to keV X-rays so that we can see all the way down to the WD surface and directly observe the nuclear reactions.
RS Oph is unusual in at least three respects compared to most novae: (i) The WD in the system is fairly massive so that the residual nuclear burning happens at a relatively high temperature, K, and the resultant emission fills the keV bandpass. (ii) Its distance is only 2.53 kpc which makes it bright. (iii) RS Oph has a wide orbit with a red giant donor instead of a red dwarf. Thus it is an “embedded nova” because the shell runs into gas previously ejected in the RG wind. Therefore embedded novae are brighter in hard X-rays erg s-1 than normal novae.
Could it be that SSS novae represent transitional objects between normal novae and Type Ia (single degenerate supernovae)? Not likely. It appears that all novae have the potential to be detected as SSS, and we have plenty examples of SSS, all novae, within several kpc. However, selection effects can prevent detection, especially if the absorbing column is too great. We can see the SSS inside a nova if the absorbing column (Osborne et al. 2011).
13 DG CVn Superflare
A basic fact of stellar structure is that early spectral type stars O-B-A have convective cores and radiative envelopes, whereas later spectral type stars A-F-G-K-M have radiative cores and convective envelopes. The dividing point lies at two solar masses which corresponds roughly to an A4 star. Our G2 sun is convective over its outermost 30% in radius. Late type M stars are completely convective (). In a subset of stars of late spectral type the combination of surface convection and high rotation can lead to strong expulsion of magnetic fields from the stellar surface. In stars with outer convection a dynamo operates at the base of the convective envelope, twisting internal dipole field into a tangled geometry. Magnetic buoyancy expels field from the photosphere as active regions. Loops arch outward from the stellar surface, extending from “” to “” polarity. Where two loops cross one can have a massive reconnection event – a superflare.
By contrast, although early spectral type stars such as Ap and Am can have strong magnetic fields, they are convective only at their cores and therefore do not actively transport B-field to outside the star. Thus they do not have stellar flares. Their high fields are only evidenced through Zeeman splitting of photospheric spectral lines.
DG CVn, a close visual dM4edM4e binary with orbital separation 3 AU, is a known flare star system. Both stars have masses and radii 1/3 solar. At 18 pc the system is relatively close. Its kinematics identify it as being young, 30 Myr, and furthermore at least one of the stars is a fast rotator with km s-1. For comparison, if our sun were examined spectroscopically from several pc at a random orientation it would have km s-1.
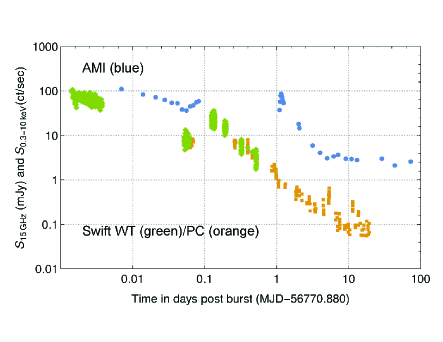
On 23 April 2014 Swift/BAT detected a superflare in DG CVn which reached 0.3 Crab in the keV BAT band. The flare arose from one of the stars in the binary. It consisted of a series of outbursts; the strongest was times more energetic than the largest solar flare ever seen – the Carrington Event of 1859. Time resolved spectral fitting at the peak of the flare implies K and erg s-1 within the XRT keV window. This compares with a normal systemic bolometric luminosity erg s-1. As with a previous superflare seen in 2008 in EV Lac (Osten et al. 2010), for several minutes the X-ray emission from the flare outshone the total light from the system.
Alerted by the Swift/BAT trigger, Fender et al. (2015) detected a bright (100 mJy) radio flare using AMI-LA (Figure 14). This is the earliest detection ever made of bright, prompt, radio emission from a high-energy transient. Although radio emission is known to be associated with active stars, this was the first detection of a large radio flare in conjunction with a gamma-ray superflare.
14 Conclusion
The last ten years have been a time of great discovery for Swift. The sky is rich in transients of many types, and Swift is exploring the transient sky with unprecedented sensitivity and coverage. Every year brings a new discovery in time domain science. Explosion mechanisms range from gravitational collapse to nuclear burning to B field reconnection. Swift will hopefully last another ten years and have exciting science to perform while partnering with new ground observatories of increasing capabilities.
References
- [1] Antonelli L.A., et al. 2005. GCN, 3678, 1.
- [2] Baganoff F.K., et al., 2003. ApJ, 591, 891.
- [3] Barnes J., Kasen D., 2013. ApJ, 775, 18.
- [4] Barniol Duran R., Piran T., 2013. ApJ, 770, 146.
- [5] Barthelmy S.D., et al., 2005. Nature, 438, 994.
- [6] Berger E., 2014. ARA&A, 52, 43.
- [7] Berger E., et al., 2005a. ApJ, 634, 501.
- [8] Berger E. et al., 2005b. Nature, 438, 988.
- [9] Berger E., Zauderer A., Pooley G.G., Soderberg A.M., Sari R., Brunthaler A., Bietenholz M.F., 2012. ApJ, 748, 36.
- [10] Berger E., Fong W., Chornock R., 2013. ApJ, 774, L23.
- [11] Berger E., et al., 2014. ApJ, 796, 96.
- [12] Bloom J.S., et al., 2006. ApJ, 638, 354.
- [13] Bloom J.S., et al., 2009. ApJ, 691, 723.
- [14] Bloom J.S., et al., 2011. Science, 333, 203.
- [15] Burrows D.N., et al., 2005. Science, 309, 1833.
- [16] Burrows D.N., et al., 2011. Nature, 476, 421.
- [17] Campana S., et al., 2006. Nature, 442, 1008.
- [18] Campana S., et al., 2012. MNRAS, 421, 1697.
- [19] Cannizzo J.K., Gehrels N., 2009. ApJ, 700, 1047.
- [20] Cannizzo J.K., Lee H.M., Goodman J., 1990. ApJ, 351, 38.
- [21] Cannizzo J.K., Troja E., Lodato G., 2011. ApJ, 742, 32.
- [22] Castro-Tirado A.J., et al., 2005. A&A, 439, L15.
- [23] Chevalier R.A., Li Z.-Y., 2000. ApJ, 536, 195.
- [24] Chincarini G., et al., 2007. ApJ, 671, 1903.
- [25] Cucchiara A., et al., 2011. ApJ, 736, 7.
- [26] Dall’Osso S., Stratta G., Guetta D., Covino S., De Cesare G., Stella L., 2011. A&A, 526, A121.
- [27] D’Avanzo P., et al., 2005. GCN, 3690, 1.
- [28] D’Avanzo P., et al., 2012. MNRAS, 425, 506.
- [29] Degenaar N., Miller J.M., Kennea J., Gehrels N., Reynolds M.T., Wijnands R., 2013. ApJ, 769, 155.
- [30] Della Valle M., et al., 2006. Nature, 444, 1050
- [31] de Ugarte Postigo A., et al., 2013. CBET, 3529, 1.
- [32] Dexter J., Agol E., Fragile P.C., McKinney J.C., 2010. ApJ, 717, 1092.
- [33] Duffell P.C., MacFadyen A.I., 2014. astro-ph/1407.8250
- [34] Eichler D., Livio M., Piran T., Schramm D.N., 1989. Nature, 340, 126.
- [35] Evans P.A., et al., 2007. A&A, 469, 379.
- [36] Evans P.A., et al., 2009. MNRAS, 397, 1177.
- [37] Falcone A.D., et al., 2007. ApJ, 671, 1921.
- [38] Fender R.P., Anderson G.E., Osten R., Staley T., Rumsey C., Grainge K., Saunders R.D.E., 2015. MNRAS, 446, L66.
- [39] Fong W., Berger E., 2013. ApJ, 776, 18.
- [40] Fong W., Berger E., Fox D.B., 2010. ApJ, 708, 9.
- [41] Fox D.B., et al., 2005. Nature, 437, 845.
- [42] Frank J., Rees M.J., 1976. MNRAS, 176, 633.
- [43] Freiburghaus C., Rosswog S., Thielemann F.-K., 1999. ApJ, 525, L121.
- [44] Fynbo J.P.U., et al., 2006. Nature, 444, 1047.
- [45] Gallagher J.S., Starrfield S., 1978. ARA&A, 16, 171.
- [46] Gal-Yam A., et al., 2005. GCN, 3681, 1.
- [47] Gao W.-H., 2012. ApJ, 761, 113.
- [48] Gehrels N., et al., 2004. ApJ, 611, 1005.
- [49] Gehrels N., et al., 2005. Nature, 437, 851.
- [50] Gehrels N., et al., 2006. Nature, 444, 1044.
- [51] Gehrels N., Ramirez-Ruiz E., Fox D.B., 2009. ARA&A, 47, 567.
- [52] Gezari S., et al., 2006. ApJ, 653, L25.
- [53] Gezari S., et al., 2008. ApJ, 676, 944.
- [54] Ghirlanda G., et al., 2013. MNRAS, 435, 2543.
- [55] Goriely S., Bauswein A., Janka H.-T., 2011. ApJ, 738, L32.
- [56] Grossman D., Korobkin O., Rosswog S., Piran T., 2014. MNRAS, 439, 757.
- [57] Grupe D., Burrows D.N., Patel S.K., Kouveliotou C., Zhang B., Mészáros P., Wijers R.A.M., Gehrels N., 2006. ApJ, 653, 462.
- [58] Guillochon J., Ramirez-Ruiz E., 2013. ApJ, 767, 25.
- [59] Hjorth J., et al., 2003. Nature, 423, 847.
- [60] Hjorth J., et al., 2005a. ApJ, 630, L117.
- [61] Hjorth J., et al., 2005b. Nature, 437, 859.
- [62] Hjorth J., et al., 2012. ApJ, 756, 187.
- [63] Jakobsson P., et al., 2012. ApJ, 752, 62.
- [64] Kasen D., Badnell N.R., Barnes J., 2013. ApJ, 774, 25.
- [65] Kawashima T., Ohsuga K., Usui R., Kawai N., Negoro H., Matsumoto R., 2013. PASJ, 65, L8.
- [66] Kennicutt Jr R.C., 1998. ARA&A, 36, 189.
- [67] Kobayashi S., Zhang B., 2003a. ApJ, 582, L75.
- [68] Kobayashi S., Zhang B., 2003b. ApJ, 597, 455.
- [69] Kohn S.A., et al., 2015. MNRAS, 448, 1494.
- [70] Komossa S., Halpern J., Schartel N., Hasinger G., Santos-Lleo M., Predehl P., 2004. ApJ, 603, L17.
- [71] Krühler T., et al., 2012. ApJ, 758, 46.
- [72] Kulkarni S.R., 2005. astro-ph/0510256
- [73] Kumar P., Panaitescu A., 2000. ApJ, 541, L51.
- [74] Kumar P., Narayan R., Johnson J.L., 2008. MNRAS, 388, 1729.
- [75] Kumar P., Barniol Duran R., Bošnjak Ž., Piran T., 2013. MNRAS, 434, 3078.
- [76] Laskar T., et al., 2013. ApJ, 776, 119.
- [77] Lattimer J.M., Mackie F., Ravenhall D.G., Schramm D.N., 1977. ApJ, 213, 225.
- [78] Lei W.-H., Zhang B., Gao H., 2013. ApJ, 762, 98.
- [79] Levan A.J., et al., 2011. Science, 333, 199.
- [80] Levan A.J., Cenko S.B., Perley D.A., Tanvir N.R., 2013. GCN, 14455, 1.
- [81] Levan A.J., et al., 2014. ApJ, 792, 115.
- [82] Li L.-X., Paczyński B., 1998. ApJ, 507, L59.
- [83] Maiolino R., Schneider R., Oliva E., Bianchi S., Ferrara A., Mannucci F., Pedani M., Roca Sogorb M., 2004. Nature, 431, 533.
- [84] Mangano V., Burrows D.N., Sbarufatti B., Cannizzo J.K., 2015. ApJ, submitted.
- [85] Manmoto T., Mineshige S., Kusunose M., 1997. ApJ, 489, 791.
- [86] Maselli A., et al., 2014. Science, 343, 48.
- [87] Mazzali P.A., et al., 2006. Nature, 442, 1018.
- [88] Mazzali P.A., et al., 2008. Science, 321, 1185.
- [89] Melandri A., et al., 2014. A&A, 567, A29.
- [90] Metzger B.D., Berger E., 2012. ApJ, 746, 48.
- [91] Metzger B.D., Piro A.L., Quataert E., 2008. MNRAS, 390, 781.
- [92] Metzger B.D., et al., 2010. MNRAS, 406, 2650.
- [93] Metzger B.D., Giannios D., Mimica P., 2012. MNRAS, 420, 3528.
- [94] Michałowski M.J., et al., 2012. ApJ, 755, 85.
- [95] Michałowski M.J., et al., 2014. A&A, 562, A70.
- [96] Milvang-Jensen B., Fynbo J.P.U., Malesani D., Hjorth J., Jakobsson P., Møller P., 2012. ApJ, 756, 25.
- [97] Nousek J.A., et al., 2006. ApJ, 642, 389.
- [98] O’Brien P.T., et al., 2006. ApJ, 647, 1213.
- [99] O’Brien P.T., Rowlinson A., 2012. in IAU Symp. 279, Death of Massive Stars: Supernovae and Gamma-Ray Bursts, ed. P.W.A. Roming, N. Kawai, & E. Pian, (Cambridge: Cambridge Univ. Press), 297.
- [100] Osborne J.P., et al., 2011. ApJ, 727, 124.
- [101] Osten R.A., et al., 2010. ApJ, 721, 785.
- [102] Ota K., et al., 2014. ApJ, 792, 34.
- [103] Ouchi M., et al., 2013. ApJ, 778, 102.
- [104] Narayan R., Yi I., Mahadevan R., 1995. Nature, 374, 623.
- [105] Nava L., et al., 2012. MNRAS, 421, 1256.
- [106] Perley D.A., et al., 2014. ApJ, 781, 37.
- [107] Phinney E.S., 1989. in IAU Symp. 136, The Center of the Galaxy, ed. M. Morris (Dordrecht: Kluwer), 543.
- [108] Pian E., et al., 2006. Nature, 442, 1011.
- [109] Pines D., Alpar M.A., 1985. Nature 316, 27.
- [110] Prochaska J.X., et al., 2005. GCN, 3700, 1.
- [111] Racusin J.L., et al., 2008. Nature, 455, 183.
- [112] Rees M.J., 1988. Nature, 333, 523.
- [113] Ricker G.R., et al., 2003. in AIP Conf. Ser. 662, Gamma-Ray Burst and Afterglow Astronomy 2001: A Workshop Celebrating the First Year of the HETE Mission, ed. G.R. Ricker & R.K. Vanderspek (Mellville: AIP), 3.
- [114] Rieke G.H., Alonso-Herrero A., Weiner B.J., Pérez-González P.G., Blaylock M., Donley J.L., Marcillac D., 2009. ApJ, 692, 556.
- [115] Rowlinson A., O’Brien P.T., Metzger B.D., Tanvir N.R., Levan A.J., 2013. MNRAS, 430, 1061.
- [116] Salvaterra R., et al., 2009. Nature, 461, 1258.
- [117] Salvaterra R., et al., 2012. ApJ, 749, 68.
- [118] Sari R., Piran T., 1999a. ApJ, 517, L109.
- [119] Sari R., Piran T., 1999b. ApJ, 520, 641.
- [120] Sari R., Piran T., Narayan R., 1998. ApJ, 497, L17.
- [121] Schwarz G.J., et al., 2011. ApJS, 197, 31.
- [122] Shcherbakov R.V., Penna R.F., McKinney J.C., 2012. ApJ, 755, 133.
- [123] Shen R.-F., Matzner C.D., 2014. ApJ, 784, 87.
- [124] Soderberg A.M., et al., 2006. Nature, 442, 1014.
- [125] Soderberg A.M., Chandra P., Frail D., 2008. GCN, 7506, 1.
- [126] Soderberg A.M., et al., 2008. Nature, 453, 469.
- [127] Stone N., Sari R., Loeb A., 2013. MNRAS, 435, 1809.
- [128] Tagliaferri G., et al., 2005. Nature, 436, 985.
- [129] Tanaka M., Hotokezaka K., 2013. ApJ, 775, 113.
- [130] Tanvir N.R., et al., 2009. Nature, 461, 1254.
- [131] Tanvir N.R., Levan A.J., Fruchter A.S., Hjorth J., Hounsell R.A., Wiersema K., Tunnicliffe R.L., 2013. Nature, 500, 547.
- [132] Tchekhovskoy A., Metzger B.D., Giannios D., Kelley L.Z., 2014. MNRAS, 437, 2744.
- [133] Villasenor J.S., et al., 2005. Nature, 437, 855.
- [134] Wang W.-H., Chen H.-W., Huang K.-Y., 2012. ApJ, 761, L32.
- [135] Xu D., et al., 2013. ApJ, 776, 98.
- [136] Yamazaki R. 2009. ApJ, 690, L118.
- [137] Young P.J., Shields G.A., Wheeler J.C., 1977. ApJ, 212, 367.
- [138] Zauderer B.A., Berger E., Margutti R., Pooley G.G., Sari R., Soderberg A.M., Brunthaler A., Bietenholz M.F., 2013. ApJ, 767, 152
- [139] Zhang B., Fan Y.Z., Dyks J., Kobayashi S., Mészáros P., Burrows D.N., Nousek J.A., Gehrels N., 2006. ApJ, 642, 354.
- [140] Zou Y.C., Wu X.F., Dai Z.G., 2005. MNRAS, 363, 93.